
|
|
1.IntroductionDiabetes and other debilitating conditions are diagnosed, treated, and monitored by blood sampling. For diabetics, diet, insulin regulation, and glucose monitoring ameliorate serious complications. The primary devices for glucose monitoring, finger stick-based glucose meters, suffer from issues, such as human error and meter/strip quality as well as being susceptible to interfering factors.1–3 Poor control of blood glucose levels can result in complications affecting the eyes, heart, kidneys, nerves, and feet.4 In addition, development of hypoglycemia or hyperglycemia can lead to death. Finger pricking multiple times throughout the day hinders the accurate identification of trends, reduces compliance, and increases the risk of complications.3,4 Thus, there is an urgent need to explore continuous blood analyte sensing. Continuous glucose monitoring systems (CGMS) have limited sensing lifetime and must address immunogenicity, selectivity, and biodegradation issues. Current CGMS have lifetimes on the order of 10 days and require frequent recalibration, often using a standard finger prick.5–7 In addition, implantable CGMS can trigger undesirable immune response, resulting in fibrotic tissue separating the device from blood vessels and surrounding tissue. This separation can lead to inaccuracy, a shorter lifetime, and niches susceptible to infection.8,9 Hence, new monitoring methods must be investigated. Erythrocytes functionalized with optical sensors, or erythrosensors, could address the need for a biocompatible, long-term monitoring platform. This approach to blood analyte monitoring relies on isolating erythrocytes, loading them with fluorescent sensors, and injecting the erythrosensors into circulation for analyte monitoring.10,11 The erythrosensors’ fluorescent signal can be excited and detected noninvasively through the skin. With the goal of developing erythrosensors, erythrocyte functionalization, or loading, must conserve features such as shape, surface morphology, size, and hemoglobin content. Native erythrocytes (NEs) preserve key properties, such as volume and hemoglobin content as they alter shape to transit the circulatory system. Bovine erythrocytes measure around in diameter and have a life span of 160 days, whereas human erythrocytes are around in diameter and have a life span of 120 days.12,13 The characteristic biconcave shape maximizes the surface area for oxygen exchange and enables deformation for navigation through the smallest capillaries with deformation depending on the diameter of the capillary and the flow rate. Aging erythrocytes present abnormalities in size and morphology due to changes in the cytoskeleton, membrane, and/or precipitation of hemoglobin. Ultimately, the reticulum endothelial system (RES) takes senescent erythrocytes out of circulation.14,15 Thus, the “simple” architecture of erythrocytes is, in fact, a complex network of mechanical, chemical, and biological interactions determining cell survival. Several mechanical, chemical, and electrical techniques have been explored to load carrier erythrocytes for drug delivery and as contrast agents for imaging.16 Changing erythrocytes’ osmotic conditions or inducing electrical breakdown drives reversible pore formation, but under extreme conditions, it leads to lysis of the membrane.17 With stable pore formation, diffusion allows entrance and exit through membrane pores as equilibration with the external environment occurs.18–20 Procedures based on hypotonic conditions have been explored for erythrosensor production.19,21,22 To date, researchers have studied hypotonic dialysis and hypotonic dilution to produce erythrosensors.10,11 Variants of the hypotonic dialysis technique, employing a dialysis tubing filled with erythrocytes immersed in a hypotonic buffer, allow cargo diffusion through the dialysis membrane and erythrocyte membrane for entrapment, while the dialysis membrane maintains the erythrocyte and hemoglobin concentrations. Hypotonic dilution consists of diluting erythrocytes in hypotonic solution to create pores and quickly reseal the membrane using a hypertonic buffer at 37°C without the use of dialysis membrane. The change in osmolarity creates pores through the erythrocyte membrane and allows cargo loading as erythrocytes equilibrate with the extracellular environment.23 These membrane pores allow relatively large molecules to diffuse into the cells and generally lead to loading efficiency. Previous work has shown that the emission spectrum of erythrosensors loaded with fluorescein isothiocyanate conjugated with glycylglycine (FITC-glygly) was equivalent to the emission by free FITC-glygly and was able to track extracellular pH.11 Hypotonic dilution remains the simplest and fastest loading technique. However, the resulting erythrosensor physical characteristics and cargo location within the erythrocyte remain unknown.24,25 Electroporation is an alternative loading technique that relies on short, intense electrical charges to create transmembrane pores and allow cargo entrance. Due to the membrane potential difference and reversible electric breakdown, the membrane phospholipid reassembles forming hydrophilic pores.26 This technique is used for drug delivery and transformation/transfection applications because the pore size is tunable through electroporation conditions.27–29 Zimmermann et al.30 showed data indicating that, although bovine erythrocytes have smaller diameter, they require higher field strength for breakdown than human erythrocytes. At 0°C, the pores are stable while increasing the temperature rapidly reseals the membrane.31 Limitations associated with current techniques include low encapsulation efficiency, nonuniform dye loading, and loss of hemoglobin, which affect intrinsic cellular functions.28 Under optimal conditions, erythrocytes loaded using this technique have high cell recovery, maintain their size and shape, and show normal in vivo circulation times.32 These attributes motivated the evaluation of electroporated erythrocytes for use as erythrosensors. Optimal long-term erythrosensor performance depends on preserving erythrocyte properties while incorporating sensing capabilities. The loss of hemoglobin during the loading process leads to irreversible morphological changes.32–34 These morphological changes in erythrocytes can subsequently lead to increased stiffness, halting their ability to squeeze through capillaries, and causing clogging as well as cellular removal.14 Furthermore, reports of carrier erythrocyte cellular modifications, leading to rapid clearance through the RES, a target for drug delivery, and phagocytosis, have limited their implementation in other applications.14,15,35 Pathological and NEs have been extensively studied using atomic-force microscopy (AFM).36–38 Despite the advantages of using erythrocytes as carrier systems for optical sensors and drug delivery, little is known about the cellular characteristics of the loaded cells. Brähler et al.39 found that carrier erythrocytes with magnetite cargo loaded via a hypoosmotic technique had a rugged cross-section profile as evaluated via AFM. This data served as motivation and a guide for continued comparative investigations of the properties of NEs and erythrosensors using AFM. The work described here offers insight into maximizing loading of an optically active cargo, FITC-glygly, into erythrocytes by optimizing and implementing loading protocols. We focus on exploring the loading impact on erythrosensors created via hypotonic dilution. To understand the erythrosensor morphology, loading uniformity, and volume-loading capacity, both confocal microscopy and AFM are used. The cellular properties and the fluorescent signal of two different loading procedures, hypotonic dilution and electroporation, were evaluated (Fig. 1). Work in the drug delivery field using erythrocytes has demonstrated that general loading principles apply across species. For example, studies for the encapsulation of L-asparaginase as a therapeutic molecule in erythrocytes have been carried out in mice, monkeys, and humans.40–42 Although the specifics of loading change slightly with species, erythrocytes from different species respond to osmolarity changes and electrical charges similarly. This study investigates bovine erythrosensors as a model system for carrying capabilities and identifies detrimental cellular modifications for long-term monitoring. Fig. 1Loading of erythrocytes via electroporation and dilution. Isolated erythrocytes were subjected to either electroporation or hypotonic dilution. Electroporation relies on the application of electrical charges to disrupt the membrane potential, allowing cargo entrance and requiring resealing to complete loading. Cells that underwent dilution are lysed and subsequently resealed to encapsulate cargo.  2.Materials and Methods2.1.Fluorescein Isothiocianate-GlycylglycineFITC was conjugated with glygly and used as cargo. FITC, a pH sensitive dye used as a chemical sensor in biological materials, has excitation and emission peaks at 492 and 518 nm, respectively. This wavelength region facilitates fluorescence data collection and study of the distribution within the erythrosensors. As model cargo, the glygly addition makes FITC-glygly impermeable once encapsulated, preventing spontaneous leakage. Moreover, FITC-glygly conjugate has been shown to conserve its emission curve when encapsulated within erythrocytes.11 FITC and glygly were diluted in water at a 1:4 molar ratio for a final concentration of 5 mM FITC and 20 mM glygly at pH 9.0. Conjugation was achieved by mixing at room temperature for 30 min. This preparation was made immediately before use and maintained in the dark at 4°C. FITC and glygly were obtained from Sigma-Aldrich. 2.2.Hypotonic DilutionThe temperature of hypotonic lysis buffer ( solution consisting of 10 mM , 20 mM EDTA, 50 mM phosphate buffer, and 1 mM urea) was lowered to 0°C to 2°C, and 1-ml FITC-glygly at pH 9.0 was mixed in 25 ml of hypotonic lysis buffer (2.5 ml of lysis buffer of deionized water). Packed bovine erythrocytes (2 ml) were diluted in 25 ml of the aqueous lysis solution with FITC-glygly and incubated for 10 min. Then 2.5 ml of concentrated hypertonic lysis buffer () was added followed by incubation for 10 min at 0°C before raising the temperature to 37°C and incubating for 30 min. To increase loading efficiency and generate more uniformly loaded erythrocytes, the solution was mixed throughout the procedure and an extra centrifugation step to separate loaded erythrosensors was introduced at the end of the procedure. Cells were gently shaken throughout the process. The resultant sample pellet was washed with an isotonic buffer solution. To eliminate FITC-glygly and debris aggregates, the sample was passed through a membrane and suspended at 50% hematocrit (hct) for immediate analysis. To identify auto fluorescence, erythrocytes were subjected to the hypotonic dilution procedure without FITC-glygly (EH). 2.3.ElectroporationPacked erythrocytes (2 ml) were resuspended in 25 ml of electroporation buffer. The temperature of packed erythrocytes was lowered and maintained between 0°C and 4°C in order to expand the lifetime of the transient pores formed. FITC-glygly was prepared as before (5 mM FITC and 20 mM glygly), and just before electroporation, 1 ml of FITC-glygly was added to the erythrocytes suspended in electroporation buffer. Then, the mixed erythrocytes were aliquoted into electroporation 0.2 cm cuvettes for sample. Electroporation was performed using a Bio-Rad Gene Pulser Xcell™ system at different electric fields (250, 300, and 750 V with a square-wave pulse ranging from 0.5 to 5 ms and the intervals of 5 to 15 min for a total of four cycles). Cells were incubated for 10 min at 4°C after electroporation. Then the samples were diluted 1:2 in resealing solution consisting of 8 mM KCL (P9541-Sigma), 150 mM NaCl (s9888-Sigma), 6 mM (s5011-Sigma), 10 mM D-Glucose (g8270-Sigma), 2 mM (M8266-Sigma), and 1% bovine serum albumin (BSA), pH 7.4. Resealing was promoted by incubation at 37°C for 30 min, followed by an incubation at 4°C for 24 h. Loaded erythrocytes were washed with phosphate buffer saline (PBS) by centrifugation and resuspended at 4°C at an initial 50% hct. The sample was further diluted depending on the experiment and analyzed immediately. To control auto fluorescence, erythrocytes were electroporated (EE) at 300 V amplitude and 1-ms pulse width without FITC-glygly (fluorescent cargo), if a fluorescent signal in this control indicates endogenous fluorescence. To identify spontaneous uptake of FITC-glygly, if any, a second control sample was prepared, taking an aliquot of the mixed erythrocytes suspended in electroporation buffer with FITC-glygly in an electroporation cuvette (the same volume as above) which was incubated between 0°C and 4°C for the total time of electroporation (35 to 95 min), but the samples were not electroporated. Then, the samples were handled and evaluated just as the experimental samples. 2.4.Fluorescence MicroscopyFollowing encapsulation, samples were suspended in 1% BSA diluted in PBS for immediate imaging using a Nikon TE2000 epifluorescent microscope. Nikon blue excitation block B-2E/C was used to excite FITC, which absorbs at 492 nm. A sample was taken from a 25% hct sample and placed on a microscope slide and covered with a 0.15-mm coverslip for imaging. The corrected total cell fluorescence (CTCF) for the samples was calculated using randomly selected cells from each group (Electroporation 300 V, hypotonic dilution and controls). Using ImageJ 1.48v5, the average cell and background fluorescence were used in the following equation: Roundness was evaluated using ImageJ in which attributes range from 0 (for an infinitely elongated polygon) to 1 (corresponding to a perfect circle). As per condition, four images and a total of 100 to 150 cells were evaluated. Analysis using ImageJ was performed on uniform samples of randomly chosen cells for each micrograph. 2.5.Confocal MicroscopyErythrosensors loaded via hypotonic dilution and controls were fixed in 0.025% glutaraldehyde to increase mechanical strength and stability. Then, a of total sample recovered was immobilized on a poly-L-lysine (PLL)-coated slide for imaging. Confocal fluorescence microscopy was performed using an Olympus FV1000 confocal microscope. A objective with a 1.4 numerical aperture was used to image the fluorescence emission under 488 nm (argon) laser excitation with an emission filter at 505 to 575 nm. Planar images were taken at intervals through the sample sequentially. Reconstruction and analysis of 3-D images were performed using the standard Olympus FV10-ASW and Image J 1.48v5, subsequently. 2.6.SpectrophotometryHemoglobin and FITC-glygly concentrations were determined using the Hitachi U-4100 UV-vis-NIR spectrophotometer. The absorbance of retained oxygenated hemoglobin was measured in lysed NEs as control and erythrosensors samples (produced via hypotonic dilution and electroporation) at 540 nm. Absorbance measurements were recorded on the same day. Samples (10% hct) were diluted to 1% hct in deionized water and taken to 100% lysis. Referencing the hemoglobin concentration in bovine blood ranges as 8 to , the absorbance data from a pool of NE were calculated and a standard curve was constructed. 2.7.Atomic Force MicroscopyTo produce AFM topographical images of erythrosensors and NEs, cells were fixed using 0.025% glutaraldehyde and immobilized on a PLL-coated glass slide. A Bruker Dimension Icon AFM was used for scanning and obtaining topographical images from erythrosensors and NEs. A diamond tapping tip (Bruker tip MPP21000 RSFP ) and the ScanAsyst, an image-optimization scanning mode, in tapping mode were used to image the samples. Using ScanAsyst, the system continuously monitors image quality and makes parameter adjustments to optimize image acquisition. This enables the mode to operate at lower force than standard tapping mode and uses the force curves as an imaging feedback signal. Erythrocytes are delicate samples; hence, a combination of ScanAsyst (liquid) and tapping mode (air) was used for AFM experiments to minimize force applied to the sample. The scan size was , the rate was 0.500 Hz, and there were . To quantify the surface roughness, the mean of the absolute vertical deviation from the mean line of the topographical profile, roughness average (Ra), was calculated. Briefly, a section was chosen from six different topographical images (three NEs as control and three as erythrosensors images). From each cell, three Ra values were calculated and averaged using the Nanoscope software version 6.14. 3.ResultsElectroporation loading of FITC-glygly into isolated bovine erythrocytes was evaluated under different conditions. Erythrocytes electroporated at 200, 300, and 750 V were found to have average diameters of (average ± stdev), , and stdev, respectively (data not shown). Electroporated at 300 V, erythrocytes maintained an average diameter of , which lies in the lower margin of the NE cell range. Although erythrocytes loaded using a 750 V amplitude had a larger diameter size, they also demonstrated a variation in size that could account for swollen erythrocytes, lysed erythrocytes, and debris fragments. Increasing the amplitude (200, 300, 400, 750, and 1000 V), and thus the field of strength, decreased the hct of recovered erythrosensors. Erythrosensors loaded via electroporation had the highest fluorescence per cell when four 0.5-ms pulses of 300 V amplitude were applied using a 0.2-cm cuvette, equivalent to an electric field strength of . These conditions were used for the rest of the experiments. Fluorescence micrographs were used to evaluate the relative cell fluorescence from erythrosensors loaded via hypotonic dilution and electroporation (Fig. 2). Erythrocytes loaded via hypotonic dilution had an average of four times more fluorescence intensity than cells loaded using electroporation (). Erythrocytes that go through the loading procedures (electroporation or hypotonic dilution) lacking the fluorescent cargo FITC-glygly did not display auto fluorescence. Neither EE nor EH exhibited auto fluorescence associated with the opening of pores via hypotonic dilution or electroporation. A circular outline is seen in the fluorescent and bright-field micrographs for erythrosensors resulting from both techniques, the hypotonic dilution and electroporation. However, the erythrocytes characteristic biconcave shape is not readily evident from the micrograph (Fig. 2). Additionally, fewer erythrocytes were recovered after hypotonic dilution than after electroporation with only 10% to 20% of the initial sample recovered using hypotonic dilution, whereas 40% to 50% of the sample was recovered using electroporation. Fig. 2Bovine erythrocytes loaded via either electroporation or dilution and fluorescence per cell revealed as a measure of loading efficiency. Bright-field imaging shown on top and corresponding fluorescence images shown below. Cell’s integrated density, area, and the mean fluorescence of the background were used to evaluate the relative mean fluorescence signal per cell. Bars indicate standard deviation ().  From the micrographs, the diameter and roundness were evaluated in erythrosensors and compared with the values of NEs (Fig. 3). Additionally, the hemoglobin retained was evaluated in erythrosensors and compared with the values of NEs using spectrophotometry (Fig. 3). Diameters were significantly different among erythrosensors created by electroporation, hypotonic dilution, and NEs as control. The average cell diameter of the NEs measured (), significantly greater than the published bovine erythrocytes’ diameter of .12,43,44 The erythrocytes, which underwent dilution and electroporation, measured and , respectively. In terms of roundness, there was no significant difference between NEs as control and erythrosensors generated using electroporation or hypotonic dilution. The roundness values for electroporated, dilution, and control samples were , , and , respectively. Bovine erythrocytes contain between 8 and hemoglobin.12 The hemoglobin in the NEs, as control samples, was estimated between 7 and , which correlates well with the values found in the literature.12 The average hemoglobin concentration inside erythrosensors loaded via electroporation was . Thus, electroporated erythrocytes lost of their total hemoglobin on average. The concentration of hemoglobin inside the erythrosensors loaded via hypotonic dilution was . Thus, erythrosensors produced via hypotonic dilution lost of their total hemoglobin content on average. Although erythrosensors created using electroporation retained higher concentrations of hemoglobin, both hypotonic dilution and electroporation erythrosensors lost significant portions of their hemoglobin. This loss could present a challenge to the in vivo survival of erythrosensors. Fig. 3Characterization of erythrosensor size, shape, and hemoglobin retention compared with control NEs. Hemoglobin concentration inside erythrosensors. Absorbance at 540 nm of hemoglobin in sample of lyse control NEs, erythrosensors prepared using the hypotonic dilution and electroporation technique. Bars indicate standard deviation (, ).  The low loading efficiency of the electroporation technique would make it difficult to develop an effective in vivo erythrosensor-based measurement system. Thus, confocal microscopy was used to evaluate key population features in the erythrosensors generated using hypotonic dilution. Confocal fluorescent micrographs show nonuniform loading of the sample (Fig. 4). A representative confocal Z-stack created using a step size of to evaluate the loading uniformity of the population and of the FITC-glygly entrapment. The sequential images were processed to create the volumetric image and then rotated 90 deg over the -axis to reveal the distribution of FITC-glygly. The 3-D images rendered insight into erythrosensors’ shape and demonstrated volume loading. In addition to the erythrosensors distinctive round shape, the micrographs revealed a population of erythrocytes with loading efficiency and a nonuniform fluorescence signal. Fig. 4Confocal microscopy erythrosensors loaded via hypotonic dilution technique entrapping FITC-glygly. (a) Volume rendering sequence of FITC-glygly-loaded erythrosensors showing their spherical shape. (b) Representative micrographs of erythrosensors exhibiting loading heterogeneity of the resulting population. Bright-field imaging and fluorescence are shown at the top and the bottom, respectively. 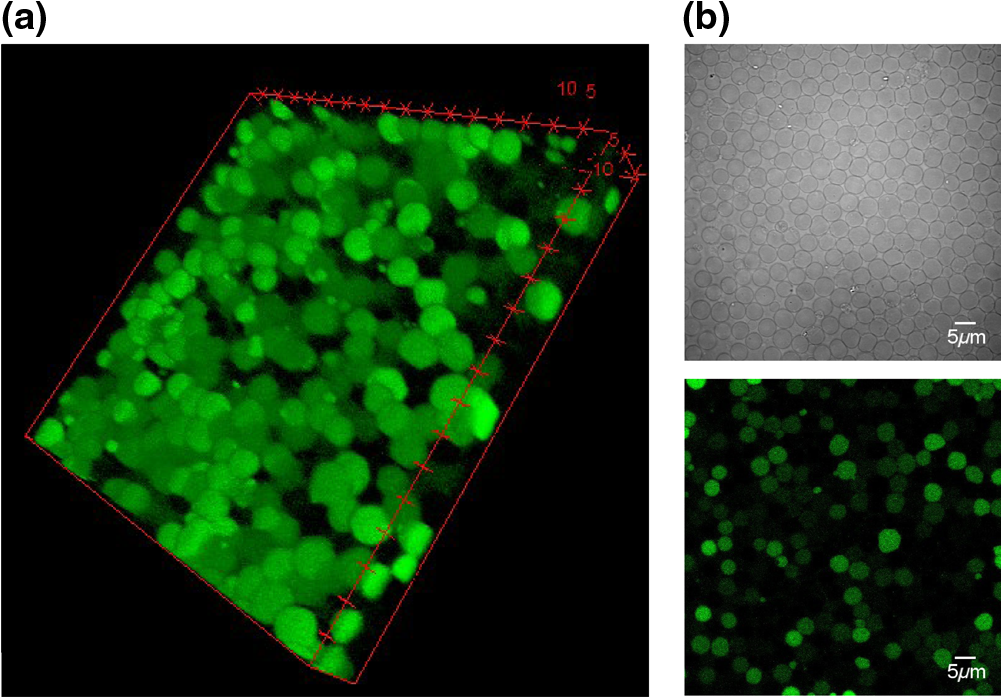 To further understand the changes in morphology, AFM was used to study the topography and the cross-section profile of NEs (control) and hypotonic dilution erythrosensors. AFM results show a area and the corresponding topographical image [Fig. 5(a)]. Control erythrocytes exhibit a characteristic shape and dimensions with a toroidal shape with a diameter. The hypotonic dilution erythrosensors showed a corrugated, round, and flat shape with a diameter of . Comparing the surface profile of erythrocytes and erythrosensors revealed major morphological changes. The highest peaks detected on the erythrosensors topography average compared with in the control. Erythrosensors, although similar in diameter, had a greater variability in diameter and had a height only half that of normal bovine erythrocytes. Fig. 5Erythrosensors’ topography reveals hills and valleys in their surface. (a) The height of the erythrosensors shown in these images lies between 481 and 883 nm. (b) Ra value measuring the mean of the absolute vertical deviation from mean line of the topographical profile. Bars indicate standard deviation ().  The roughness of the topography of the control erythrocytes and the erythrosensors exhibit differences in the topographical images. The Ra value was found to be greater in erythrosensors [Fig. 5(b)]. The surface roughness of erythrosensors, as measured by the Ra value (0.2 nm), is rougher than the surface of NEs (0.14 nm). The evidence suggests that erythrosensors loaded via hypotonic dilution exhibit morphological changes that could compromise erythrosensor in vivo life span. 4.DiscussionIn advance of employing erythrocytes as a sensor platform, we explored erythrosensor fluorescent signal, dimensions, morphology, and hemoglobin retention. These are essential features to maintain erythrosensors in circulation for long-term monitoring. Loading procedures were optimized around encapsulation of pH sensitive FITC-glygly in erythrocytes for both hypotonic dilution and electroporation. Comparing these loading techniques, erythrosensors produced via hypotonic dilution resulted in higher loading efficiency. Higher loading of the optical sensor is crucial for providing sufficient optical signal for long-term, noninvasive measurements based on erythrosensors reinfused into circulation. The diameter of electroporated erythrocytes (with and without FITC-glygly) is smaller when compared with NEs likely due to the loss of cell content. This is supported by the fact that erythrocytes electroporated with cargo FITC-glygly (erythrosensors) have a larger diameter than erythrocytes electroporated without FITC-glygly (EE). When loading erythrocytes via electroporation, the cells maintained higher hemoglobin concentration than the dilution method, but still lost approximately half of their total hemoglobin. The loss of hemoglobin in both cases could be an impediment to erythrosensor survival in circulation. This study suggests that hemoglobin levels and cargo loading concentrations are inversely related. These findings are especially useful as a basis to standardize the characterization erythrosensors for use in an erythrosensor-based blood analyte monitoring system. Erythrocytes loaded via hypotonic dilution and electroporation maintained a rounded shape. Abnormal shapes indicate cytoskeleton or membrane disruption or secondary issues including precipitation of hemoglobin. Thus, the shape of the erythrocyte and erythrosensors can be used as a marker of functionality and integrity of the cell membrane and the cytoskeleton. Our findings (i.e., misshape of erythrosensors and loss of hemoglobin) suggest that an alternative loading to produce erythrosensors that better mimic NEs must be found for long-term monitoring. One of the attributes of the erythrosensors loaded via hypotonic dilution is the emission of a stronger fluorescent signal when compared with electroporated erythrosensors, which motivated the in-depth study of the hypotonic dilution loading technique. Further characterization of the fluorescence signal emitted by FITC-glygly from erythrosensors resulting from hypotonic dilution revealed a nonuniformly loaded population. The use of an extra centrifugation step to further concentrate loaded erythrosensors was established as a standard for the study of erythrosensors via confocal microscopy and AFM. Isolating erythrosensors with similar fluorescence increases the chances that, for example during AFM topographical images, the erythrosensors studied will be loaded with FITC-glygly. Most importantly, it was demonstrated that the erythrosensors were volume loaded with FITC-glygly. Before this study, the location of the cargo in carrier erythrocytes was not well characterized. Although previous studies suggested the entrapment of cargo, there was no conclusive evidence of volume loading.10,11,35 Erythrosensors loaded via hypotonic dilution deformed, and their surface topography became rugged. After verifying erythrosensors’ integrity via AFM, it was confirmed that erythrosensors loaded via hypotonic dilution lost the NE architecture consistent with Brähler et al.'s39 findings, in which the cellular changes of carrier erythrocytes were first studied via AFM. The use of AFM to characterize erythrosensors provided a route to explore these changes in conjunction for fluorescence studies. Here, the characterization of erythrosensors loaded using the hypotonic dilution included the evaluation of size, morphology, hemoglobin retention, and loading uniformity. Decreased size, increased deformations, and rugged topography were some of the erythrosensor attributes found here. The cellular artifacts of carrier erythrocytes and erythrosensors were not well understood and further exploration/optimization of the loading techniques will be required to minimize cellular alterations and potentially increase lifetime circulation as a long-term bloodstream monitoring platform. 5.ConclusionsBecause of their simplicity, biocompatibility, and biodegradability, erythrocytes are an appealing platform for blood-based delivery and monitoring. Erythrocytes depend on a variety of properties including cell size, shape, and hemoglobin content to fulfill their physiological roles. Although sensor functionalized erythrocytes, a.k.a. erythrosensors, offer an intriguing solution for long-term blood analyte monitoring, several factors can influence the yield, integrity, and performance of the erythrosensors. For example, the functionalization process could have deleterious effects on cell structure and/or function. Thus, the cellular properties of erythrosensors will impact their functionality as a long-term monitoring platform. This study sought deeper insight into cellular changes experienced by erythrosensors loaded via common techniques, hypotonic dilution, and electroporation. Morphological changes in erythrosensors and carrier erythrocytes after hypotonic dilution and electroporation loading were previously not well investigated. This study strove to develop protocols for the characterization of the physical properties of erythrosensors and identify how erythrosensors differ from NEs. Although hypotonic dilution appears to load erythrosensors with sufficient cargo, the identified cellular changes could jeopardize the erythrosensors’ ability to mimic NEs and function as a long-term sensor platform in the bloodstream. From this study, neither hypotonic dilution nor electroporation provide erythrosensors that precisely mimic erythrocytes. Therefore, this study provides a step toward understanding the cellular properties of erythrosensors and standardizing methodologies to assess carrier erythrocytes and erythrosensors. DisclosuresThe authors have no affiliations with or involvement in any organization or entity with any financial interest or nonfinancial interest in the subject matter or materials discussed in this paper. AcknowledgmentsThis material is based upon work supported by the Texas A&M diversity fellowship and the Alfred P. Sloan Foundation graduate scholarship. ReferencesW. L. Clarke et al.,
“Evaluating clinical accuracy of systems for self-monitoring of blood glucose,”
Diabetes Care, 10
(5), 622
–628
(1987). http://dx.doi.org/10.2337/diacare.10.5.622 DICAD2 0149-5992 Google Scholar
S. Clarke and J. Foster,
“A history of blood glucose meters and their role in self-monitoring of diabetes mellitus,”
Br. J. Biomed. Sci., 69
(2), 83
–93
(2012). BJMSEO 0967-4845 Google Scholar
W. Cheng et al.,
“Calibration of glucose oxidase-based test strips for capillary blood measurement with oxygen saturated venous blood samples,”
Clin. Chim. Acta, 415
(0), 152
–157
(2013). http://dx.doi.org/10.1016/j.cca.2012.10.033 CCATAR 0009-8981 Google Scholar
D. Marrero et al.,
“Impact of diagnosis of diabetes on health-related quality of life among high risk individuals: the Diabetes Prevention Program outcomes study,”
Qual. Life Res., 23
(1), 75
–88
(2014). http://dx.doi.org/10.1007/s11136-013-0436-3 QLREEG Google Scholar
C. M. Li et al.,
“Implantable electrochemical sensors for biomedical and clinical applications: progress, problems, and future possibilities,”
Curr. Med. Chem., 14
(8), 937
–951
(2007). http://dx.doi.org/10.2174/092986707780362970 CMCHE7 0929-8673 Google Scholar
D. B. Keenan et al.,
“Accuracy of the Enlite 6-day glucose sensor with guardian and Veo calibration algorithms,”
Diabetes Technol. Ther., 14
(3), 225
–231
(2012). http://dx.doi.org/10.1089/dia.2011.0199 Google Scholar
M. Christiansen et al.,
“A new-generation continuous glucose monitoring system: improved accuracy and reliability compared with a previous-generation system,”
Diabetes Technol. Ther., 15
(10), 881
–888
(2013). http://dx.doi.org/10.1089/dia.2013.0077 Google Scholar
E. G. Moser, A. A. Morris and S. K. Garg,
“Emerging diabetes therapies and technologies,”
Diabetes Res. Clin. Pract., 97
(1), 16
–26
(2012). http://dx.doi.org/10.1016/j.diabres.2012.01.027 DRCPE9 0168-8227 Google Scholar
J. Kropff et al.,
“Accuracy of two continuous glucose monitoring systems: a head-to-head comparison under clinical research centre and daily life conditions,”
Diabetes Obesity Metab., 17
(4), 343
–349
(2015). http://dx.doi.org/10.1111/dom.12378 Google Scholar
M. A. Milanick, S. Ritter and K. Meissner,
“Engineering erythrocytes to be erythrosensors: first steps,”
Blood Cells, Mol. Dis., 47
(2), 100
–106
(2011). http://dx.doi.org/10.1016/j.bcmd.2011.05.001 Google Scholar
S. C. Ritter, M. A. Milanick and K. E. Meissner,
“Encapsulation of FITC to monitor extracellular pH: a step towards the development of red blood cells as circulating blood analyte biosensors,”
Biomed. Opt. Express, 2
(7), 2012
–2021
(2011). http://dx.doi.org/10.1364/BOE.2.002012 BOEICL 2156-7085 Google Scholar
L. Roland, M. Drillich and M. Iwersen,
“Hematology as a diagnostic tool in bovine medicine,”
J. Veterinary Diagn. Invest.,
(2014). http://dx.doi.org/10.1177/1040638714546490 Google Scholar
J. S. O-Neill and A. B. Reddy,
“Circadian clocks in human red blood cells,”
Nature, 469
(7331), 498
–504
(2011). http://dx.doi.org/10.1038/nature09702 Google Scholar
I. Safeukui et al.,
“Surface area loss and increased sphericity account for the splenic entrapment of subpopulations of Plasmodium falciparum ring-infected erythrocytes,”
PLoS One, 8
(3), e60150
(2013). http://dx.doi.org/10.1371/journal.pone.0060150 POLNCL 1932-6203 Google Scholar
I. Safeukui et al.,
“Quantitative assessment of sensing and sequestration of spherocytic erythrocytes by the human spleen,”
Blood, 120
(2), 424
–430
(2012). http://dx.doi.org/10.1182/blood-2012-01-404103 BLOOAW 0006-4971 Google Scholar
A. Antonelli and M. Magnani,
“Red blood cells as carriers of iron oxide-based contrast agents for diagnostic applications,”
J. Biomed. Nanotechnol., 10
(9), 1732
–1750
(2014). http://dx.doi.org/10.1166/jbn.2014.1916 Google Scholar
S. Serafini et al.,
“Drug delivery through phagocytosis of red blood cells,”
Transfusion Med. Hemother., 31
(2), 92
–101
(2004). http://dx.doi.org/10.1159/000078042 Google Scholar
J. Rahmer et al.,
“Nanoparticle encapsulation in red blood cells enables blood-pool magnetic particle imaging hours after injection,”
Phys. Med. Biol., 58
(12), 3965
(2013). http://dx.doi.org/10.1088/0031-9155/58/12/3965 PHMBA7 0031-9155 Google Scholar
J. Shi et al.,
“Engineered red blood cells as carriers for systemic delivery of a wide array of functional probes,”
Proc. Natl. Acad. Sci. U.S.A., 111
(28), 10131
–10136
(2014). http://dx.doi.org/10.1073/pnas.1409861111 Google Scholar
F. Pierige et al.,
“Cell-based drug delivery,”
Adv. Drug Delivery Rev., 60
(2), 286
–295
(2008). http://dx.doi.org/10.1016/j.addr.2007.08.029 ADDREP 0169-409X Google Scholar
M. Magnani, F. Pierig and L. Rossi,
“Erythrocytes as a novel delivery vehicle for biologics: from enzymes to nucleic acid-based therapeutics,”
Ther. Delivery, 3
(3), 405
–414
(2012). http://dx.doi.org/10.4155/tde.12.6 Google Scholar
M. Hamidi et al.,
“Preparation and in vitro evaluation of carrier erythrocytes for RES-targeted delivery of interferon-alpha 2b,”
Int. J. Pharm., 341
(1–2), 125
–133
(2007). http://dx.doi.org/10.1016/j.ijpharm.2007.04.001 IJPHDE 0378-5173 Google Scholar
S. Svetina et al.,
“The cooperative role of membrane skeleton and bilayer in the mechanical behaviour of red blood cells,”
Bioelectrochemistry, 62
(2), 107
–113
(2004). http://dx.doi.org/10.1016/j.bioelechem.2003.08.002 BEBEBP 0302-4598 Google Scholar
A. Pribush, D. Meyerstein and N. Meyerstein,
“Kinetics of erythrocyte swelling and membrane hole formation in hypotonic media,”
Biochim. Biophys. Acta, 1558
(2), 119
–132
(2002). http://dx.doi.org/10.1016/S0005-2736(01)00418-7 BBACAQ 0006-3002 Google Scholar
J. R. Deloach,
“Carrier erythrocytes,”
Med. Res. Rev., 6
(4), 487
–504
(1986). http://dx.doi.org/10.1002/med.2610060406 MRREDD 1098-1128 Google Scholar
J. C. Weaver and Y. A. Chizmadzhev,
“Theory of electroporation: a review,”
Bioelectrochem. Bioenerget., 41
(2), 135
–160
(1996). http://dx.doi.org/10.1016/S0302-4598(96)05062-3 BEBEBP 0302-4598 Google Scholar
Jr. K. Kinosita,
“Survival of sucrose loaded erythrocytes in the circulation,”
Nature, 272
(5650), 258
–260
(1978). http://dx.doi.org/10.1038/272258a0 Google Scholar
J. G. Bliss et al.,
“Electroporation: the population distribution of macromolecular uptake and shape changes in red blood cells following a single 50 μs square wave pulse,”
Bioelectrochem. Bioenerget., 20
(1), 57
–71
(1988). http://dx.doi.org/10.1016/S0302-4598(98)80005-6 BEBEBP 0302-4598 Google Scholar
T. Betz et al.,
“Conformational change of membrane proteins leads to shape changes of red blood cells,”
Bioelectrochemistry, 70
(1), 122
–126
(2007). http://dx.doi.org/10.1016/j.bioelechem.2006.03.019 BEBEBP 0302-4598 Google Scholar
U. Zimmermann,
“Cellular drug-carrier systems and their possible targeting,”
Targeted Drugs, 153
–200
(1983). Google Scholar
Y. Mouneimne et al.,
“Electro-insertion of xeno-glycophorin into the red blood cell membrane,”
Biochem. Biophys. Res. Commun., 159
(1), 34
–40
(1989). http://dx.doi.org/10.1016/0006-291X(89)92400-5 BBRCA9 0006-291X Google Scholar
K. Schwister and B. Deuticke,
“Formation and properties of aqueous leaks induced in human erythrocytes by electrical breakdown,”
Biochim. Biophys. Acta, 816
(2), 332
–348
(1985). http://dx.doi.org/10.1016/0005-2736(85)90501-2 BBACAQ 0006-3002 Google Scholar
I. T. Kostić et al.,
“Erythrocyte membranes from slaughterhouse blood as potential drug vehicles: Isolation by gradual hypotonic hemolysis and biochemical and morphological characterization,”
Colloids Surf. B, 122 250
–259
(2014). http://dx.doi.org/10.1016/j.colsurfb.2014.06.043 CSBBEQ 0927-7765 Google Scholar
C. G. Millán et al.,
“Drug, enzyme and peptide delivery using erythrocytes as carriers,”
J. Controlled Release, 95
(1), 27
–49
(2004). http://dx.doi.org/10.1016/j.jconrel.2003.11.018 JCREEC 0168-3659 Google Scholar
R. Flower et al.,
“Observation of erythrocyte dynamics in the retinal capillaries and choriocapillaris using ICG-loaded erythrocyte ghost cells,”
Invest. Ophthalmol. Vis. Sci., 49
(12), 5510
–5516
(2008). http://dx.doi.org/10.1167/iovs.07-1504 IOVSDA 0146-0404 Google Scholar
E. K. Kozlova et al.,
“Analysis of nanostructure of red blood cells membranes by space Fourier transform of AFM images,”
Micron, 44 218
–227
(2013). http://dx.doi.org/10.1016/j.micron.2012.06.012 MICNB2 0047-7206 Google Scholar
A. S. M. Kamruzzahan et al.,
“Imaging morphological details and pathological differences of red blood cells using tapping-mode AFM,”
Biol. Chem., 385
(10), 955
–960
(2004). http://dx.doi.org/10.1515/BC.2004.124 Google Scholar
K. E. Bremmell, A. Evans and C. A. Prestidge,
“Deformation and nano-rheology of red blood cells: An AFM investigation,”
Colloids Surf. B, 50
(1), 43
–48
(2006). http://dx.doi.org/10.1016/j.colsurfb.2006.03.002 CSBBEQ 0927-7765 Google Scholar
M. Brähler et al.,
“Magnetite-loaded carrier erythrocytes as contrast agents for magnetic resonance imaging,”
Nano Lett., 6
(11), 2505
–2509
(2006). http://dx.doi.org/10.1021/nl0618501 NALEFD 1530-6984 Google Scholar
S. J. Updike, R. T. Wakamiya and E. N. Lightfoot Jr,
“Asparaginase entrapped in red blood cells: action and survival,”
Science, 193
(4254), 681
–683
(1976). http://dx.doi.org/10.1126/science.821145 SCIEAS 0036-8075 Google Scholar
R. Kravtzoff et al.,
“Erythrocytes as carriers for L-asparaginase. Methodological and mouse in-vivo studies,”
J. Pharm. Pharmacol., 42
(7), 473
–476
(1990). http://dx.doi.org/10.1111/j.2042-7158.1990.tb06598.x JPPMAB 0022-3573 Google Scholar
R. Kravtzoff et al.,
“Tolerance evaluation of L-asparaginase loaded in red blood cells,”
Eur. J. Clin. Pharmacol., 51
(3), 221
–225
(1996). http://dx.doi.org/10.1007/s002280050187 EJCPAS 0031-6970 Google Scholar
B. Barman, E. Ashwood and J. Giddings,
“Separation and size distribution of red blood cells of diverse size, shape, and origin by flow/hyperlayer field-flow fractionation,”
Anal. Biochem., 212
(1), 35
–42
(1993). http://dx.doi.org/10.1006/abio.1993.1287 ANBCA2 0003-2697 Google Scholar
R. Milo et al.,
“BioNumbers—the database of key numbers in molecular and cell biology,”
Nucleic Acids Res., 38 D750
–D753
(2010). Google Scholar
BiographySandra C. Bustamante López holds her bachelor’s degree in biomedical laboratory and clinical sciences from Boston University. She has worked in immunology and drug delivery projects at different universities, including Boston University and MIT. She will complete her PhD at Texas A&M University in biomedical engineering in 2017. Her research explores cells-based sensing, microfluidic devices for cell loading, and nanotechnology. She will continue her postdoctoral research at Swansea University in the UK. |


