

|
|
|
Dynamic fluorescence molecular tomography (DFMT) is a rapidly developing technique that can provide three-dimensional (3-D) metabolic information for biological studies and drug development.1–3 Images of the pharmacokinetic parameters (also known as parametric images) can reflect the absorption and excretion processes of the fluorescence agents in biological tissues. Conventionally, the parametric images are obtained by curve fitting a sequence of FMT images into a compartmental model.1,3 Due to the illposedness and ill-condition of the FMT problems, the reconstruction quality of the parametric images is limited. Although many methods have been proposed to improve the quality of the reconstruction results,2,4 challenges in distinguishing different metabolic processes of the fluorescent targets, especially when the distances between the targets are very small, still remain. Owing to the advantage of obtaining more information in multiple spectrums, the multispectral imaging technology has been applied to bioluminescence tomography5 and FMT.6 It has been proved that the excitation-resolved multispectral imaging leads to higher accuracy of the reconstructed image than the emission-resolved multispectral detection.6 Therefore, the excitation-resolved multispectral imaging is applied in this study. In this letter, an excitation-resolved multispectral DFMT (MDFMT) method, based on the fact that the fluorescent targets with different concentrations show different variations in the excitation spectral domain, is proposed. In our previous studies, the spatial locations and structures of fluorescent targets with different concentrations in multispectrum FMT images are effectively unmixed by using multivariate image analysis methods, such as principal component analysis7 and independent component analysis (ICA).8 In this study, we further recover the fluorescent yield of each independent component and investigate the individual metabolic process of each fluorescent target. The results of simulations and phantom experiments show that the proposed method can effectively improve the reconstruction accuracy of the parametric images. To investigate the metabolic processes of the fluorescent targets, an excitation-resolved MDFMT system9 is used to obtain the fluorescence datasets. During the MDFMT experiments, the fluorescent measurements are acquired at different time points, and the concentrations of the fluorescent targets vary with time. At each time point, the imaged object is sequentially illuminated using an excitation light with different wavelengths. At each wavelength, the imaged object is rotated for 360 deg in about 1 min with an angular increment of 15 deg, and 24 projections of the fluorescent measurements are acquired with a charge-coupled device camera. Therefore, a total of groups of the fluorescent measurements are collected for the entire MDFMT experiments. In the FMT forward problem, the photon transportation in biological tissues can be described by the diffusion approximation. After discretizing the imaged object into voxels, the forward model can be described with a linear system:9 where is the wavelength-dependent weight matrix, which is generated according to the optical parameters at different wavelengths. is the vector of the fluorescent measurements for the ’th excitation wavelength at the ’th time point, and is the vector of the corresponding fluorescent yield (also known as FMT image). The fluorescent yields at different time points and excitation wavelengths can be obtained with traditional FMT reconstruction methods, and the Tikhonov regularization is selected in this study.10Taking into account multiple excitation spectrums, the fluorescent yields can be defined as follows:7,8 where stands for the quantum yield, which is often assumed to be constant for a given fluorescent agent and environment, and is set to be 0.12 in this study.8 and are the concentration and the extinction coefficient of the fluorescent target, respectively. In this study, indocyanine green (ICG) is used as the fluorescent agent. According to previous studies,11 the extinction coefficients of ICG are affected by both concentrations and wavelengths because it tends to aggregate in water at high concentrations. Therefore, in excitation-resolved MDFMT, varies with , which means that for different , shows different variation trends along with . The fluorescent targets with different concentrations can be considered independent signal sources, which can be decomposed by multivariate image analysis methods.7,8After FMT reconstruction, a total of groups of reconstruction results are obtained (corresponding to different time points), and each group contains FMT images (corresponding to excitation wavelengths). To resolve the different components inside the imaged object, the FMT images of each group are decomposed by ICA, which has the general form:12 where , , and are the number of excitation spectra, the number of discrete voxels, and the number of ICA decomposed components, respectively. is the observation matrix in which is the -dimensional FMT image obtained at the ’th excitation wavelength. is the independent component () matrix, and is an -dimensional vector that contains the spatial structural information of the ’th component. is the spectrum course () matrix. The ’th column is an -dimensional vector that reflects the absorption ability of to the excitation light. Generally, the dimensions of and are assumed to be equal (i.e., ). Therefore, in this study, Eq. (3) at a given time point can be expanded as follows:8Assuming that the target appears in the ’th IC, the true fluorescent yield of this target can be recovered by setting the other ICs to be zero and multiplying by SCs as follows: where represents the recovered fluorescent yield for the ’th excitation wavelength and at the ’th time point; denotes the -dimensional zero vector.Finally, the pharmacokinetic parameters of each fluorescent target are obtained by fitting the fluorescent yields into a two compartmental model. Let denote the pharmacokinetic parameter vector of the ’th voxel at the ’th spectrum and represent the ’th time point; then, the corresponding parameters can be calculated as follows:1,3 where and are the zero-time intercepts, which denote the initial concentration of the fluorescent agents. and are the metabolic rates, which reflect the absorption and excretion processes of the fluorescent agents in organs and biological tissues.The actual fluorescent targets can be determined based on two criteria. First, the objects should repeatedly appear in the ICs at different time points. Second, the metabolic properties of the objects should have physiological significance, which reflects the absorption and excretion processes of the fluorescent agents in biological tissues. The objects that do not satisfy these criteria should be considered noise components. Numerical simulations and phantom experiments are carried out to estimate the performance of the proposed MDFMT method. To investigate the influences of the excitation wavelengths, several wavelength combinations with different numbers of spectra are tested in both the simulations and phantom experiments. The results demonstrate that the different metabolic properties can be effectively separated as long as the number of spectra is larger than the number of fluorescent targets. Moreover, when increases, the accuracy of the parametric images improves while the temporal resolution decreases. Therefore, should be properly selected to balance the accuracy and temporal resolution of the parametric images. In this study, four wavelengths, 700, 720, 740, and 760 nm, are selected in the excitation, and the fluorescent wavelength is set to be 840 nm in both the simulations and phantom experiments. A 3-D digital mouse atlas is employed in the numerical simulations. As depicted in Fig. 1(b), the mouse torso with a total height of 3 cm containing the heart (red) and lungs (green) is selected as the target region. The region outside the organs is regarded as adipose. As listed in Table 1,13 different absorption coefficients and reduced scattering coefficients are assigned to corresponding regions to construct a heterogeneous model. To mimic the metabolic processes of ICG in the two organs, 50 groups () of different fluorescent concentrations varying with time are set according to the metabolic curves shown in Fig. 1(a). The curves are obtained with Eq. (6), and the pharmacokinetic parameters are listed in Table 2.14,15 The fluorescent yields are calculated based on Eq. (2) in which the extinction coefficients at different wavelengths and concentrations are set according to the parameters reported by Landsman et al.11 The corresponding boundary measurements are calculated according to Eq. (1). A zero-mean white Gaussian noise with a signal-to-noise ratio of 40 dB is added to to generate noisy measurements. Fig. 1Set-up and 3-D reconstruction results of the simulations. (a) The normalized metabolic curves of the simulations. Fifty groups of fluorescent concentrations for the heart and lungs are shwon as red solid and green dashed lines, respectively. (b) The 3-D geometry configurations of the mouse torso containing two organs. The heart and lungs are depicted in red and green, respectively. (c) The 3-D FMT reconstruction results obtained at the time point of and the excitation wavelength of 700 nm. (e)–(h) The 3-D decomposition results obtained with ICA. IC1 and IC2 are noises, while IC3 and IC4 correspond to the lung and heart regions, respectively. (d) The 3-D merged results of IC3 and IC4. The heart and lungs are depicted in red and green, respectively. 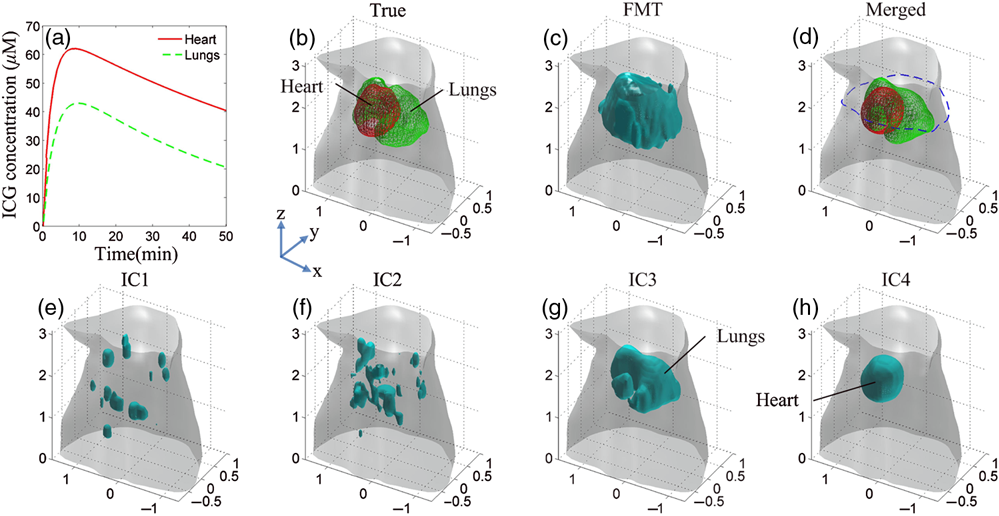 Table 1Optical parameters at different wavelengths in the simulations and phantom experiments.
Table 2Setups of the pharmacokinetic parameters for different regions in the simulations and phantom experiments.
The 3-D FMT reconstruction results at the time point of and the excitation wavelength of 700 nm are shown in Fig. 1(c). It is very difficult to distinguish the locations and the structures of the two organs. Four ICs are obtained with the decomposition of ICA, and the results are depicted in Figs. 1(e)–1(h). IC1 and IC2 are noise components, while IC3 [Fig. 1(g)] and IC4 [Fig. 1(h)] correspond to the lungs and heart, respectively. The two organs are effectively extracted from the FMT images, and the metabolic processes of these two organs can be separately analyzed. By combining IC3 and IC4, the merged 3-D result is shown in Fig. 1(d), which is very similar to the true setups, as depicted in Fig. 1(b). Figure 2 shows the cross-sectional parametric images obtained with the proposed MDFMT and the traditional DFMT methods. The images correspond to the slice indicated by the blue dashed line in Fig. 1(d). The MDFMT results are obtained at the excitation wavelength of 760 nm, and similar results can be obtained at other excitation wavelengths. As depicted in Figs. 2(d1)–2(d4), the two organs can be clearly distinguished in the parametric images obtained with the MDFMT method. By comparison, as shown in Figs. 2(e1)–2(e4), it is difficult to recognize the different metabolic processes in the DFMT results. Fig. 2Cross-sectional parametric images of the simulations corresponding to the slice indicated by the blue dashed line in Fig. 1(d). (a1)–(a4) The true parametric images. (b1)–(b4) The images of the heart component. (c1)–(c4) The images of the lungs component. (d1)–(d4) The merged images obtained whith the MDFMT method. (e1)–(e4) The images obtained with the traditional DFMT method. 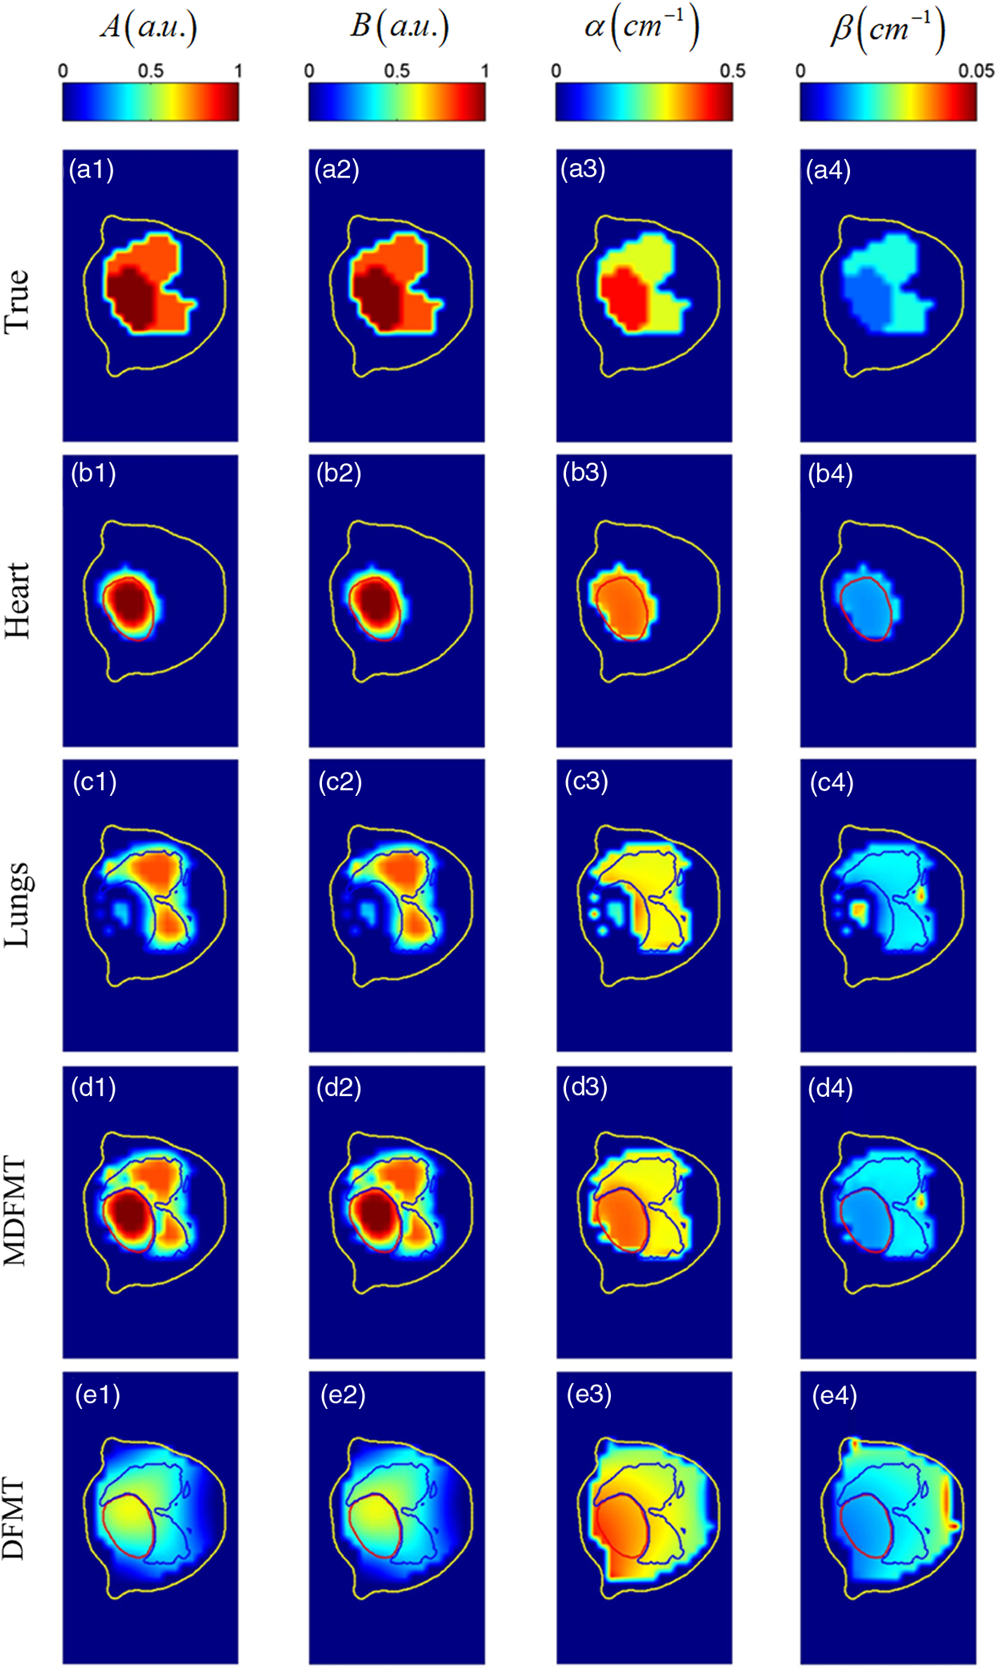 The normalized root mean square error (, where and stand for the true and reconstructed parametric images, respectively) is used to quantify the relative errors between the true and the reconstructed images. A smaller NRMSE indicates higher accuracy of the reconstructed image.4 As listed in Table 3, the NRMSEs of the four parametric images obtained with the MDFMT method are smaller than those with the DFMT methods, which quantitatively confirms that the proposed MDFMT method obtains higher reconstruction accuracy than the traditional DFMT method. Table 3NRMSEs of the parametric images obtained with the two methods in the simulations and phantom experiments.
The phantom experiments are carried out on a cylinder with a height of 4 cm and a radius of 1.5 cm, as depicted in Fig. 3(b). The imaged phantom is filled with 1% intralipid, and the optical parameters at different wavelengths are listed in Table 1.8,16 Two tubes with an edge-to-edge distance (EED) of 0.1 cm are placed inside the cylinder to be the fluorescent targets. The height and radius of the tubes are 0.5 and 0.2 cm, respectively. Ten groups of ICG with different concentrations are filled in the tubes to mimic the metabolic processes of two organs. The concentrations are set according to the metabolic curves at 10 different time points (), as indicated by the red stars and green circles in Fig 3(a). The pharmacokinetic parameters of the two curves are listed in Table 2. Fig. 3Set-up and 3-D reconstruction results of the phantom experiments. (a) The normalized metabolic curves of the phantom experiments. Ten groups of fluorescent concentrations at different time points for tubes 1 and 2 are shwon as red stars and green circles, respectively. (b) The 3-D geometry configurations of the phantom experiments. (c) The 3-D FMT reconstruction results obtained at the time point of and the excitation wavelength of 700 nm. (e)–(h) The 3-D decomposition results obtained with ICA. IC2 and IC4 are noise components, while IC1 and IC3 correspond to tubes 2 and 1, respectively. (d) The 3-D merged results of IC1 and IC3.  The 3-D reconstruction results are shown in Fig. 3. The four ICs decomposed with ICA are depicted in Figs. 3(e)–3(h) in which IC3 [Fig. 3(g)] and IC1 [Fig. 3(e)] correspond to tubes 1 and 2, respectively, and the other two components are noises. Figure 3(d) shows the merged results of IC1 and IC3. The structures and spatial locations of the two tubes in the merged results are very similar to the true setups [Fig. 3(b)]. By contrast, as shown in Fig. 3(c), the two tubes cannot be distinguished in the FMT reconstruction results. Figure 4 shows the cross-sectional parametric images obtained with the MDFMT and DFMT methods, and the slice is indicated by the red solid line in Fig. 3(d). The MDFMT results are obtained at the excitation wavelength of 760 nm, and similar results can be obtained at other excitation wavelengths. Due to the small EED of the fluorescent targets (0.1 cm), the two tubes are mixed together and cannot be distinguished in the parametric images obtained with the traditional DFMT method, as depicted in Figs. 4(e1)–4(e4). By comparison, as shown in Figs. 4(d1)–4(d4), the different metabolic processes of the two tubes can be clearly observed in the reconstruction results obtained with the MDFMT method. It can be seen from the results that the MDFMT method obtains higher image quality than the DFMT method. The findings are quantitatively proved by the NRMSEs listed in Table 3 in which the MDFMT method obtains smaller NRMSEs for all the parametric images than the DFMT method. Fig. 4Cross-sectional parametric images of the phantom experiments corresponding to the slice indicated by the red solid line in Fig. 3(d). (a1)–(a4) The true parametric images. (b1)–(b4) The images of the component corresponding to tube 1. (c1)–(c4) The images of the component coressponding to tube 2. (d1)–(d4) The merged images obtained whith the MDFMT method. (e1)–(e4) The images obtained with the traditional DFMT method.  In conclusion, an excitation-resolved MDFMT method is proposed to improve the accuracy of the parametric images. Different fluorescent targets in the imaged object are decomposed using ICA, and the metabolic processes of the targets are separately analyzed. As depicted in Figs. 2 and 4, the metabolic characteristics of different fluorescent targets can be clearly observed in the parametric images obtained with the MDFMT method but cannot be distinguished in the DFMT results. Moreover, as listed in Table 3, the proposed MDFMT method obtains smaller NRMSEs in both the simulations and phantom experiments, which quantitatively confirms that the MDFMT method can achieve higher accuracy of the parametric image than the traditional DFMT method. It is worth mentioning that the fluorescent yields, not the fluorescent concentrations, are fitted to the two compartmental models to obtain the pharmacokinetic parameters because the extinction coefficient in Eq. (2) is unknown. This may affect the accuracy of the parametric images and will be further studied in our future work. AcknowledgmentsThis work is supported by the National Natural Science Foundation of China under Grant Nos. 81227901, 81271617, 61322101, and 61361160418 and the National Major Scientific Instrument and Equipment Development Project under Grant No. 2011YQ030114. ReferencesA. B. Milstein, K. J. Webb and C. A. Bouman,
“Estimation of kinetic model parameters in fluorescence optical diffusion tomography,”
J. Opt. Soc. Am. A, 22
(7), 1357
–1368
(2005). http://dx.doi.org/10.1364/JOSAA.22.001357 Google Scholar
B. Alacam and B. Yazici,
“Direct reconstruction of pharmacokinetic-rate images of optical fluorophores from NIR measurements,”
IEEE Trans. Med. Imaging, 28
(9), 1337
–1353
(2009). http://dx.doi.org/10.1109/TMI.2009.2015294 Google Scholar
G. L. Zhang et al.,
“Imaging of pharmacokinetic rates of indocyanine green in mouse liver with a hybrid fluorescence molecular tomography/x-ray computed tomography system,”
J. Biomed. Opt., 18
(4), 040505
(2013). http://dx.doi.org/10.1117/1.JBO.18.4.040505 Google Scholar
G. L. Zhang et al.,
“Full-direct method for imaging pharmacokinetic parameters in dynamic fluorescence molecular tomography,”
Appl. Phys. Lett., 106
(8), 081110
(2015). http://dx.doi.org/10.1063/1.4913690 Google Scholar
A. J. Chaudhari et al.,
“Hyperspectral and multispectral bioluminescence optical tomography for small animal imaging,”
Phys. Med. Biol., 50
(23), 5421
–5441
(2005). http://dx.doi.org/10.1088/0031-9155/50/23/001 Google Scholar
A. J. Chaudhari et al.,
“Excitation spectroscopy in multispectral optical fluorescence tomography: methodology, feasibility and computer simulation studies,”
Phys. Med. Biol., 54
(15), 4687
–4704
(2009). http://dx.doi.org/10.1088/0031-9155/54/15/004 Google Scholar
H. S. Pu et al.,
“Separating structures of different fluorophore concentrations by principal component analysis on multispectral excitation-resolved fluorescence tomography images,”
Biomed. Opt. Express, 4
(10), 1829
–1845
(2013). http://dx.doi.org/10.1364/BOE.4.001829 Google Scholar
H. S. Pu et al.,
“Resolving fluorophores by unmixing multispectral fluorescence tomography with independent component analysis,”
Phys. Med. Biol., 59
(17), 5025
–5042
(2014). http://dx.doi.org/10.1088/0031-9155/59/17/5025 Google Scholar
X. L. Guo et al.,
“A combined fluorescence and microcomputed tomography system for small animal imaging,”
IEEE Trans. Biomed. Eng., 57
(12), 2876
–2883
(2010). http://dx.doi.org/10.1109/TBME.2010.2073468 Google Scholar
J. Axelsson, J. Svensson and S. Andersson-Engels,
“Spatially varying regularization based on spectrally resolved fluorescence emission in fluorescence molecular tomography,”
Opt. Express, 15
(21), 13574
–13584
(2007). http://dx.doi.org/10.1364/OE.15.013574 Google Scholar
M. L. J. Landsman et al.,
“Light-absorbing properties, stability, and spectral stabilization of indocyanine green,”
J. Appl. Physiol., 40
(4), 575
–583
(1976). Google Scholar
A. Hyvarinen and E. Oja,
“Independent component analysis: algorithms and applications,”
Neural Networks, 13
(4–5), 411
–430
(2000). http://dx.doi.org/10.1016/S0893-6080(00)00026-5 NNETEB 0893-6080 Google Scholar
G. Alexandrakis, F. R. Rannou and A. F. Chatziioannou,
“Tomographic bioluminescence imaging by use of a combined optical-PET (OPET) system: a computer simulation feasibility study,”
Phys. Med. Biol., 50
(17), 4225
–4241
(2005). http://dx.doi.org/10.1088/0031-9155/50/17/021 Google Scholar
H. Shinohara et al.,
“Direct measurement of hepatic indocyanine green clearance with near-infrared spectroscopy: separate evaluation of uptake and removal,”
Hepatology, 23
(1), 137
–144
(1996). http://dx.doi.org/10.1002/hep.510230119 HEPADF 0161-0538 Google Scholar
E. M. C. Hillman and A. Moore,
“All-optical anatomical co-registration for molecular imaging of small animals using dynamic contrast,”
Nat. Photonics, 1
(9), 526
–530
(2007). http://dx.doi.org/10.1038/nphoton.2007.146 Google Scholar
R. Michels, F. Foschum and A. Kienle,
“Optical properties of fat emulsions,”
Opt. Express, 16
(8), 5907
–5925
(2008). http://dx.doi.org/10.1364/OE.16.005907 Google Scholar
BiographyMaomao Chen received his bachelor’s and master’s degrees in biomedical engineering from Chongqing University, Chongqing, China, in 2006 and 2009, respectively. He is currently a PhD candidate in the Department of Biomedical Engineering, Tsinghua University, Beijing, China. His research interest is fluorescence molecular tomography for small animal imaging. Yuan Zhou received his bachelor’s degree in biomedical engineering from Beijing Jiaotong University, Beijing, China, in 2014. He is currently a PhD candidate in the Department of Biomedical Engineering, Tsinghua University, Beijing, China. His research interest is fluorescence molecular tomography for small animal imaging. Han Su received his bachelor’s degree from Northeastern University, Shenyang, Liaoning Province, China, in 2014. He is currently a PhD candidate in the Department of Biomedical Engineering, Tsinghua University, Beijing, China. His research interest is fluorescence molecular tomography for small animal imaging. Dong Zhang received his bachelor’s degree from the University of Science and Technology, Beijing, China in 2012 and his master’s degree from the University of Dundee, Scotland, UK in 2013. He is currently a PhD candidate in the Department of Biomedical Eng, Tsinghua University, Beijing, China. His research interest is fluorescence molecular tomography for small animal imaging. Jianwen Luo is a professor at Tsinghua University. He was enrolled in the thousand young talents program in 2012 and he received the Excellent Young Scientists Fund from the National Natural Science Foundation of China (NSFC) in 2013, and was supported by the Young Scientists Project of National Key R&D Program of China in 2016. His research interests include ultrasound elasticity imaging and fluorescence molecular imaging. He has published more than 110 journal papers and 50 conference papers. |
||||||||||||||||||||||||||||||||||||||||||||||||||||||||||||||||||||||||||||||||||||||||||||||||||||||||||||||||||||


