|
|
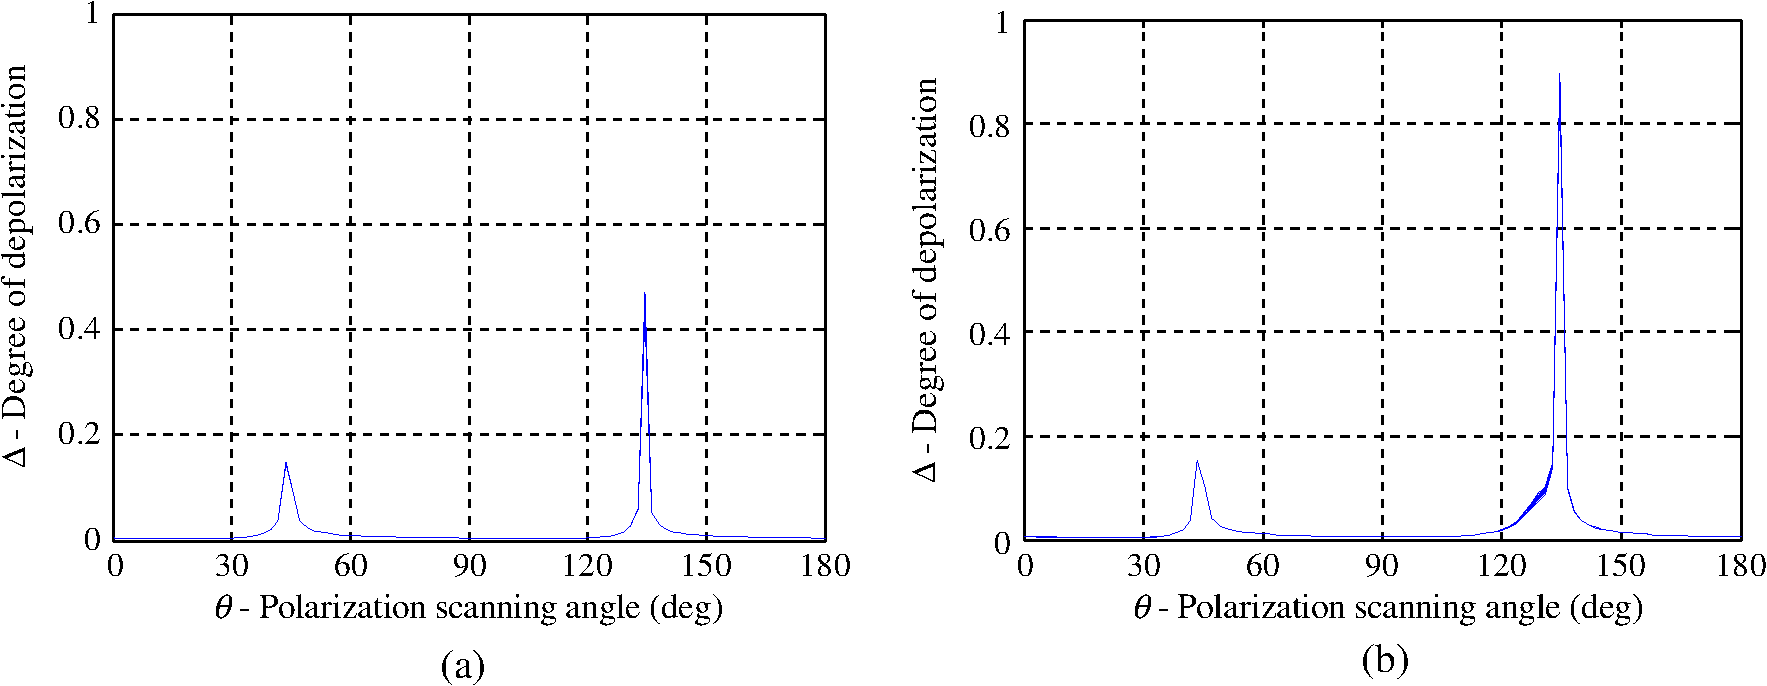
1.IntroductionPolarization is a fundamental property of light and has many practical applications in industry and engineering science. Many studies have shown that the polarization state of a light beam (including depolarization effects) can be fully described by four Stokes parameters (, , , and ).1–3 Meanwhile, the change in optical properties of a sample given different polarization states of the incident light can be completely described by the Mueller matrix formalism.4 Consequently, Stokes–Mueller matrix polarimetry provides a powerful technique for characterizing a wide range of materials, biomaterials, and turbid media.5,6 Lu and Chipman7 proposed a pioneering method for dealing with the strong multiple scattering effects of turbid media by decomposing the Mueller matrix into a sequence of three matrix factors corresponding to the diattenuation, retardation, and depolarization properties, respectively. Kumar et al.8 and Ghosh and Vitkin9 utilized polar decomposition and Mueller matrix decomposition methods to extract/quantify the linear retardance, optical rotation, and depolarization parameters of complex tissue-like turbid media with simultaneous scattering and depolarization effects. Pham and Lo10,11 proposed a Stokes–Mueller decomposition matrix-based method for extracting all the effective parameters of turbid media, including the linear birefringence, linear dichroism, circular birefringence (CB), circular dichroism (CD), linear depolarization, and circular depolarization properties. However, the methods in Refs. 89.10.–11 require a strict decoupling of the optical properties of the sample. As a result, they are unsuitable for samples containing multiple properties. Several studies have shown that this problem can be resolved by a differential Mueller matrix formalism. Quijano et al.12 proposed a differential Mueller matrix decomposition method for extracting the polarimetric properties of general depolarizing anisotropic media. Liao and Lo13 developed a hybrid model comprising the Mueller matrix decomposition method and the differential Mueller matrix formalism for obtaining full-range measurements of the anisotropic optical properties of turbid media. However, the methods in Refs. 12 and 13 require light to be transmitted through the sample and are thus unsuitable for noninvasive practical medical diagnoses. Surface plasmon resonance (SPR) is a charge density oscillation at the interface of two media with dielectric constants of opposite signs and has significant potential for sensing applications.14–16 Generally speaking, existing SPR sensors are based on either prism couplers or diffraction gratings. Of the two types of sensor, those based on prism couplers tend to have a better sensitivity and resolution.17 One of the most common uses of prism coupler-based SPR sensors is that of total internal reflection ellipsometry (TIRE).18 Le et al.19 used TIRE to visualize the behavior of giant lipid vesicles interacting with an adhesive surface coated with poly-l-lysine. Olender et al.20 used TIRE to perform the real-time monitoring of the absorption of lipopolysaccharide molecules and whole gram-negative bacteria cells. Balevicius et al.21,22 utilized TIRE to study the interaction of biomolecule layers and the optical anisotropy of biorecognition molecule layers. In a previous study,23 the present group proposed an SPR-based technique for enhanced CD/degree of polarization (DOP) sensing. In the present study, the proposed method is extended to the detection of the CB/CD/DOP properties of complex turbid media. The validity of the proposed method is demonstrated both numerically and by means of experimental investigations using glucose–chlorophyllin compound samples containing polystyrene microspheres. 2.Total Internal Reflection Ellipsometry Surface Plasmon Resonance Prism CouplerFigure 1(a) presents a schematic illustration of the SPR prism coupler used in the present study. As described in Ref. 23, the coupler comprises a half-ball glass lens, a Cr–Au isotropic thin-film layer, and a anisotropic layer. The half-ball lens couples the incident polarized light into the isotropic and anisotropic films and provides total internal reflection. Meanwhile, the isotropic and anisotropic layers enhance the sensing performance by manipulating the incident polarized light and inducing SPR at the sensed interface. The half-ball lens in the SPR prism coupler was fabricated of BK7 glass with a refractive index of . The refractive indices of the isotropic and anisotropic layers were the same as those in Ref. 23, i.e., –, ; and , . However, the thicknesses of the two layers were increased to and , respectively, to improve the measurement sensitivity of the CB/CD/DOP properties. The resonance angle of the prism coupler was found to be around 76 deg at a wavelength of 632.8 nm and resulted in a reflectance coefficient of , as shown in Fig. 1(b). 3.Analytical Model for Extracting Circular Birefringence/Circular Dichroism/Degree of Polarization PropertiesAn optical sample can be described by the matrix formulation , where is the Stokes vector of the output light, is the Mueller matrix of the sample, and is the Stokes vector of the input light. The general form of this relation is given as follows: Compared to the model presented in Ref. 23 for CD/DOP measurement, the Mueller matrix in the present study contains an additional term () to describe the CB properties of the sample. In other words, the Mueller matrix is given by where , , and are the Mueller matrices of the CD property, the reflectance of the prism coupler, and the scattering-induced depolarization effect, respectively.23 For a CB sample with a circular optical rotation angle , has the form:10Thus, Eq. (1) can be expressed as follows: whereNote that is the CD property of the sample; , , and are the elements of the Mueller matrix; and , , , , , and are the elements of the Mueller matrix. As described in the following, the use of four input lights [namely, three linear polarization lights (0, 45, and 90 deg) and one right-hand circular polarization light] yields a sufficient number of equations to determine parameters , , and (DOP) of the optical sample. The Stokes vectors of the four input lights are given as follows: , , , and . Thus, and can be obtained directly as follows: In addition, the elements of the depolarization Mueller matrix are obtained as follows: whereThus, the can then be obtained as follows: It is noted that and in Eqs. (11) and (12) are functions of and represent the only difference from the expressions given in Ref. 23 for the depolarization Mueller matrix. 4.Validity of Analytical ModelThe validity of the analytical model derived above was investigated by comparing the values obtained for parameters , , and of a hypothetical sample with the known values inserted into the sample matrix in Eq. (2). In performing the simulations, the refractive index of the CB/CD/DOP sample was set as 1.33 and the incident angle was set equal to the SPR angle of 76 deg. As shown in Fig. 2, a good agreement was obtained between the two sets of values in every case. In other words, the ability of the proposed model to extract the values of , , and over the full range is confirmed. 5.Sensitivity of Circular Dichroism Measurements to Chlorophyllin ConcentrationChlorophyllin is a common photosynthetic pigment and can be obtained from spinach leaves or grass. The molecular structure of chlorophyllin results in a high optical absorbance and a strong CD effect.24,25 In the present study, simulations were performed to investigate the sensitivity of the extracted value to the change in concentration of chlorophyllin sodium copper salt samples (referred to hereafter simply as chlorophyllin samples) in aqueous solution. In performing the simulations, the change in concentration of the chlorophyllin sample was modeled by a change in the refractive index .26 Based on this assumption, the values of samples with refractive indices ranging from 1.3 to 1.4 (with a step size of 0.01) were computed using Eq. (9) for scanning angles in the range of 0 to 180 deg. The corresponding results are presented in Fig. 3. It is noted that scanning angle is the angle between the original coordinate system and the measured coordinate system of the polarization scanning ellipsometry technique developed by the current group in Ref. 27. As described in Ref. 27, in applying Eq. (9) to derive the parameter, the traditional algorithm must be modified from the laboratory () coordinate system to the measured coordinate system. Thus, the axes of the four polarization input light beams (i.e., 0 deg, 45 deg, 90 deg, and ) in the coordinate system must be rotated through an additional scanning angle of to convert them to the coordinate frame. Fig. 3(a) Variation of extracted value with polarization scanning angle for chlorophyllin samples with refractive indices ranging from 1.3 to 1.4 (step size of 0.01). Note that the arrows show the direction of increasing refractive index. (b) Variation of extracted value with refractive index given scanning angle of . Estimated resolution of CD measurement is equal to .  As shown in Fig. 3(a), the extracted values are particularly sensitive to changes in the refractive index (i.e., the chlorophyllin concentration) at scanning angles of 45 and 135 deg. Furthermore, Fig. 3(b) shows that the value increases approximately linearly over the refractive index range of 1.3 to 1.4 given a fixed scanning angle of 135 deg. Assuming the output Stokes vectors are obtained using a commercial Stokes polarimeter (PAX5710, Thorlabs Co.) with a deviation of , the estimated resolution of the extracted values is of the order of . Note that the results presented in Fig. 3(a) show that the sensitivity of the extraction results is the same given a scanning angle of 45 deg as that for a scanning angle of 135 deg. Thus, only the data obtained for a scanning angle of 135 deg are considered in deriving Fig. 3(b). 6.Sensitivity of Circular Birefringence Measurements to Glucose ConcentrationSimulations were performed to investigate the sensitivity of the extracted value to the change in concentration of glucose aqueous solutions. In performing the simulations, it was assumed that the refractive index increased linearly from 1.3 to 1.4 as the glucose concentration increased from 0 to .28,29 Based on this assumption, the values of samples with refractive indices ranging from 1.3 to 1.4 (with a step size of 0.01) were computed using Eq. (10) for scanning angle in the range of 0 to 180 deg. It is noted that scanning angle is the angle between the original coordinate system and the measured coordinate system.27 As shown in Fig. 4(a), the extracted optical rotation angle is particularly sensitive to changes in the refractive index (i.e., the glucose concentration) at polarization scanning angles of 40, 60, 120, and 135 deg. Furthermore, Fig. 4(b) shows that decreases with the increase of refractive index over a range of 1.3 to 1.4 given a fixed scanning angle of 135 deg. Assuming that the output Stokes vectors are again obtained using a commercial Stokes polarimeter (PAX5710, Thorlabs Co.) with a deviation of , the estimated resolution of the extracted CB values is of the order of . Note that the results presented in Fig. 4(a) show that a scanning angle of 135 deg results in the highest measurement sensitivity. Thus, only the data obtained for a scanning angle of 135 deg are considered in deriving the results presented in Fig. 4(b). Fig. 4(a) Variation of extracted value with polarization scanning angle for glucose samples with refractive indices ranging from 1.3 to 1.4 (step size of 0.01). Note that the arrows show the direction of increasing refractive index. (b) Variation of extracted value with refractive index given scanning angle of . Estimated resolution of measurement is equal to . 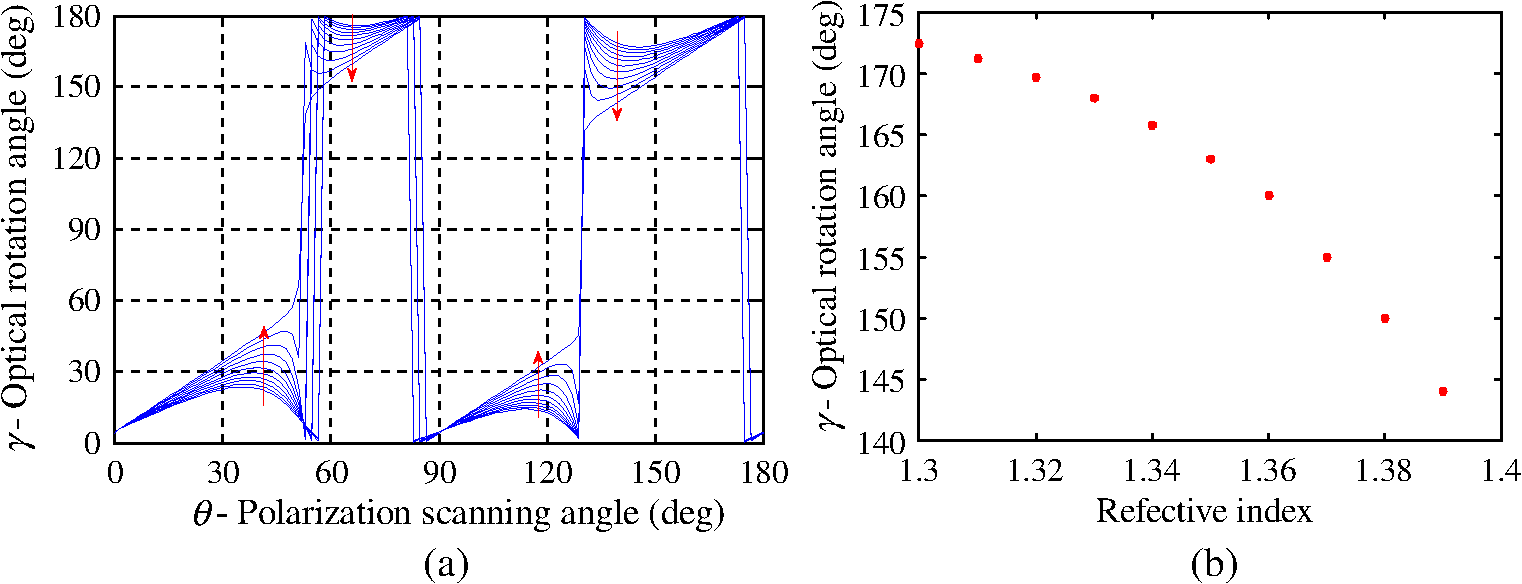 Figure 5 shows the simulation results for the sensitivity of the DOP () to changes in the refractive index (1.3 to 1.4) for glucose samples with small [Fig. 5(a)] and high [Fig. 5(b)] degrees of depolarization of and 0.85, respectively. Note that in performing the simulation, the value of was calculated using Eq. (19). As shown, the extracted values of are insensitive to the refractive index over the full range of the polarization scanning angle for both samples. This finding is reasonable since, although is a function of both and , when the refractive index increases, increases but decreases (or decreases but increases, depending on the scanning angle). As a result, the value of remains approximately unchanged. The thickness of the isotropic/anisotropic layers of the prism coupler affects both the working range and the sensitivity of the sensor. Thus, the measurement sensitivity of can be enhanced through an appropriate design of the prism coupler structure. In the present study, however, the prism coupler is designed only to maximize the measurement sensitivity of and over the considered measurement range. 7.Experimental Setup and ResultsFigure 6 presents a schematic illustration of the PSR-based scanning polarization ellipsometry system proposed in the present study. As shown, the major items of equipment include a He–Ne laser (SL 02/2, SIOS Co., central wavelength 632.8 nm), a polarizer (GTH5M, Thorlabs Co.) to produce linear polarized light, a quarter-wave plate (QWP0-633-04-4-R10, CVI Co.) to convert the linear polarized light into circular polarized light, a second polarizer (GTH5M, Thorlabs Co.) set to a scanning angle in the range of to 180 deg, and a neutral density filter (NDC-100C-2, Oneset Co.) and power detector (8842A, OPHIR Co.) to calibrate the intensity of the input polarization light. Following the calibration process, the power detector was removed from the experimental setup, and the light emerging from the neutral density filter was reflected on the SPR sensor and detected by a commercial Stokes polarimeter (PAX5710, Thorlabs Co.). To achieve a precise alignment of the optical components in the experimental setup, a pin hole was placed in front of the polarizers and quarter-wave plate and the components were then adjusted such that the reflected laser beam passed though the pin hole in turn. To enhance the SPR effect at the sensed interface, the Stokes polarimeter was placed on a mechanical stage (SGSP-60YAW, Sigma Koki Co.) controlled by a step motor (Mark 204-MS, Sigma Koki Co.) and rotated through an angle of 28 deg such that the incident light was incident on the prism coupler at the resonance angle of 76 deg (see Fig. 6). In performing the experiments, the linear scanning polarization lights were produced by manually rotating the second polarizer from 0 to 180 deg in steps of 15 deg using a mechanical stage (SGSP-60YAW, Sigma Koki Co.). In addition, the right-hand circular polarization light () was produced by removing the second polarizer from the system. The samples were stored in plastic cuvettes with dimensions of . The prism coupler was attached to the cuvettes by means of industrial glue and a layer of silicon around the border edge. Prior to mounting the coupler, the cuvette was drilled with a small hole with a diameter of 6 mm such that the sample made direct contact with the half-ball lens (thereby avoiding optical interference by the cuvette material). The CD samples were prepared using 10-mL chlorophyllin solutions (C6003, Sigma-Aldrich Co. LLC) with concentrations ranging from 0 to in increments mixed with 2 mL d-glucose solution ( Merck Ltd.) and 0.5-mL polystyrene microspheres ( Duke Standard™). Figure 7(a) shows the experimental and simulated values of the chlorophyllin samples given a scanning angle of 135 deg in every case. As shown, increases linearly with an increasing chlorophyllin concentration over the considered concentration range. Figures 7(b) and 7(c) show the experimental and simulated values of and , respectively, for the various samples. It is seen that decreases linearly with an increasing chlorophyllin concentration, while remains approximately constant. The standard deviations of the measured values of , , and obtained on four repeated tests over the measured concentration range of chlorophyllin samples are shown in Table 1. Moreover, for all of the samples, a good qualitative agreement exists between the experimental and simulation results for all three properties. Hence, the basic validity of the proposed approach is confirmed. The slight discrepancy between the two sets of results is most likely due to alignment errors in the optical system or imperfections in the optical components themselves. Fig. 7Experimental and simulated results for: (a) , (b) , and (c) properties of CD samples with chlorophyllin concentrations ranging from 0 to . Note that the scanning angle is and the incident angle is 76 deg in every case.  Table 1The standard deviations of the measured values of R, γ, and Δ obtained on four repeated tests over the measured concentration range of chlorophyllin samples.
The CB samples were prepared using 10-mL glucose solution samples ( Merck Ltd) with concentrations ranging from 0 to in increments mixed with 2-mL chlorophyllin (C6003, Sigma-Aldrich Co. LLC) and 0.5-mL polystyrene microspheres ( Duke Standard™). Figure 8(a) shows the experimental and simulation results for the values of the various samples given a scanning angle of 135 deg in every case. As shown, decreases linearly with an increasing glucose concentration. Figures 8(b) and 8(c) show the experimental and simulation results for the and values of the various samples. It is seen that the value increases linearly with an increasing glucose concentration, while the value remains approximately constant. As for the CD samples, a good qualitative agreement exists between the experimental and simulated values in every case. The standard deviations of the measured values of , , and obtained on four repeated tests over the measured concentration range of glucose samples are shown in Table 2. Fig. 8Experimental and simulated results for: (a) ; (b) ; and (c) of CB samples with glucose concentrations ranging from 0 to . Note that the scanning angle is and the incident angle is 76 deg in every case. 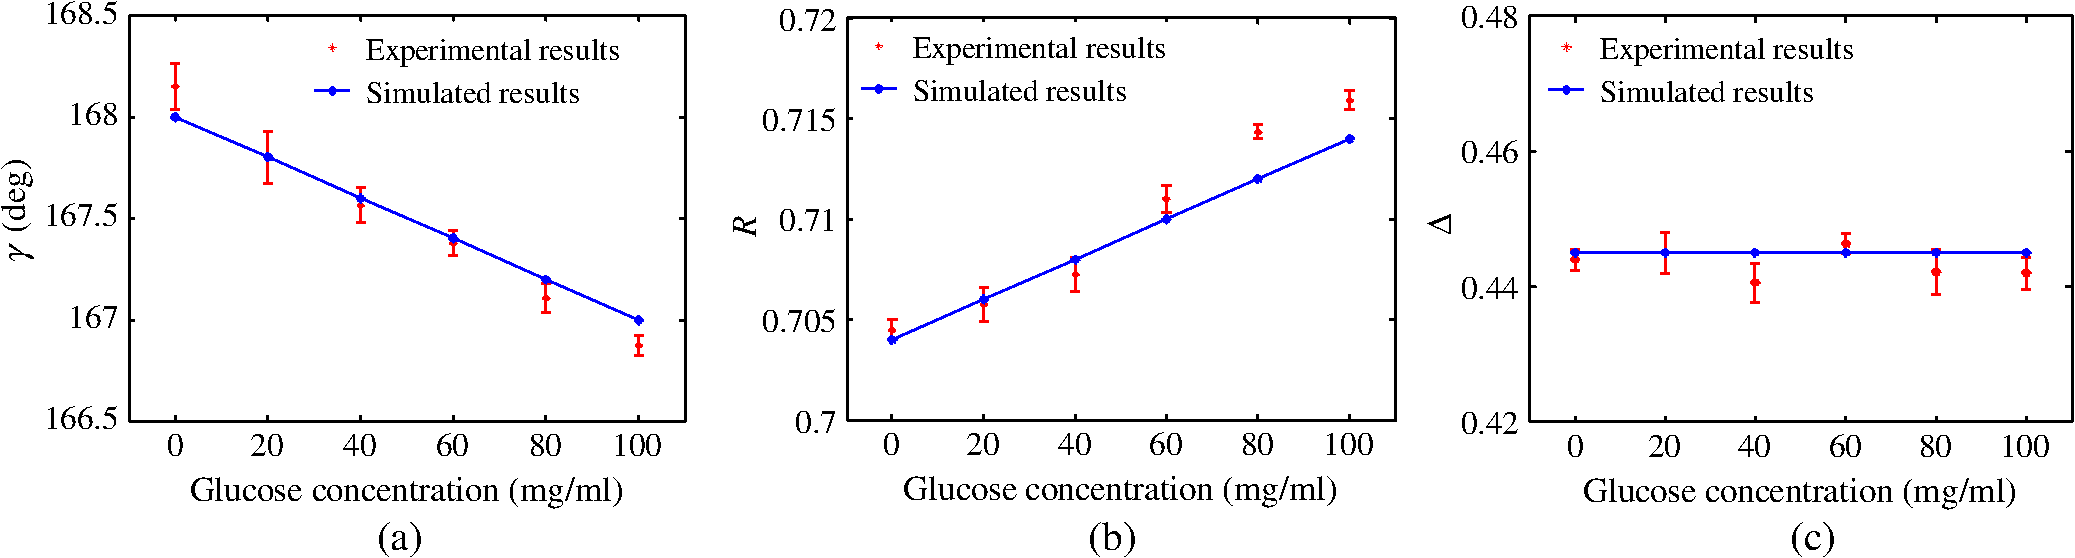 Table 2The standard deviations of the measured values of γ, R, and Δ obtained on four repeated tests over the measured concentration range of glucose samples.
Overall, the results presented in Figs. 7 and 8 show that the extracted values of and are linearly correlated with the chlorophyllin and glucose concentration over the considered range. As a result, the feasibility of the proposed method for extracting the optical properties of turbid media is confirmed. In addition, the results show that the extracted value is insensitive to changes in the chlorophyllin and glucose concentration over the range of 0 to and 0 to . 8.Conclusions and SuggestionsThis study presents a CB/CD/DOP measurement technique based on an SPR prism coupler and Stokes–Mueller matrix polarimetry. The validity of the proposed method is demonstrated both numerically and experimentally. The simulation results show that the proposed method enables the CB and CD properties to be measured with resolutions of and , respectively, for refractive indices in the range of 1.3 to 1.4. The simulation results also show that the measured DOP is insensitive to changes in the refractive index of the sample over the range of 1.3 to 1.4. However, in practice, the sensitivity of the measurements can be enhanced through an appropriate design of the prism coupler structure. The experimental results show that the measured CB and CD values are linearly related to the chlorophyllin and glucose concentrations, respectively, over the measured range. Furthermore, the average deviations of the CD, CB, and DOP measurements over four repeated tests are approximately , , and , respectively. Thus, the feasibility of the SPR-enhanced Stokes–Mueller matrix polarimetry technique proposed in this study for practical CB/CD/DOP sensing applications is confirmed. AcknowledgmentsThe authors gratefully acknowledge the financial support provided for this study by the Ministry of Science and Technology of Taiwan (MOST) under Grant Nos. 104-2221-E-006-125-MY2, 104-3113-E-006-002, and 105-3113-E-006-002. The research was also supported in part by the Ministry of Education, Taiwan, under the “Aim for Top University Project” of National Cheng Kung University (NCKU), Taiwan. ReferencesA. Bhandari et al.,
“Stokes scattering matrix for human skin,”
Appl. Opt., 51
(31), 7487
–7497
(2012). http://dx.doi.org/10.1364/AO.51.007487 APOPAI 0003-6935 Google Scholar
S. Firdous and M. Ikram,
“Stokes polarimetry for the characterization of biomaterial using liquid crystal variable retarders,”
Proc. SPIE, 6632 66320F
(2012). http://dx.doi.org/10.1117/12.729229 PSISDG 0277-786X Google Scholar
K. Hassani and K. Abbaszadeh,
“Thin film characterization with a simple Stokes ellipsometer,”
Eur. J. Phys., 36
(2), 025017
(2015). http://dx.doi.org/10.1088/0143-0807/36/2/025017 Google Scholar
N. Gosh et al.,
“Mueller matrix decomposition for polarized light assessment of biological tissue,”
J. Biophotonics, 2
(3), 145
–156
(2009). http://dx.doi.org/10.1002/jbio.v2:3 Google Scholar
S. A. Hall et al.,
“Combined stokes vector and Mueller matrix polarimetry for materials characterization,”
Anal. Chem., 85
(15), 7613
–7619
(2013). http://dx.doi.org/10.1021/ac401864g ANCHAM 0003-2700 Google Scholar
C. W. Sun et al.,
“Characterization of tooth structure and the dentin enamel zone based on the Stokes-Mueller calculation,”
J. Biomed. Opt., 17
(11), 116026
(2012). http://dx.doi.org/10.1117/1.JBO.17.11.116026 JBOPFO 1083-3668 Google Scholar
S. Y. Lu and R. A. Chipman,
“Interpretation of Mueller matrices based on polar decomposition,”
J. Opt. Soc. Am. A, 13
(5), 1106
–1113
(1996). http://dx.doi.org/10.1364/JOSAA.13.001106 JOAOD6 0740-3232 Google Scholar
S. Kumar et al.,
“Comparative study of differential matrix and extended polar decomposition formalism for polarimetric characterization of complex tissue-like turbid media,”
J. Biomed. Opt., 17
(10), 105006
(2012). http://dx.doi.org/10.1117/1.JBO.17.10.105006 JBOPFO 1083-3668 Google Scholar
N. Ghosh and I. A. Vitkin,
“Tissue polarimetry: concepts, challenges, application and outlook,”
J. Biomed. Opt., 16
(11), 110801
(2011). http://dx.doi.org/10.1117/1.3652896 JBOPFO 1083-3668 Google Scholar
T. H. H. Pham and Y. L. Lo,
“Extraction of effective parameters of anisotropic optical materials using a decoupled analytical method,”
J. Biomed. Opt., 17
(2), 025006
(2012). http://dx.doi.org/10.1117/1.JBO.17.2.025006 JBOPFO 1083-3668 Google Scholar
T. H. H. Pham and Y. L. Lo,
“Extraction of effective parameters of turbid media utilizing the Mueller matrix approach: study of glucose sensing,”
J. Biomed. Opt., 17
(9), 0970021
(2012). http://dx.doi.org/10.1117/1.JBO.17.9.097002 JBOPFO 1083-3668 Google Scholar
N. O. Quijano et al.,
“Experimental validation of Mueller matrix differential decomposition,”
Opt. Express, 20
(2), 1151
–1163
(2012). http://dx.doi.org/10.1364/OE.20.001151 OPEXFF 1094-4087 Google Scholar
C. C. Liao and Y. L. Lo,
“Extraction of anisotropic parameters of turbid media using hybrid model comprising differential and decomposition based Mueller matrices,”
Opt. Express, 21
(14), 16831
–16853
(2013). http://dx.doi.org/10.1364/OE.21.016831 OPEXFF 1094-4087 Google Scholar
L. Wu et al.,
“Highly sensitive grapheme biosensors based on surface plasmon resonance,”
Opt. Exp., 18
(14), 14395
–14400
(2010). http://dx.doi.org/10.1364/OE.18.014395 OPEXFF 1094-4087 Google Scholar
Q. Fernandez et al.,
“Circular dichroism of chiral nematic films of cellulose nanocrystals loaded with plasmonic nanoparticles,”
ACS Nano, 9
(10), 10377
–10385
(2015). http://dx.doi.org/10.1021/acsnano.5b04552 ANCAC3 1936-0851 Google Scholar
Q. H. Phan, P. M. Yang and Y. L. Lo,
“Surface plasmon resonance prism coupler for gas sensing based on Stokes polarimetry,”
Sens. Actuators B, 216 247
–254
(2015). http://dx.doi.org/10.1016/j.snb.2015.04.050 SABCEB 0925-4005 Google Scholar
N. Ghosh and I. A. Vitkin,
“Surface plasmon resonance sensors based on diffraction gratings and prism couplers: sensitivity comparison,”
Sens. Actuators B, 54 16
–24
(1999). http://dx.doi.org/10.1016/S0925-4005(98)00322-0 SABCEB 0925-4005 Google Scholar
H. Arwin, M. Poksinski and K. Johansen,
“Total internal reflection ellipsometry: principles and applications,”
Appl. Opt., 43
(15), 3028
–3036
(2004). http://dx.doi.org/10.1364/AO.43.003028 APOPAI 0003-6935 Google Scholar
N. C. H. Le et al.,
“Ultrathin and smooth poly (methyl methacrylate) (PMMA) films for label free biomolecule detection with total internal reflection ellipsometry (TIRE),”
Biosens. Bioelectron., 36
(1), 250
–256
(2012). http://dx.doi.org/10.1016/j.bios.2012.04.032 BBIOE4 0956-5663 Google Scholar
J. G. Olender et al.,
“A total internal reflectance ellipsometry and atomic force microscopy study of interactions between proteus mirabilis lipopolysaccharides and antibodies,”
Eur. Biophys. J., 44
(5), 301
–307
(2015). http://dx.doi.org/10.1007/s00249-015-1022-0 EBJOE8 0175-7571 Google Scholar
Z. Balevicius et al.,
“In situ study of ligand receptor interaction by total internal reflection ellipsometry,”
Thin Film Solid, 571 744
–748
(2014). http://dx.doi.org/10.1016/j.tsf.2013.10.090 Google Scholar
Z. Balevicius et al.,
“Study of optical anisotropy in thin molecular layers by total internal reflection ellipsometry,”
Sens. Actuators B, 181 119
–124
(2013). http://dx.doi.org/10.1016/j.snb.2013.01.059 SABCEB 0925-4005 Google Scholar
Q. H. Phan, Y. L. Lo and C. L. Huang,
“Surface plasmon resonance prism coupler for enhanced circular dichroism sensing,”
Opt. Express, 24
(12), 12812
–12824
(2016). http://dx.doi.org/10.1364/OE.24.012812 OPEXFF 1094-4087 Google Scholar
C. Houssier and K. Sauer,
“Circular dichroism and magnetic circular dichroism of the chlorophyll and protochlorophyll pigments,”
J. Am. Chem. Soc., 92
(4), 779
–791
(1970). http://dx.doi.org/10.1021/ja00707a007 JACSAT 0002-7863 Google Scholar
R. Syafinar et al.,
“Chlorophyll pigments as nature based dye for dye-sensitized solar cell (DSSC),”
Energy Procedia, 79 896
–902
(2015). http://dx.doi.org/10.1016/j.egypro.2015.11.584 1876-6102 Google Scholar
C. Y. Tan and Y. X. Huang,
“Dependence of refractive index on concentration and temperature in electrolyte solution, polar solution, nonpolar solution and protein solution,”
J. Chem. Eng. Data, 60
(10), 2827
–2833
(2015). http://dx.doi.org/10.1021/acs.jced.5b00018 JCEAAX 0021-9568 Google Scholar
Y. L. Lo, Y. F. Chung and H. H. Lin,
“Polarization scanning ellipsometry method for measuring effective ellipsometry parameters of isotropic and anisotropic thin films,”
J. Lightwave Technol., 31
(14), 2361
–2369
(2013). http://dx.doi.org/10.1109/JLT.2013.2265716 JLTEDG 0733-8724 Google Scholar
Y. L. Yeh,
“Real-time measurement of glucose concentration and average refractive index using a laser interferometer,”
Opt. Laser. Eng., 46
(9), 666
–670
(2008). http://dx.doi.org/10.1016/j.optlaseng.2008.04.008 OLENDN 0143-8166 Google Scholar
W. M. B. M. Yunus and A. B. A. Rahman,
“Refractive index of solutions at high concentrations,”
Appl. Opt., 27
(16), 3341
–3343
(1988). http://dx.doi.org/10.1364/AO.27.003341 APOPAI 0003-6935 Google Scholar
BiographyQuoc-Hung Phan received his BS degree in mechanical engineering from Ho Chi Minh City University of Technology, Vietnam in 2004 and his MS degree in Department of Mechanical Engineering at Southern Taiwan University, Tainan, Taiwan, China. In 2016, he received his doctor’s degree in the Department of Mechanical Engineering, National Cheng Kung University. His research interests include subwavelength sensors, polarimetry, and its application for biosensing. Yu-Lung Lo received his BS degree from National Cheng Kung University, Tainan, Taiwan, China, in 1985, and his MS degree and PhD in mechanical engineering from the Smart Materials and Structures Research Center, University of Maryland, United States, in 1992 and 1995, respectively. His research interests include experimental mechanics, fiber-optic sensors, optical techniques in precision measurements, biophotonics, and additive manufacturing. |
||||||||||||||||||||||||||||||||||||||||||||||||||||||||||||