|
|
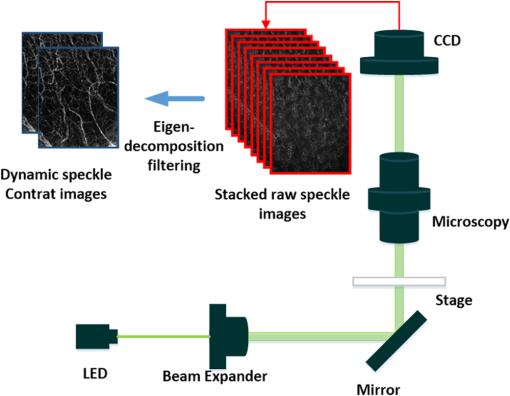
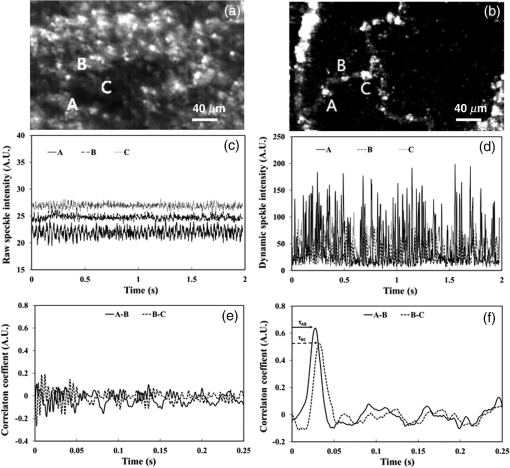
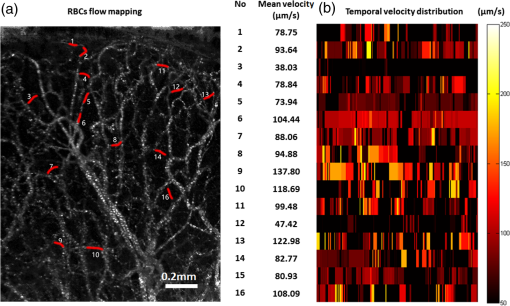
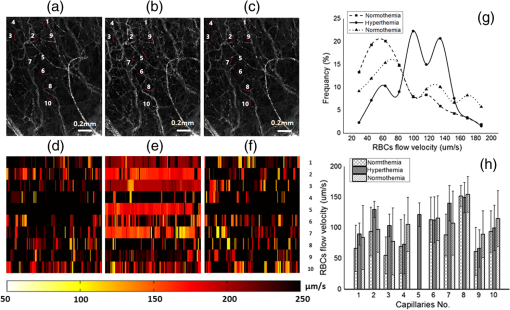
1.IntroductionAn ability to quantitate the velocity of red blood cells (RBCs) in capillary vessels is critical for understanding the dynamic actions of microvascular adaptation to their environment, including physiological changes.1–3 Many optical methods have been developed to measure blood flow, including Doppler-based methods (e.g., laser Doppler flowmetry, Doppler optical coherent tomography, and photoacoustic Doppler),4–6 RBC-tracking measurements [e.g., multiphoton laser scanning microscopy (MPLSM), retinal function imager (RFI)],7,8 and laser speckle contrast imaging (LSCI).9 Doppler-based methods require a prior knowledge of Doppler angle to recover axial velocity components. MPLSM tracks the fluorescently labeled RBCs with high spatial resolution; however, its field of view is severely limited, typically confined to one microvessel at a time, and the fluorescent dye is susceptible to photobleaching. RFI achieves wide-field imaging of blood flow velocity with intrinsic optical signal of RBCs, but its signal–noise ratio (SNR) is low and the measurement is typically confined to the surface blood vessels. By the use of raster scanning of a focused beam spot, several methods based on cross-correlation or autocorrelation have been demonstrated in the fields of photoacoustic imaging and optical coherence tomography to measure velocity of capillary flow.10,11 Although promising, these methods typically compromise the system useful capabilities due to the coupled relationship among imaging speed, field of view, and resolution during practical imaging. Taking the advantages of wide field imaging, simple system setup, and cost-effectiveness, LSCI is a powerful tool for qualitative assessment of tissue blood perfusion. With the statistical model established by Fercher, the metric of speckle contrast defined as the ratio of the standard deviation to the mean value of speckle intensity is mostly used.9 So far, the LSCI method is not amenable to measuring the RBC flows in individual capillaries, which are single files and often heterogeneous in both spatial and temporal dimensions. In this letter, we demonstrate a cross-correlation-based approach to measure the velocity of heterogeneous RBC flows using full-field time-varying dynamic speckle signals captured by a low coherent laser speckle imaging system. To eliminate the effect of static tissue components on the analyses of dynamic flow signals, we propose using an eigen-decomposition filtering (ED-filtering) algorithm to extract the dynamic speckle signal due to the moving RBCs, through which a full-field dynamic RBC flow mapping with high spatial and temporal resolution is achieved.12 The transit time () of RBC flow in one capillary is calculated with the cross-correlation function of the two time-varying dynamic speckle signals obtained at adjacent locations (with a short distance of ). Then, the RBCs flow velocity () is determined through . 2.Method2.1.Dynamic RBC Signal Extraction with ED-Filtering AlgorithmThe coherent light scattered by the blood perfused tissue produces speckle pattern. The tissue components give speckle pattern that is often static, while flowing RBCs give rise to spatial and temporal fluctuations of the speckle pattern. Assuming that the static speckle signal arises from a low dimensional space (with low frequency) and the dynamic signal arises from high dimension (with high frequency), the separation of dynamic speckle signal from static speckle signal could be achieved by dimensional a reduction method such as eigen-decomposition.12,13 In an LSCI system, we assume that a series of raw speckle frames with two spatial dimensions ( array) and one temporal dimension ( frames) are captured by the camera. Then, the raw signals could be reshaped in one spatiotemporal representation (Casorati matrix), where all pixels at the same time point are arranged in one column, and all time points for one pixel are arranged in one row. Viewed from the time dimension, the raw signals would consist of static tissue signal, dynamic RBCs signal, and random white noise. Mathematically, it can be expressed as where the superscript denotes matrix transposition. is a one-dimensional vector with the length of , representing the ’th snapshot of temporal speckle signal. , , and are the matrices (with size of ) of the static tissue signal, dynamic RBCs signal, and white noise, respectively. Assuming that there is no correlation between and , from a vector space perspective, the separation of from can be determined by an ED-filtering algorithm, previous literature.12–14Because the volume fraction of RBCs within tissue is only to 3%, the power of dynamic RBCs signal would be much smaller than that of the static tissue signal for the area of interest. In particular, assuming there are eigenvectors corresponding to the static tissue signal, then the filtering procedure could be achieved via a linear regression strategy that computes the fitting residual between the tissue signal’s eigenvector and the raw speckle signal as follow: where is the ’th eigenvector of . In the experiments described below, and are optimized to be 4 and 2, respectively, to achieve satisfactory SNR and temporal resolution. is finally normalized toward , to eliminate the uneven laser intensity distribution over the imaged area, leading to enhanced contrast of dynamic speckle signal.2.2.Cross-Correlation MethodConsider that there are two time-varying dynamic speckle signals and at two locations of and in one capillary obtained using the method described above. When the same group of RBCs travels from to , the time series of signal would appear as an identical copy of but with a time lag of . Then, it would be trivial that the cross-correlation function can be used to determine the time delay between and 2.3.Laser Speckle Imaging SystemTo demonstrate this approach, we developed a simple laser speckle imaging system as shown in Fig. 1. A collimated beam from a low coherent laser emitted diode (, coherent length, 30-mW output power, and stability of 0.2% within 1 min) was expanded to illuminate the sample. Then, the diffuse transmitted light through the tissue was collected by a microscope and relayed onto a CCD camera (, pixel size , Basler A504k, Germany). The magnification was adjusted to be 9× to meet the requirement of sampling the dynamic speckle pattern of single flowing RBC,15 providing a field view of and a spatial resolution of (pixel-to-pixel spacing). The speckle fluctuation was captured with a 1-ms exposure period and 500-frames per second sampling rate. The mouse pinna was chosen to demonstrate the visualization and quantitation of the velocities of RBC flows in capillaries. During the experiment, the animal was anesthetized and carefully handled in accordance with the laboratory animal protocol approved by the University of Washington Institutional Animal Care and Use Committee. Fig. 1Schematic of the laser speckle imaging system. ED-based filtering algorithm is applied to adjacent ensemble frames throughout all the raw speckle images.  The interference speckle pattern takes place between the scattered light following a similar path that is less than the coherent length. With a low coherent light source, the spatial resolution and imaging contrast would be improved by reducing the contribution of multiple scattering photons, whose optical path length may exceed the coherent length. The speckle pattern is constructive or destructive by the moving RBCs within the image volume, which makes capturing the instantaneously motion of RBCs in capillaries with high resolution possible through the proposed ED-filtering of static tissue components. 3.Results3.1.Quantification of RBCs Flow VelocityFigures 2(a) and 2(b) show one representative raw speckle image and corresponding dynamic image of capillaries from a mouse ear. Figure 2(b) was obtained by the ED-filtering method, described in Sec. 2.1, from four raw speckle images, where the dynamic RBCs flow in the capillary are well extracted from strong static tissue signal. In Figs. 2(c) and 2(d), the solid, dotted, and dashed lines represent the time-varying raw and dynamic speckle signals observed at adjacent locations labeled with “A,” “B,” and “C” in Figs. 2(a) and 2(b), respectively. The peaks in the dynamic speckle signals indicate dynamic fluctuation due to the instantaneous moving RBCs within the imaging volume. Compared with the raw speckle signal, the RBCs flow in the dynamic speckle signal appears with high SNR due to the elimination of strong static tissue signal. The cross-correlation function of the dynamic speckle signals is shown in Fig. 2(f), while that of the raw speckle signals is shown in Fig. 2(e). It can be seen that there is hardly correlation between the raw speckle signals; however, a strong correlation between the extracted dynamic capillary signals is observed, but with a constant time delay of . is related to the transit time of the RBC flow from the location of to , respectively. Fig. 2Quantification of RBCs flow velocity in single capillary. (a) Raw speckle image and (b) dynamic speckle mapping of RBCs flow. (c) Time-varying raw speckle signals and (d) dynamic speckle signals, observed at the locations labeled with “A,” “B,” “C” in (a) and (b), respectively. (e) Time-lagged cross-correlation functions of the raw speckle signals and (f) dynamic speckle signals, where “A-B” (“B-C”) denote the signal measured in A (B) and B (C), respectively.  3.2.Velocity Measurements of Heterogeneous RBC Flow in Mouse EarThe RBC flows in capillaries play an important role in maintaining the proper function of microcirculatory tissue beds, through releasing required oxygen to the surrounding tissue in direct contact with the tissue. Quantifying the RBCs flow velocity and pattern is important for investing the mechanisms of blood flow regulation in the capillary bed. We selected 16 capillaries from the RBCs flow map of the mouse ear in Fig. 2(a) to quantify the temporal flow velocities. With the time-varying dynamic speckle signal captured within 2 s, the moving window along the time dimension is 120 ms in width and 20 ms interval between successive windows, leading to 20 ms resolution for the temporal RBCs flow velocity distribution. The result is provided in Fig. 2(b). It is clear that the RBC flows in the capillaries are highly heterogeneous in both temporal and spatial dimensions. The RBC flows with slower velocity [such as nos. 3 and 12 capillaries shown in Fig. 3(b)] appear more discrete with more “gap” between RBCs. The heterogeneous RBC flows are also related to slower perfusion and nonfully active capillaries under normal physiological state. Fig. 3(a) Full-field RBC flow mapping of in vivo mouse pinna (b) Temporal velocity distribution of RBC flow in 16 capillaries in mouse pinna as shown in (a). (Video 1, MP4, 10.7 MB [URL: http://dx.doi.org/10.1117/1.JBO.22.4.046002.1]).  From a supplementary movie (Video 1), the dynamic speckle signal contains rich information about the RBC flow pattern. The correlated fluctuation patterns between neighboring locations indicate that RBCs moved in an ordered fashion in the capillaries. However, the dynamic speckle signals are less fluctuated in the main vessel branches because the RBCs in there assemble like clusters and travel faster, requiring much a faster sampling rate than that currently used in this study to maintain the signal fidelity. Due to this reason, the current system setup is more applicable to measuring slow and heterogeneous RBC flows in the capillaries. The higher resolution and dynamic range are possible to achieve through proper selections of exposure time of the camera, sampling rate, and microscopic magnification. 3.3.Quantitating Microcirculation Pattern Changes with Body TemperatureQuantitating the RBC flow changes under different physiological states provides additional information for understanding the mechanism of microcirculation regulation. We monitored the microcirculation response to the changes in body temperature, in an attempt to assert the sensitivity of the proposed approach to the changes in RBC flow pattern in capillaries. Figures 4(a)–4(c) show a series of full-field dynamic RBC flow images of the in vivo mouse pinna under the conditions of normothermia, hyperthermia, and returning back to normothermia (after hyperthermia), respectively. The increase of the body temperature leads to the increase of the capillary vessel density of the regions in between larger vessels. Some of the reserved capillaries are seen activated, demonstrating the increase of RBC flow and perfusion in the capillary beds. With the body temperature returning back to normothermia, the capillary vessel density returns to the normal level. Some of the reserved capillaries disappear in the image, as shown in Fig. 4(c), indicating that the flows in those capillaries are no longer needed. Fig. 4Full-field RBC flow mappings of in vivo mouse pinna with (a) normothemia, (b) hyperthermia, and (c) returning to normothemia. Temporal velocity distribution of RBCs flow in 11 capillaries with (d) normothemia, (e) hyperthermia, and (f) returning back to normothemia. The statistical results of the RBC flow velocity response to the thermoregulatory challenge are shown in (g) the frequency distribution and (h) the mean value and standard derivation of RBC flow velocity in single capillaries.  A total of 11 capillaries were chosen to quantify the changes of RBC flow velocities and patterns between normothermia and hyperthermia. As shown in Fig. 4(d), the slow and heterogeneous RBC flow suggests that many capillaries are not maximally utilized in a normal physiological state. With hyperthermia, the RBC flow becomes faster and more homogeneous in most capillaries, leading to high perfusion and efficient oxygen delivery. Meanwhile, some reserved capillaries also became functional [such as no. 5 capillary in Fig. 4(e)]. These changes are also confirmed by the statistical analysis results shown in Figs. 3(g) and 3(h). From frequency distributions of RBC flow velocity, most of the RBC flow is with low velocity under normothermia. With hyperthermia, the number of high-velocity RBCs increases, accompanied by a reduction in the number of low-velocity RBCs. As the body temperature returns to normal state, the RBC flow velocity also comes back to the baseline. The changes of RBC flow pattern in single capillaries are validated with statistical parameters of mean value and standard derivation of temporal velocity, which are related to the velocity and heterogeneity of RBC flow, respectively. As shown in Fig. 3(h), in most of the capillaries, hyperthermia derives the increase of the mean velocity but the decrease of the standard derivation, indicating that RBC flows become faster and try to homogenize. The opposite changes are observed in most of the capillaries when the body temperature return to normothermia. Our results are in good agreement with previous observations.16 However, RBC flow responses to the temperature challenge are a multifactorial phenomenon and are complicated in nature.17 In some other capillaries (such as nos. 4, 9, and 10), the RBC flow velocity does not change immediately with hyperthermia; however, they increase velocity when returning to normothermia. In capillaries (such as no. 8), which has faster RBC flow under normal physiological state, the RBC flow velocity and pattern remain stable with hyperthermia. The current study applies a simple transmission mode to demonstrate the approach, but most of the clinical applications require reflection measurement. As the biotissue is strongly forward‐scattering media, the spatial correlation of the dynamic speckle signals may deteriorate due to lower SNR of the reflected signal when imaging is performed in reflection mode. One way to mitigate this problem is to use a reference arm to facilitate the interference, so the SNR of reflected dynamic speckle signals is increased.18 We anticipate that the proposed approach could be applied in ophthalmology to measure RBC flow of capillaries that are superficially localized within thin and translucent retinal structure. The RBC flows are also related to the capability of oxygen delivery and consumption in the capillary beds. With multiple light sources of different wavelengths, this approach could be applied to measure the velocity and oxygenation of single file RBC flow simultaneously.19 4.SummaryIn conclusion, we have developed an approach to achieve full-field velocity measurements of heterogeneous RBC flows using time-varying dynamic speckle signals. The results of in vivo mouse pinna demonstrated two important features of this approach: (1) its full-field mapping capability and (2) its capability for quantifying the velocity and heterogeneity of RBC flow in capillaries. This technique is expected to be a promising tool for noninvasive investigation of RBC hemodynamics during complicated physiological conditions. AcknowledgmentsThe study was supported in part by the National Heart and Lung Institute (R01HL093140); the National Natural Science Foundation of China (81401454); the International Postdoctoral Exchange Fellowship Program of China (20140066); and China Postdoctoral Science Foundation (2013M541174). ReferencesJ. Lee, W. Wu and D. A. Boas,
“Early capillary flux homogenization in response to neural activation,”
J. Cereb. Blood Flow Metab., 36
(2), 375
–380
(2016). http://dx.doi.org/10.1177/0271678X15605851 Google Scholar
L. Østergaard et al.,
“Cerebral small vessel disease: capillary pathways to stroke and cognitive decline,”
J. Cereb. Blood Flow Metab., 36
(2), 302
–325
(2016). http://dx.doi.org/10.1177/0271678X15606723 Google Scholar
K. S. Øye et al.,
“A novel method for mapping the heterogeneity in blood supply to normal and malignant tissues in the mouse dorsal window chamber,”
Microvasc. Res., 75
(2), 179
–187
(2008). http://dx.doi.org/10.1016/j.mvr.2007.06.009 MIVRA6 0026-2862 Google Scholar
M. Mentek et al.,
“Compact laser Doppler flowmeter fundus camera for the assessment of retinal blood perfusion in small animals,”
PLoS One, 10
(7), e0134378
(2015). http://dx.doi.org/10.1371/journal.pone.0134378 POLNCL 1932-6203 Google Scholar
V. J. Srinivasan et al.,
“Micro-heterogeneity of flow in a mouse model of chronic cerebral hypoperfusion revealed by longitudinal Doppler optical coherence tomography and angiography,”
J. Cereb. Blood Flow Metab., 35
(10), 1552
–1560
(2015). http://dx.doi.org/10.1038/jcbfm.2015.175 Google Scholar
R. Zhang et al.,
“Structured-illumination photoacoustic Doppler flowmetry of axial flow in homogeneous scattering media,”
Appl. Phys. Lett., 103
(9), 094101
(2013). http://dx.doi.org/10.1063/1.4819735 APPLAB 0003-6951 Google Scholar
W. S. Kamoun et al.,
“Simultaneous measurement of RBC velocity, flux, hematocrit and shear rate in vascular networks,”
Nat. Methods, 7
(8), 655
–660
(2010). http://dx.doi.org/10.1038/nmeth.1475 1548-7091 Google Scholar
D. A. Nelson et al.,
“High-resolution wide-field imaging of perfused capillaries without the use of contrast agent,”
Clin. Ophthalmol., 5 1095
–1106
(2011). http://dx.doi.org/10.2147/opth.s20103 Google Scholar
A. Fercher and J. D. Briers,
“Flow visualization by means of single-exposure speckle photography,”
Opt. Commun., 37
(5), 326
–330
(1981). http://dx.doi.org/10.1016/0030-4018(81)90428-4 OPCOB8 0030-4018 Google Scholar
J. Liang et al.,
“Cross-correlation-based transverse flow measurements using optical resolution photoacoustic microscopy with a digital micromirror device,”
J. Biomed. Opt., 18
(9), 096004
(2013). http://dx.doi.org/10.1117/1.JBO.18.9.096004 JBOPFO 1083-3668 Google Scholar
Y. Wang and R. Wang,
“Autocorrelation optical coherence tomography for mapping transverse particle-flow velocity,”
Opt. Lett., 35
(21), 3538
–3540
(2010). http://dx.doi.org/10.1364/OL.35.003538 OPLEDP 0146-9592 Google Scholar
C. Li and R. Wang,
“Dynamic laser speckle angiography achieved by eigen‐decomposition filtering,”
J. Biophotonics,
(2016). http://dx.doi.org/10.1002/jbio.201600237 Google Scholar
R. J. Harris, A Primer of Multivariate Statistics, Psychology Press, New York
(2001). Google Scholar
C. Demené et al.,
“Spatiotemporal clutter filtering of ultrafast ultrasound data highly increases Doppler and fultrasound sensitivity,”
IEEE Trans. Med. Imag., 34
(11), 2271
–2285
(2015). http://dx.doi.org/10.1109/TMI.2015.2428634 ITMID4 0278-0062 Google Scholar
D. Briers et al.,
“Laser speckle contrast imaging: theoretical and practical limitations,”
J. Biomed. Opt., 18
(6), 066018
(2013). http://dx.doi.org/10.1117/1.JBO.18.6.066018 JBOPFO 1083-3668 Google Scholar
S. Yousefi, J. Qin and R. K. Wang,
“Super-resolution spectral estimation of optical micro-angiography for quantifying blood flow within microcirculatory tissue beds in vivo,”
Biomed. Opt. Express, 4
(7), 1214
–1228
(2013). http://dx.doi.org/10.1364/BOE.4.001214 BOEICL 2156-7085 Google Scholar
D. Kellogg,
“In vivo mechanisms of cutaneous vasodilation and vasoconstriction in humans during thermoregulatory challenges,”
J. Appl. Physiol., 100
(5), 1709
–1718
(2006). http://dx.doi.org/10.1152/japplphysiol.01071.2005 Google Scholar
Y. Wang, Z. Ma and R. Wang,
“Mapping transverse velocity of particles in capillary vessels by time-varying laser speckle through perturbation analyses,”
Opt. Lett., 40
(9), 1896
–1899
(2015). http://dx.doi.org/10.1364/OL.40.001896 OPLEDP 0146-9592 Google Scholar
J. Qin et al.,
“Fast synchronized dual-wavelength laser speckle imaging system for monitoring hemodynamic changes in a stroke mouse model,”
Opt. Lett., 37
(19), 4005
–4007
(2012). http://dx.doi.org/10.1364/OL.37.004005 OPLEDP 0146-9592 Google Scholar
|

