

|
|
1.IntroductionGliomas are the most common primary malignant brain tumor in adults and are considered one of the deadliest cancers. Patients with glioblastoma [World Health Organization (WHO) Grade IV glioma] have a median survival of 14 months and a 2-year survival rate of 26%, even when optimal treatment is provided.1,2 Reducing the tumor burden through surgical resection remains the first step in effective glioma management, where studies have shown that more extensive surgical resection is associated with better prognosis.2–9 Unfortunately, the gross-total resection (GTR) of gliomas [complete resection as assessed by postoperative magnetic resonance imaging (MRI)] is challenging due to the diffuse distribution of glioma cells in which the tumor margins are indistinguishable from the surrounding normal brain under visual inspection.10 Furthermore, while a number of modern intraoperative techniques (e.g., intraoperative ultrasonography and MRI) have been developed to guide glioma resections, the reported rates of GTR of gliomas remains low, especially for low-grade gliomas (LGG). A major reason is that for most wide-field imaging techniques, the intensity of each low-resolution pixel represents an average signal from a large number of cells, resulting in a low sensitivity to detecting sparse tumor-cell populations in LGGs, as well as at the diffuse margins of all gliomas. Over and above the goal of achieving GTR (based on MRI), there is a need to visualize and quantify tumor burden beyond the radiographic margins as it is well known that glioma cells infiltrate beyond the regions of MRI contrast-enhancement.11–14 In recent years, numerous reports have detailed the benefits of fluorescence image-guided surgery for the resection of high-grade gliomas (HGGs) in patients who have been administered 5-aminolevulinic acid (5-ALA), a prodrug that induces the production of protoporphyrin IX (PpIX) as a fluorescent contrast agent.15–27 PpIX is an endogenous fluorescent substrate in the heme-synthesis pathway and has been shown to preferentially accumulate in glioma cells due to metabolic dysregulation.28 PpIX emits red fluorescence ( to 700 nm) when excited with violet light ( to 410 nm).29,30 In glioma patients, this accumulation of PpIX is amplified by delivering an oral dose of 5-ALA several hours prior to surgery.16 A landmark randomized phase III clinical trial in Europe showed that PpIX-guided surgeries resulted in more complete tumor resections (GTR of 65% versus 36% for the control group), as well as improved patient outcomes (6-month progression free survival rate of 41% versus 21% for the control group).17 Currently, 5-ALA is approved for neurosurgical use in Europe, Canada, and Japan, and is being used in a number of clinical studies in the United States under Investigational New Drug-approval by the Food and Drug Administration. In spite of its success for guiding the resection of HGGs, PpIX-guided surgery remains less effective for LGGs mainly due to the aforementioned limited resolution and sensitivity of current low-resolution surgical imaging systems. However, in a pilot study in 2011, Sanai et al. demonstrated that an intraoperative confocal microscope, with the ability to resolve subcellular features, could visualize the sparse subcellular expression of PpIX in LGG patients treated with 5-ALA.10 Based on these promising results, our team is developing a handheld video-rate optical-sectioning microscope that is optimized to visualize and quantify subcellular PpIX expression,31 the characteristics of which (e.g., intensity, density, etc.) are believed to be associated with tumor burden and proliferative index.32–34 Ultimately, our objective is to provide an intraoperative imaging device that can provide neurosurgeons with real-time histopathological information and quantitative metrics to optimize the extent of resection for improving patient outcomes. Our device utilizes a dual-axis confocal (DAC) architecture in which the illumination and collection beam paths are spatially separated (Fig. 1). The advantages of the DAC architecture over conventional single-axis confocal microscopes have been discussed previously.35–42 Preliminary ex vivo studies with a prototype DAC microscope have demonstrated that DAC microscopy provides high-contrast images of subcellular PpIX expression in unsectioned human glioma tissues, with qualitative agreement to fluorescence microscopy of slide-mounted histology sections of the same tissue.43 We have also developed a line-scanned dual-axis confocal (LS-DAC) microscope system that operates at a higher frame rate (15 to 30 fps) to reduce motion artifacts (blurring) during handheld clinical use.44–46 Fig. 1(a) Schematic of the LS-DAC microscope. A cylindrical lens “C” is inserted in the collimated region of the illumination path to transform a point focus into a line focus. The focal line is scanned by the scan mirror in the direction to create a 2-D en face image of the sample (in the plane). The hemispherical SIL acts as a sample holder that is translated along the axial () direction by a motorized stage (not shown) to enable volumetric imaging. (b) Zoomed-in view of the LS-DAC microscope near the sample.  Fig. 2Workflow of the study with example images. (a, b) Glioma patients were orally administered 5-ALA prior to PpIX-fluorescence-guided surgery. (c) A brain biopsy (grade-III glioma) obtained during the surgical procedure was then imaged with optical-sectioning fluorescence microscopy to obtain images of PpIX expression with subcellular resolution. (d) Corresponding images from histology slides (both H&E staining and PpIX fluorescence) were obtained to validate the optical-sectioning results. (e, f) Example of wide-field intraoperative images from a high-grade glioma (HGG) and a low-grade glioma (LGG) case, respectively, showing that the tumor resembles the surrounding normal tissues under white light imaging in both cases. (g) Photograph of a biopsy specimen placed on the sample holder of a tabletop LS-DAC microscope. (h) Image of an H&E-stained histology section at as a confirmation of the presence of glioma cells in the biopsy specimen. (i, j) Intraoperative wide-field images of PpIX fluorescence (pink color) from the regions shown in (e) and (f), showing that wide-field surgical fluorescence microscopy was capable of detecting PpIX fluorescence from the HGG but not from the LGG. (k) Optical-sectioning microscopy image of the biopsy, showing subcellular PpIX expression. (l) PpIX fluorescence histology image of the same biopsy imaged in (k), showing a similar pattern of PpIX expression. All scale bars represent .  In the study described here, our aim was to further improve the clinical translational potential of LS-DAC microscopy, as well as other optical-sectioning microscopy approaches (e.g., single-axis confocal microscopy,47–49 nonlinear microscopy,50 structured-illumination microscopy,51,52 etc.) for intraoperative guidance of glioma resections based on PpIX fluorescence. In particular, two advances have been made: (1) a fluorescent bead phantom has been developed, along with an imaging protocol, to optimize the alignment and performance of optical-sectioning microscopes. This will ensure the acquisition of quantitatively reproducible images of PpIX-expressing brain tissues with the potential to standardize numerous devices in future multisite clinical studies. (2) Completion of a pilot clinical study (ex vivo tissues) to demonstrate that the use of our calibration phantom allows for the acquisition of LS-DAC microscopy data that quantitatively correlate with fluorescence histology data, thus further supporting the potential use of LS-DAC microscopy as a real-time, minimally invasive alternative to conventional gold-standard histopathology. 2.Methods2.1.Line-Scanned Dual-Axis Confocal MicroscopeThe microscope system (Fig. 1) used in this study is a modified version of a tabletop LS-DAC microscope system described previously.44,46 In brief, a single-mode fiber-coupled 405-nm diode laser (OBIS-405, Coherent Inc., Santa Clara, California) is collimated and focused into the sample with unity magnification (numerical aperture, ). A planoconvex cylindrical lens (, Optosigma, Santa Ana, California) is inserted in the collimated region of the illumination path to intentionally create a large degree of astigmatism, resulting in a focal line that is long and wide [full width at half maximum (FWHM)]. A one-dimensional galvanometric scanning mirror (6210H, Cambridge Technology, Bedford, Massachusetts) scans the focal line laterally (along the -axis) to create an image that is parallel to the tissue surface (en face). The sample rests on a solid immersion lens (SIL, ) that is mounted on a linear translation stage. The hemispherical SIL performs index matching of the illumination and collection beams as they obliquely propagate from air into the sample. The SIL also acts as a lens that increases the effective NA of the illumination beam from 0.12 to 0.17 (a factor of ).35 Fluorescence photons generated at the focal line of the illumination beam are imaged by the collection optics, which are oriented off-axis at a half-crossing angle of 30.0 deg with respect to the illumination axis. The collection path images the focal line onto an sCMOS detector (Hamamatsu ORCA Flash 4.0 v2) with magnification via a pair of lenses (; ). A 600-nm long-pass fluorescence filter (Semrock BLP01-594R-25) is placed in the beam path to filter out the excitation photons (). Raw images were collected via a camera link frame grabber (Firebird 1xCLD, Active Silicon, United Kingdom) at 1000 raw exposures per second (1 ms per exposure). A custom LabVIEW (National Instruments) program was used to crop out and bin the central three lines of each camera frame (corresponding to the image of the focal line) to create a digital confocal slit ( in width, corresponding to in tissue). These lines were stitched serially in the direction (see Fig. 1) into en face images in real-time at a two-dimensional (2-D) imaging rate of 2 frames per second (fps). As mentioned previously, the LS-DAC microscope is capable of acquiring images at video rates (15 to 30 fps). However, for the purposes of this study, which aimed to develop a standardizable phantom and quantitative imaging methods, a lower frame rate was utilized to maximize signal-to-noise ratios (SNR) and to demonstrate the feasibility of our methods. Volumetric data were collected by translating the sample holder along the axis with a motorized linear actuator (TRA12CC, Newport Corperation, Irvine, California). 2.2.System Standardization with an Agarose-Based Fluorescent Bead Phantom2.2.1.Phantom preparationOur standardization phantom consists of fluorescent microspheres in an agarose gel. The fluorescence microspheres (19111-2, Fluoresbrite polychromatic red microspheres) used for this phantom are commercially available through Polysciences Inc. (Warrington, Pennsylvania). These polystyrene-based microspheres are National Institute of Standards and Technology (NIST)-traceable size standards and are designed to be optimally excited at a wavelength of near 525 nm, with an emission peak at 565 nm. In this study, the particles are excited with low efficiency at 405 nm, and only the tail of the fluorescence spectrum is collected with a 600-nm long-pass filter. While this causes the detected fluorescence signal to be relatively weak (compared with the fluorescence signal from the beads at their optimal excitation/emission wavelengths), this weaker signal approximates the strength of the PpIX fluorescence seen in glioma tissues from patients who have been administered 5-ALA and allows the alignment and performance of the microscope to be assessed under realistic conditions (in situ fluorescence signal levels). The stock concentration of microspheres (2.5% aqueous suspension) was diluted 40 times in a 0.8% agarose solution (Sigma Aldrich A9539) at 70°C, and the mixture was allowed to solidify while cooling to room temperature. 2.2.2.Phantom-assisted alignmentBecause PpIX has an unusually large Stoke’s shift (; ), the proper alignment of the illumination and collection beam paths of the DAC microscope (or any alternative microscope technology) must account for the chromatic differences between these disparate wavelengths. The fluorescent bead phantom developed in this study is used to provide a high-resolution target (the beads are in diameter) that may be used to optimize the alignment of the microscope at an illumination and collection wavelength of 405 and , respectively. Volumetric imaging data of the phantom are collected to verify that both the sensitivity (SNR) and the three-dimensional spatial resolution (FWHM dimensions of the beads) are uniform across the field of view (FOV), confirming satisfactory alignment of the dual-axis beams with respect to each other (for high resolution) and with respect to the hemispherical SIL (for uniform resolution across the FOV). For clinical use, a method to verify that the performance of an optical-sectioning microscope is reproducible is to measure the SNR and spatial resolution of the microscope in a volumetric phantom. Here, the SNR is calculated as where is the mean of the peak pixel intensity of all beads in an image, is the mean pixel intensity of the background, and is the standard deviation of the background signal. Note that the standard deviation of the peak signal from each bead cannot be reliably measured due to the small size of the beads and their spherical geometry, with only a single pixel corresponding to the peak of each bead.2.3.Ex Vivo Imaging of PpIX-Expressing Human Brain Tissues2.3.1.Tissue preparationGlioma tissue samples () were collected from consenting patients at the Barrow Neurological Institute (Phoenix, Arizona) in accordance with an approved protocol (IRB #10BN159). Patients were orally administered 5-ALA at a concentration of 3 h prior to surgery, and brain biopsies obtained during surgery were fixed in 3% paraformaldehyde for 24 h and then stored in phosphate-buffered saline at 4°C before being imaged with a custom LS-DAC microscope. All tissue specimens were obtained from MRI-enhancing regions corresponding to the bulk tumor. After the LS-DAC images were taken, the imaged tissue surfaces were physically sectioned ( in thickness) in the en face direction (as close and parallel to the tissue surface as possible) and mounted on standard microscope slides. Histology slides were imaged with a conventional epifluorescence microscope (DMIRB inverted, Leica Inc., Wetzlar, Germany) to visualize intracellular PpIX expression (625-nm emission). In addition, adjacent sections were stained with hematoxylin and eosin (H&E) and imaged with a standard bright-field pathology microscope (Fig. 2). 2.3.2.Image acquisition and quantificationFor LS-DAC microscopy, volumetric imaging data were collected at three random tissue locations from each tissue specimen. The FOV of the microscopy datasets was () by () by (, depth), and the sampling pitch in these three dimensions was 0.79, 0.88, and , respectively. From each volumetric dataset, -thick average-intensity projections (i.e., optical sections) were visualized to simulate images of -thick slide-mounted histology sections. For the quantitative comparison study of LS-DAC microscopy versus fluorescence histology, three regions of interest ( by ) were randomly selected for correlative analysis. Identical microscope settings were used for the imaging of all histology slides. In this study, we attempted to quantify the density of the expression of punctate and localized spots of PpIX that appear in glioma tissues.32,53 The density of PpIX expression was quantified using an identical algorithm for both the LS-DAC microscopy and fluorescence histology images. In brief, the algorithm identifies and quantifies the density of localized spots of PpIX that are brighter than the tissue background (mostly autofluorescence) in which the background is assumed (and observed) to be relatively uniform. The quantification algorithm was implemented via a custom MATLAB® script.
Fig. 3The same quantification algorithm was used for both LS-DAC images and histology images. (a) Example image of PpIX-expressing glioma tissue obtained with the LS-DAC microscope, the performance of which is standardized with the method detailed in Sec. 2.2. The scale bar represents . (b) Histogram of the raw image in which the intensity distribution of the background is approximated as an exponential decay. The dotted line denotes the threshold for segmentation in which pixels with intensities above this threshold are considered “positive” for PpIX expression. (c) A binary image of (a) obtained after segmentation, utilizing a 99.5th percentile threshold to the exponential fit. 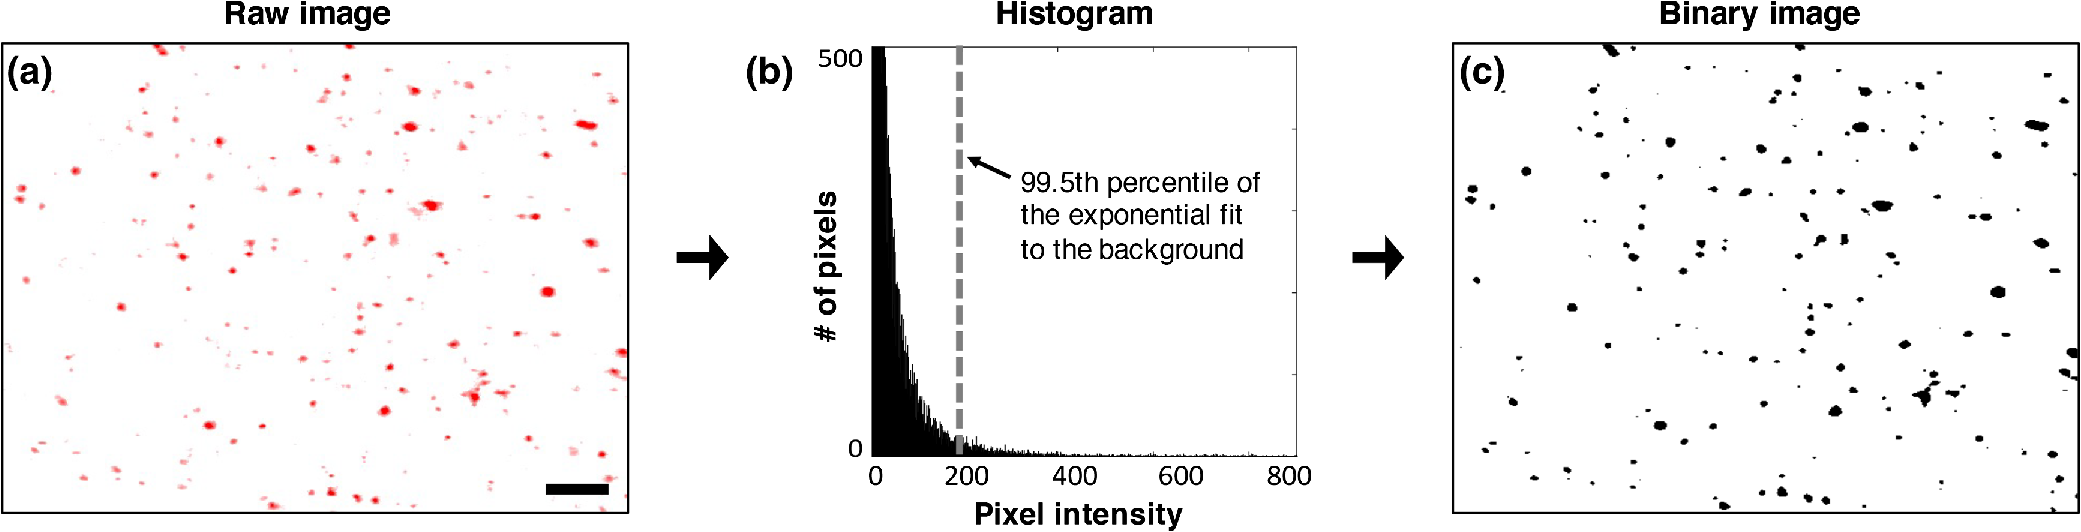 3.ResultsA total of 14 high- and low-grade glioma samples were imaged during a 15-month period. To ensure the identical performance of the imaging system on different days, the SNR of detection (see Sec. 2.2) was quantified from images of the fluorescent phantom. In addition, the spatial resolution of the system (in all three dimensions) and the uniformity of performance across the FOV were also assessed to confirm the proper alignment of the LS-DAC system (Fig. 4). With the system settings fixed (see Sec. 2.1), the following parameters could be attained in multiple experiments over the entire course of the study (15 months): the SNR of detection was ; the average measured dimensions (FWHM) of the fluorescent beads () were in the lateral directions and in the axial direction (enlarged due to diffraction and minor aberrations). No noticeable fluorescence degradation was observed in the microspheres within a shelf life of 12 months. Fig. 4(a) A maximum-intensity depth projection (along the axis) of a volumetric image of the alignment phantom is shown for a misaligned LS-DAC microscope. (b) A maximum intensity projection of a volumetric image of the phantom (Video 1) is shown from a well-aligned system in which the intensity of the fluorescent beads is uniform across the FOV with deviation (center to edge) and all beads are well-resolved across the entire FOV of () by () by () (Video 1, MPEG, 2.6 MB [URL: http://dx.doi.org/10.1117/1.JBO.22.4.046005.1]). (c) Example cross-sectional views of one bead. The FWHM dimensions of the microsphere allow for the assessment of the spatial resolution of the system. (d, e) Alpha-blending volume renderings of (a and b), respectively, illustrate the uniformity of the detected fluorescence signal from the beads as well as the uniformity of the spatial resolution across the entire FOV. The scale bar represents . 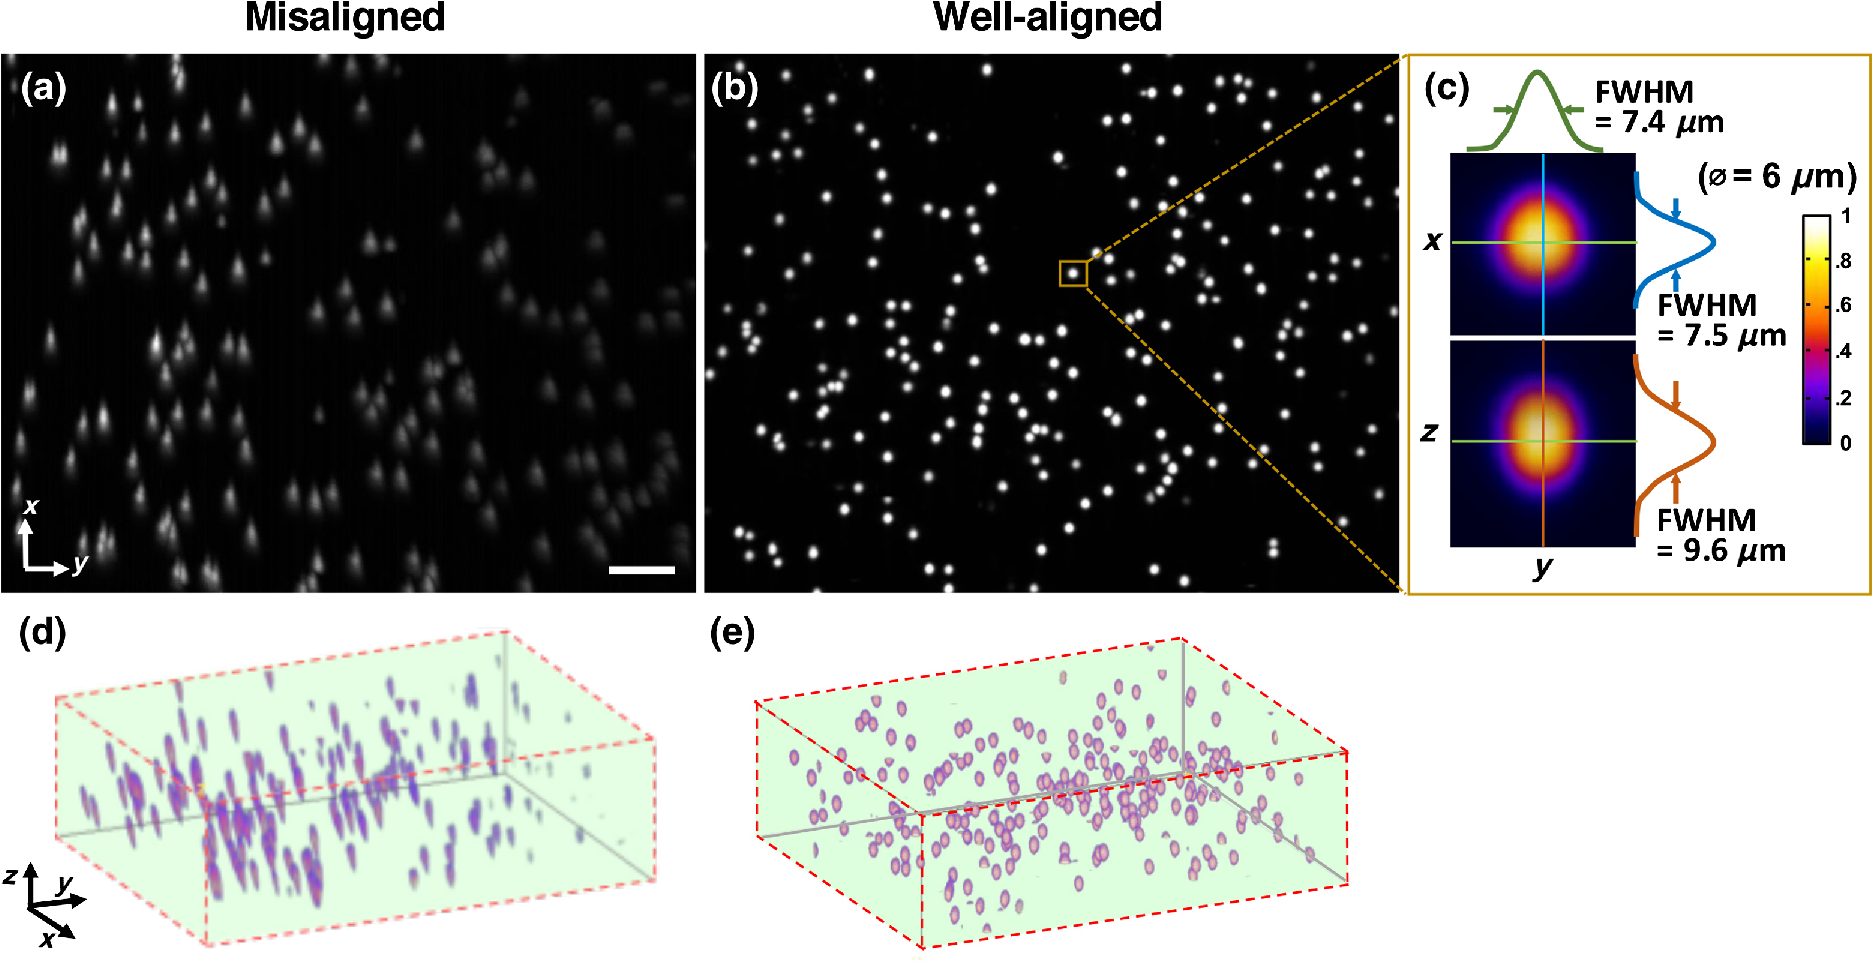 For each of the 14 samples, a optical section was obtained at three random tissue locations (see Sec. 2.3.2) with the LS-DAC microscope, and the average PpIX density (defined in Sec. 2.2.2) at these three locations was quantified. The same metric (PpIX density) was calculated from the corresponding histology images, and a positive linear relationship was observed between LS-DAC microscopy versus histology (Fig. 5). Fig. 5Quantitative comparison of LS-DAC microscopy images versus corresponding fluorescence histology images in terms of PpIX density. (a) Representative binary images of two of the biopsy samples, one with low PpIX density (blue) and the other with high PpIX density (red). (b) Scatter plot of all 14 glioma specimens obtained over 15 months. Each point on the scatter plot represents the average PpIX density at three randomly chosen locations within each biopsy sample, with the error bars indicating the standard deviation from the measurements. Note that a volumetric dataset (Video 2) was collected at each tissue location, but only a optical section at the surface was quantified to simulate a slide-mounted histology section. The scale bars represent . (Video 2, MPEG, 1.4 MB [URL: http://dx.doi.org/10.1117/1.JBO.22.4.046005.2]). 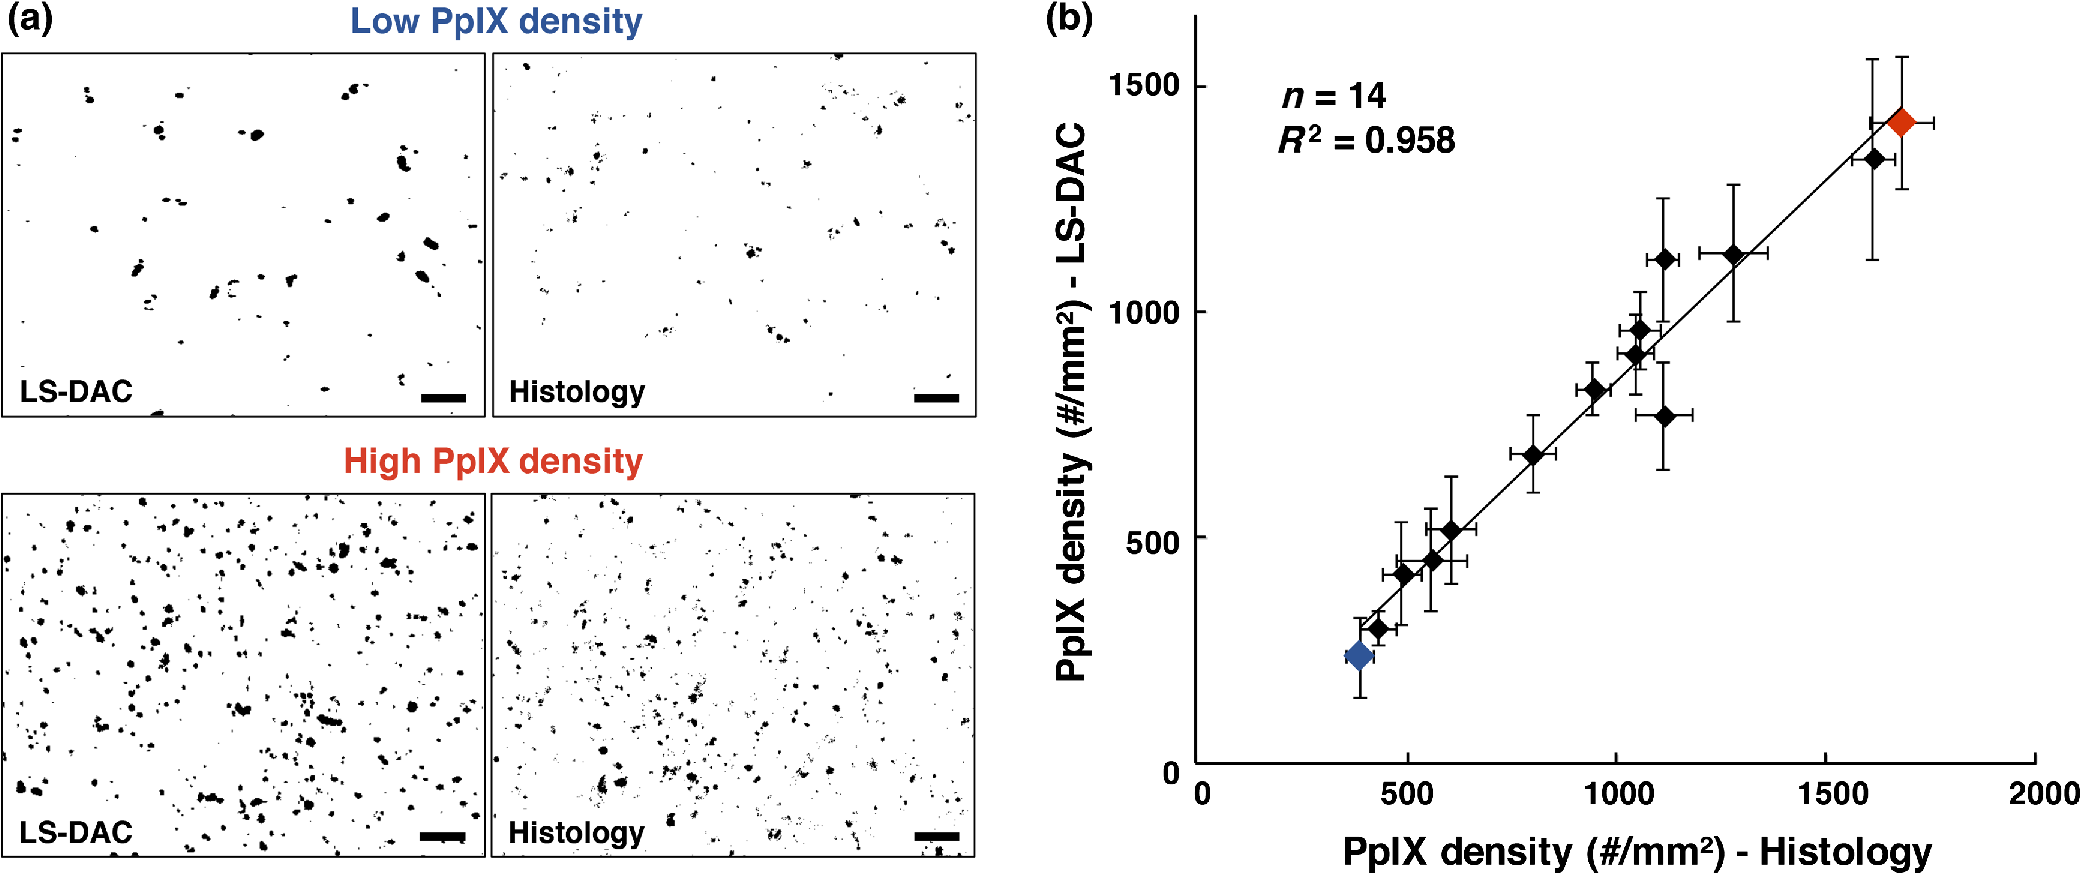 4.Discussion and ConclusionThis study developed a set of tools to enhance the clinical translation of optical-sectioning microscopes for real-time pathology and quantitative surgical guidance of glioma resections. First, a standardization method based on a fluorescent bead phantom was developed. This custom phantom is highly reproducible, stable, and simple to prepare and provides uniform microscopic structures that mimic the sparse and weak fluorescence from 5-ALA-induced PpIX generated by subcellular organelles within glioma tissues. As shown in Fig. 4, this phantom is a valuable tool for ensuring the proper alignment of an optical-sectioning microscope, enabling quantitative characterization of the sensitivity, resolution, and uniformity of the imaging system. As a result, it is possible to obtain reproducible quantitative images of PpIX-expressing brain tissues, which will be necessary to standardize the performance of clinical devices in single-site clinical studies over time and/or in multisite clinical studies. This standardization method is applicable to a variety of optical-sectioning microscopy technologies for intraoperative guidance of glioma resections based on PpIX fluorescence. Second, we showed that quantitative PpIX images obtained with LS-DAC microscopy correlate positively with fluorescence histology, suggesting that LS-DAC microscopy can potentially serve as a minimally invasive and real-time alternative to conventional biopsy and histopathology. In this study, the density of localized spots of subcellular PpIX expression was chosen as a quantitative metric of interest because it is a potential surrogate measure of tumor burden. We show that PpIX density is an objective quantity that can be extracted from both DAC microscopy and histology images, with excellent correlation between these two techniques. Importantly, we note that PpIX density alone may not be an accurate indicator of tumor burden. For example, in some cases, although PpIX density is high, the intensity of the PpIX fluorescence may be low, and/or the size of the PpIX-expressing spots may be smaller than in other specimens. This observation suggests that the intensity and sizes of the signal should also be taken into account when developing a surrogate measure of tumor burden or proliferative index. The observations are consistent with our biological understanding of PpIX generation as the volumetric production of PpIX granular inclusion bodies in brain tumor cells can vary from cell to cell. Ultimately, the clinical significance of these different metrics, for the purposes of optimizing the extent of resection for glioma patients, must be validated through outcome-based clinical studies. Toward this aim, a miniature version of the LS-DAC microscope utilized in this study is currently being assembled and characterized45 in preparation for future clinical use. In summary, the developments in this study are of value for the clinical translation of handheld intraoperative fluorescence microscopes to guide the resection of gliomas and to improve outcomes for glioma patients. AcknowledgmentsThe authors acknowledge funding support from the National Institute of Dental and Craniofacial Research: R01 DE023497 (Liu), the National Institute of Neurological Diseases and Stroke: R01 NS082745 (Sanai), and the National Cancer Institute: R01 CA175391 (Liu and Sanai). ReferencesA. Sottoriva et al.,
“Intratumor heterogeneity in human glioblastoma reflects cancer evolutionary dynamics,”
Proc. Natl. Acad. Sci. U. S. A., 110
(10), 4009
–4014
(2013). http://dx.doi.org/10.1073/pnas.1219747110 Google Scholar
D. A. Hardesty and N. Sanai,
“The value of glioma extent of resection in the modern neurosurgical era,”
Front. Neurol., 3 140
(2012). http://dx.doi.org/10.3389/fneur.2012.00140 Google Scholar
R. Ahmadi et al.,
“Long-term outcome and survival of surgically treated supratentorial low-grade glioma in adult patients,”
Acta Neurochir., 151
(11), 1359
(2009). http://dx.doi.org/10.1007/s00701-009-0473-4 Google Scholar
J. S. Smith et al.,
“Role of extent of resection in the long-term outcome of low-grade hemispheric gliomas,”
J. Clin. Oncol., 26
(8), 1338
–1345
(2008). http://dx.doi.org/10.1200/JCO.2007.13.9337 Google Scholar
E. B. Claus et al.,
“Survival rates in patients with low-grade glioma after intraoperative magnetic resonance image guidance,”
Cancer, 103
(6), 1227
–1233
(2005). http://dx.doi.org/10.1002/(ISSN)1097-0142 CANCAR 0008-543X Google Scholar
S. L. Hervey-Jumper and M. S. Berger,
“Role of surgical resection in low- and high-grade gliomas,”
Curr. Treat. Options Neurol., 16
(4), 284
(2014). http://dx.doi.org/10.1007/s11940-014-0284-7 Google Scholar
N. Sanai et al.,
“An extent of resection threshold for newly diagnosed glioblastomas,”
J. Neurosurg., 115
(1), 3
–8
(2011). http://dx.doi.org/10.3171/2011.2.JNS10998 Google Scholar
G. E. Keles, K. R. Lamborn and M. S. Berger,
“Low-grade hemispheric gliomas in adults: a critical review of extent of resection as a factor influencing outcome,”
J. Neurosurg., 95
(5), 735
–745
(2001). http://dx.doi.org/10.3171/jns.2001.95.5.0735 Google Scholar
N. Sanai, M. Y. Polley and M. S. Berger,
“Insular glioma resection: assessment of patient morbidity, survival, and tumor progression,”
J. Neurosurg., 112
(1), 1
–9
(2010). http://dx.doi.org/10.3171/2009.6.JNS0952 Google Scholar
N. Sanai et al.,
“Intraoperative confocal microscopy in the visualization of 5-aminolevulinic acid fluorescence in low-grade gliomas,”
J. Neurosurg., 115
(4), 740
–748
(2011). http://dx.doi.org/10.3171/2011.6.JNS11252 Google Scholar
N. Galldiks et al.,
“Volumetry of [(11)C]-methionine PET uptake and MRI contrast enhancement in patients with recurrent glioblastoma multiforme,”
Eur. J. Nucl. Med. Mol. Imaging, 37
(1), 84
–92
(2010). http://dx.doi.org/10.1007/s00259-009-1219-5 Google Scholar
L. D. Lunsford, A. J. Martinez and R. E. Latchaw,
“Magnetic resonance imaging does not define tumor boundaries,”
Acta Radiol. Suppl., 369 154
–156
(1986). Google Scholar
J. Pallud et al.,
“Diffuse low-grade oligodendrogliomas extend beyond MRI-defined abnormalities,”
Neurology, 74
(21), 1724
–1731
(2010). http://dx.doi.org/10.1212/WNL.0b013e3181e04264 NEURAI 0028-3878 Google Scholar
D. O. Kamson et al.,
“Tryptophan PET in pretreatment delineation of newly-diagnosed gliomas: MRI and histopathologic correlates,”
J. Neurooncol., 112
(1), 121
–132
(2013). http://dx.doi.org/10.1007/s11060-013-1043-4 Google Scholar
W. Stummer et al.,
“Intraoperative detection of malignant gliomas by 5-aminolevulinic acid-induced porphyrin fluorescence,”
Neurosurgery, 42
(3), 518
–526
(1998). http://dx.doi.org/10.1097/00006123-199803000-00017 NEQUEB Google Scholar
C. G. Hadjipanayis, G. Widhalm and W. Stummer,
“What is the surgical benefit of utilizing 5-aminolevulinic acid for fluorescence-guided surgery of malignant gliomas?,”
Neurosurgery, 77
(5), 663
–673
(2015). http://dx.doi.org/10.1227/NEU.0000000000000929 NEQUEB Google Scholar
W. Stummer et al.,
“Fluorescence-guided surgery with 5-aminolevulinic acid for resection of malignant glioma: a randomised controlled multicentre phase III trial,”
Lancet Oncol., 7
(5), 392
–401
(2006). http://dx.doi.org/10.1016/S1470-2045(06)70665-9 Google Scholar
P. A. Valdes et al.,
“5-Aminolevulinic acid-induced protoporphyrin IX fluorescence in meningioma: qualitative and quantitative measurements in vivo,”
Neurosurgery, 10
(Suppl. 1), 74
–82
(2014). http://dx.doi.org/10.1227/NEU.0000000000000117 NEQUEB Google Scholar
M. Jaber et al.,
“The value of 5-aminolevulinic acid in low-grade gliomas and high-grade gliomas lacking glioblastoma imaging features: an analysis based on fluorescence, magnetic resonance imaging, 18F-fluoroethyl tyrosine positron emission tomography, and tumor molecular factors,”
Neurosurgery, 78
(3), 401
–411
(2016). http://dx.doi.org/10.1227/NEU.0000000000001020 NEQUEB Google Scholar
R. Diez Valle et al.,
“Surgery guided by 5-aminolevulinic fluorescence in glioblastoma: volumetric analysis of extent of resection in single-center experience,”
J. Neurooncol., 102
(1), 105
–113
(2011). http://dx.doi.org/10.1007/s11060-010-0296-4 Google Scholar
G. Aldave et al.,
“Prognostic value of residual fluorescent tissue in glioblastoma patients after gross total resection in 5-aminolevulinic acid-guided surgery,”
Neurosurgery, 72
(6), 915
–921
(2013). http://dx.doi.org/10.1227/NEU.0b013e31828c3974 NEQUEB Google Scholar
A. Nabavi et al.,
“Five-aminolevulinic acid for fluorescence-guided resection of recurrent malignant gliomas: a phase II study,”
Neurosurgery, 65
(6), 1070
–1077
(2009). http://dx.doi.org/10.1227/01.NEU.0000360128.03597.C7 NEQUEB Google Scholar
D. W. Roberts et al.,
“Glioblastoma multiforme treatment with clinical trials for surgical resection (aminolevulinic acid),”
Neurosurg. Clin. North Am., 23
(3), 371
–377
(2012). http://dx.doi.org/10.1016/j.nec.2012.04.001 Google Scholar
G. Widhalm et al.,
“5-Aminolevulinic acid induced fluorescence is a powerful intraoperative marker for precise histopathological grading of gliomas with non-significant contrast-enhancement,”
PLoS One, 8
(10), e76988
(2013). http://dx.doi.org/10.1371/journal.pone.0076988 POLNCL 1932-6203 Google Scholar
M. Olivo and B. C. Wilson,
“Mapping ALA-induced PPIX fluorescence in normal brain and brain tumour using confocal fluorescence microscopy,”
Int. J. Oncol., 25
(1), 37
–45
(2004). Google Scholar
P. A. Valdes et al.,
“Quantitative fluorescence using 5-aminolevulinic acid-induced protoporphyrin IX biomarker as a surgical adjunct in low-grade glioma surgery,”
J. Neurosurg., 123
(3), 771
–780
(2015). http://dx.doi.org/10.3171/2014.12.JNS14391 Google Scholar
S. KanekoS. Kaneko,
“Fluorescence-guided resection of malignant glioma with 5-ALA,”
Int. J. Biomed. Imaging, 2016 6135293
(2016). http://dx.doi.org/10.1155/2016/6135293 Google Scholar
Q. Peng et al.,
“5-Aminolevulinic acid-based photodynamic therapy: principles and experimental research,”
Photochem. Photobiol., 65
(2), 235
–251
(1997). http://dx.doi.org/10.1111/php.1997.65.issue-2 Google Scholar
R. M. Valentine et al.,
“Modelling fluorescence in clinical photodynamic therapy,”
Photochem. Photobiol. Sci., 12
(1), 203
–213
(2013). http://dx.doi.org/10.1039/C2PP25271F Google Scholar
M. Marois et al.,
“Characterization and standardization of tissue-simulating protoporphyrin IX optical phantoms,”
J. Biomed. Opt., 21
(3), 035003
(2016). http://dx.doi.org/10.1117/1.JBO.21.3.035003 Google Scholar
J. T. Liu, D. Meza and N. Sanai,
“Trends in fluorescence image-guided surgery for gliomas,”
Neurosurgery, 75
(1), 61
–71
(2014). http://dx.doi.org/10.1227/NEU.0000000000000344 NEQUEB Google Scholar
S. L. Gibbs et al.,
“Protoporphyrin IX level correlates with number of mitochondria, but increase in production correlates with tumor cell size,”
Photochem. Photobiol., 82
(5), 1334
–1341
(2006). http://dx.doi.org/10.1562/2006-03-11-RA-843 Google Scholar
P. A. Valdes et al.,
“-aminolevulinic acid-induced protoporphyrin IX concentration correlates with histopathologic markers of malignancy in human gliomas: the need for quantitative fluorescence-guided resection to identify regions of increasing malignancy,”
Neuro-Oncol., 13
(8), 846
–856
(2011). http://dx.doi.org/10.1093/neuonc/nor086 Google Scholar
R. Ishihara et al.,
“Quantitative spectroscopic analysis of 5-aminolevulinic acid-induced protoporphyrin IX fluorescence intensity in diffusely infiltrating astrocytomas,”
Neurol. Med.–Chir., 47
(2), 53
–57
(2007). http://dx.doi.org/10.2176/nmc.47.53 Google Scholar
J. T. Liu et al.,
“Dual-axes confocal reflectance microscope for distinguishing colonic neoplasia,”
J. Biomed. Opt., 11
(5), 054019
(2006). http://dx.doi.org/10.1117/1.2363363 Google Scholar
J. T. Liu et al.,
“Efficient rejection of scattered light enables deep optical sectioning in turbid media with low-numerical-aperture optics in a dual-axis confocal architecture,”
J. Biomed. Opt., 13
(3), 034020
(2008). http://dx.doi.org/10.1117/1.2939428 Google Scholar
L. K. Wong et al.,
“Improved rejection of multiply scattered photons in confocal microscopy using dual-axes architecture,”
Opt. Lett., 32
(12), 1674
–1676
(2007). http://dx.doi.org/10.1364/OL.32.001674 Google Scholar
B. Larson, S. Abeytunge and M. Rajadhyaksha,
“Performance of full-pupil line-scanning reflectance confocal microscopy in human skin and oral mucosa in vivo,”
Biomed. Opt. Express, 2
(7), 2055
–2067
(2011). http://dx.doi.org/10.1364/BOE.2.002055 Google Scholar
P. J. Dwyer, C. A. DiMarzio and M. Rajadhyaksha,
“Confocal theta line-scanning microscope for imaging human tissues,”
Appl. Opt., 46
(10), 1843
–1851
(2007). http://dx.doi.org/10.1364/AO.46.001843 Google Scholar
Y. Chen, D. Wang and J. T. Liu,
“Assessing the tissue-imaging performance of confocal microscope architectures via Monte Carlo simulations,”
Opt. Lett., 37
(21), 4495
–4497
(2012). http://dx.doi.org/10.1364/OL.37.004495 Google Scholar
D. Wang, Y. Chen and J. T. Liu,
“A liquid optical phantom with tissue-like heterogeneities for confocal microscopy,”
Biomed. Opt. Express, 3
(12), 3153
–3160
(2012). http://dx.doi.org/10.1364/BOE.3.003153 Google Scholar
J. T. Liu et al.,
“Micromirror-scanned dual-axis confocal microscope utilizing a gradient-index relay lens for image guidance during brain surgery,”
J. Biomed. Opt., 15
(2), 026029
(2010). http://dx.doi.org/10.1117/1.3386055 Google Scholar
D. Meza et al.,
“Comparing high-resolution microscopy techniques for potential intraoperative use in guiding low-grade glioma resections,”
Lasers Surg. Med., 47
(4), 289
–295
(2015). http://dx.doi.org/10.1002/lsm.v47.4 Google Scholar
Y. Chen et al.,
“Video-rate in vivo fluorescence imaging with a line-scanned dual-axis confocal microscope,”
J. Biomed. Opt., 20
(10), 106011
(2015). http://dx.doi.org/10.1117/1.JBO.20.10.106011 Google Scholar
C. Yin et al.,
“Miniature in vivo MEMS-based line-scanned dual-axis confocal microscope for point-of-care pathology,”
Biomed. Opt. Express, 7
(2), 251
–263
(2016). http://dx.doi.org/10.1364/BOE.7.000251 Google Scholar
D. Wang et al.,
“Comparison of line-scanned and point-scanned dual-axis confocal microscope performance,”
Opt. Lett., 38
(24), 5280
–5283
(2013). http://dx.doi.org/10.1364/OL.38.005280 Google Scholar
K. C. Maitland et al.,
“In vivo imaging of oral neoplasia using a miniaturized fiber optic confocal reflectance microscope,”
Oral Oncol., 44
(11), 1059
–1066
(2008). http://dx.doi.org/10.1016/j.oraloncology.2008.02.002 EJCCER 1368-8375 Google Scholar
A. A. Tanbakuchi et al.,
“Clinical confocal microlaparoscope for real-time in vivo optical biopsies,”
J. Biomed. Opt., 14
(4), 044030
(2009). http://dx.doi.org/10.1117/1.3207139 Google Scholar
A. A. Tanbakuchi et al.,
“In vivo imaging of ovarian tissue using a novel confocal microlaparoscope,”
Am. J. Obstet. Gynecol., 202
(1), 90.e1
–90.e9
(2010). http://dx.doi.org/10.1016/j.ajog.2009.07.027 Google Scholar
B. F. Grewe et al.,
“High-speed in vivo calcium imaging reveals neuronal network activity with near-millisecond precision,”
Nat. Methods, 7
(5), 399
–405
(2010). http://dx.doi.org/10.1038/nmeth.1453 Google Scholar
N. Bozinovic et al.,
“Fluorescence endomicroscopy with structured illumination,”
Opt. Express, 16
(11), 8016
–8025
(2008). http://dx.doi.org/10.1364/OE.16.008016 Google Scholar
M. Kyrish et al.,
“Needle-based fluorescence endomicroscopy via structured illumination with a plastic, achromatic objective,”
J. Biomed. Opt., 18
(9), 096003
(2013). http://dx.doi.org/10.1117/1.JBO.18.9.096003 Google Scholar
F. Duffner et al.,
“Specific intensity imaging for glioblastoma and neural cell cultures with 5-aminolevulinic acid-derived protoporphyrin IX,”
J. Neurooncol., 71
(2), 107
–111
(2005). http://dx.doi.org/10.1007/s11060-004-9603-2 Google Scholar
L. D. Stefano and A. Bulgarelli,
“A simple and efficient connected components labeling algorithm,”
in Proc. Int. Conf. on Image Analysis and Processing,
322
–327
(1999). http://dx.doi.org/10.1109/ICIAP.1999.797615 Google Scholar
|


