
|
|
1.IntroductionNearly 10 million Americans suffer from peripheral arterial disease (PAD)1—a disorder that affects nearly 20% of individuals above the age of 602 and is the third leading cause of atherosclerotic cardiovascular morbidity.3 PAD is caused by the buildup of atherosclerotic plaque in the extremity arteries.4 This results in the chronic inadequate supply of oxygen and nutrients to the extremities, leading to advanced critical limb ischemia (CLI), nonhealing wounds, infection, and gangrene.5 After smoking, diabetes is the second most important risk factor for the development of PAD.3 PAD also begins earlier and progresses more rapidly in patients with diabetes.6 Furthermore, diabetic patients are more likely to suffer from complications related to progressive PAD and CLI, which can lead to increased risk of limb loss, and higher morbidity and mortality.7 Despite the high prevalence of CLI in the setting of diabetes, our understanding of the pathophysiology of this recalcitrant disease process is limited. Furthermore, it is currently unknown whether CLI manifestations in the setting of diabetes present with unique molecular, anatomic, or dynamic flow principles. Accordingly, recent investigations have attempted to characterize arterial perfusion in the setting of CLI. However, few tools are currently available to accomplish this goal in the clinical setting. Therefore, there is a profound need to develop an imaging system that can facilitate noninvasive evaluation of arterial perfusion in the lower extremities of individuals afflicted with CLI and diabetes. Here we present a custom multispectral camera for fluorescence-based near-infrared angiography (FBA). This high-resolution imaging system can detect in real-time and with high sensitivity the fluorophore signals emitted by the fluorescent dye indocyanine green (ICG), which is widely used in perfusion diagnostics. Our findings demonstrate that our low-cost, mobile, FBA imaging system can provide accurate, highly sensitive, dynamic assessments of arterial tissue perfusion in a murine diabetic model of CLI. These findings will provide the foundation for future translational bench-to-bedside human clinical trials that may show benefit from the use of this imaging platform. Our FBA imaging system is significantly more sensitive in evaluating peak tissue perfusion than conventional tissue-perfusion assessments using laser-scanning Doppler technology. Specifically, our FBA imaging system’s higher image resolution measures, with high accuracy, low levels of perfusion in the ischemic hind limbs of C57BL/6 mice of both phenotypes, diabetic or nondiabetic. Similarly, our FBA imaging system helps to detect subtle but potentially relevant differences in tissue perfusion at specific hind-limb regions in diabetic mice, a known clinical risk factor for CLI. In addition, unlike the gold-standard laser-scanning Doppler imager, our FBA imaging system can differentiate the distinctive phenotypes based on real-time dynamic perfusion inflow. Prior to the induction of ischemia, our study thus reveals dynamic perfusion variables (rate of inflow) that are useful for both laboratory-based studies and future translational bench-to-bedside human clinical trials. 2.Instrumentation and Methods2.1.Multispectral Camera for Fluorescence-Based Near-Infrared AngiographyTo acquire real-time near-infrared fluorescence (NIRF) data for optical blood perfusion angiography, a custom multispectral camera (RGB-NIR camera) was used. The camera, outlined in Fig. 1, consists of an array of CCD photodetectors with a total resolution of and a maximum frame rate of 40 fps. The CCD sensor has a dynamic range of 68 dB and a readout noise of with a maximum well capacity of . An array of pixel pitch-matched spectral filters is overlaid on top of the imager sensor for spectral (NIR and visible spectrum) sensitivity. The pixelated filter topology consists of a super pixel pattern repeated across the imaging array, where the individual pixelated filters are effectively interference filters optimized for sensing RGB and NIR () spectra. The spectral interference filters are achieved through a nanofabrication process, where multiple interleaved layers of materials with low and high dielectric constants are deposited on top of each other by physical vapor deposition. Because of an optimized nanofabrication process for realizing pixelated spectral filters, our filters have high transmission ratios () and high optical densities (), which are necessary for high fluorophore sensitivity. In addition to the pixelated layer, a notch filter (Semrock, NF03-785E-25), with an OD of at 780 nm, is added to the system to further suppress the fluorophore excitation light source from reaching the sensor. The compounded result of this architecture achieves a maximum ICG dye sensitivity of 10 nM under surgical light illumination (40 klux) with minimal spatial co-registration error among the spectral channels, i.e., color and NIR information. This leads to high blood flow detectability and co-registration of this information with the corresponding anatomic features. The camera is connected to a laptop via an ethernet cable to transmit 12-bits per pixel data at 40 fps. The laptop screen displays a color image, a fluorophore signal image in false color, and an overlaid version of both data frames through custom-developed software. Fig. 1Custom imaging setup used for optical blood perfusion angiography. The setup consists of the custom multispectral camera for FBA, a 780 nm laser and its optics, a visible-light LED panel, a laptop, and a heating pad for the animal to be placed. The laptop outputs a time vector for each of the six anatomic regions of interest. Points A and B in the inset denote the injection and first local maximum points, respectively. 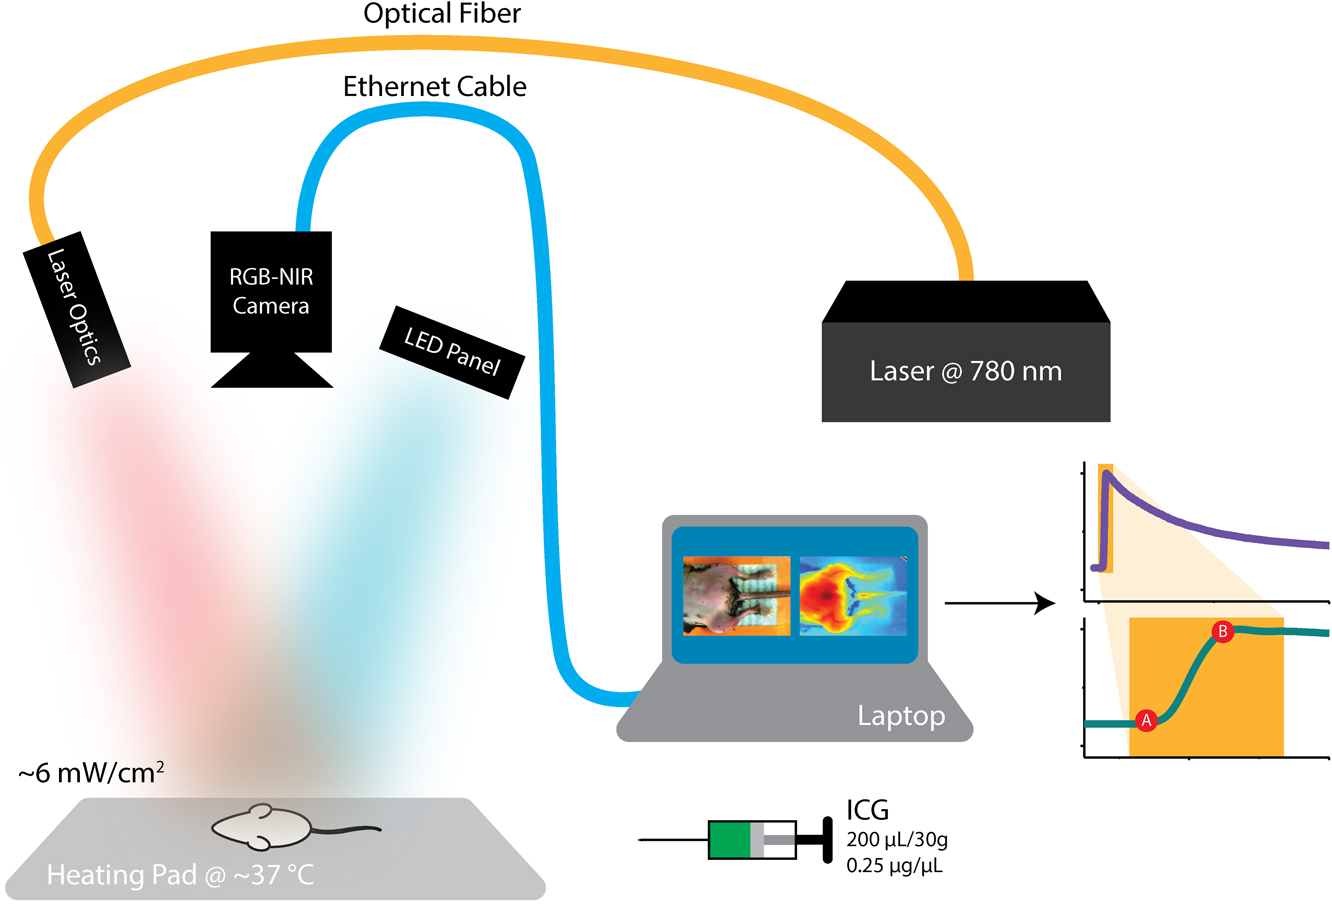 2.2.Imaging SetupThe imaging setup shown in Fig. 1 consists of the RGB-NIR camera, a laptop, a 780-nm laser (B&W TEK Inc., BWF2-780-0.8) and its optics, a visible-light LED panel (Genaray, LED-7100T), and a heating pad (Kaz, 7788-R). The laser is coupled to the custom laser optics through an optical fiber. The laser optics consist of a shaping line filter at 780 nm (Semrock, LL01-780-12.5), an aspheric condenser lens (Thorlabs, ACL25416U-B), and a diffuser (Edmund Optics, 47-994) to create a 10 cm uniform illumination pattern with of excitation power. The LED panel produces 5 klux of visible light at the surface of the heating pad with a light temperature of 5000 K. Visible short-pass filters (3M, Cool Mirror Film 330) are placed on top of the LED panel to suppress any leakage of NIR light that could deteriorate the fluorescence signal acquired by the RGB-NIR camera. The RGB-NIR camera sits orthogonally above the heating pad at a distance of , with the laser optics and the LED panel placed on each side of the camera (Fig. 1). The anesthetized mouse is placed at the center of the heating pad in the supine position, as shown in Fig. 1, while keeping the heating pad at a temperature of to ensure normal cardiovascular system behavior in the animal. 2.3.In Vivo Small Animal AngiographyAll animal studies were performed according to protocols approved by the Washington University School of Medicine Animal Studies Committee for humane care and use of laboratory animals. Optical blood perfusion angiography was performed on diabetic () and nondiabetic () mice. All mice underwent unilateral femoral artery ligation, and their arterial perfusion was assessed before and after ligation and through their recovery process (day 7 and day 14 postligation). The assessment was performed both with our FBA imaging system and with a laser-scanning Doppler imager for comparative reasons. The experimental approach comprised the three following steps. 2.3.1.Murine models for critical limb ischemia and diabetesOne month prior to experiments, a cohort of adult (8- to 10-week-old) wildtype mice on a C57BL/6 genetic background received a single intraperitoneal injection of streptozotocin (STZ) to induce a diabetes-like phenotype with a blood glucose of . These diabetic mice, as well as nondiabetic mice (control wildtype mice that did not receive STZ), underwent unilateral femoral artery ligation at a level distal to the epigastric vessel origin to induce a moderate form of hind-limb ischemia (an established model for human CLI). 2.3.2.Laser-scanning Doppler blood perfusion imager of murine critical limb ischemia modelsDiabetic and nondiabetic mice underwent serial arterial perfusion assessments of ischemic and nonischemic hind limbs at day 0 (preunilateral femoral artery ligation), day 1 (postligation), day 7, and day 14. Mice were anesthetized (using a ketamine/xylazine cocktail) and kept on an underbody warming pad set at , and hair was shaved from the distal abdominal and medial hind-limb regions. Each mouse underwent serial measurements using a high-resolution laser-scanning Doppler blood perfusion imager (Perimed, PeriScan PIM 3). Adductor, gastrocnemius, and hind-paw segments of ischemic and nonischemic hind limbs (Fig. 2) were analyzed by an independent investigator (who was blinded to murine cohort) using the manufacturer’s software (LDPIwin). Both mean and peak perfusion units for each anatomic region of interest were collected. Fig. 2Sample color image with outlines of the anatomic regions of interest. The image was taken on day 1, just after ligation. The left hind limb and right hind limb are labeled as ischemic (blue outline) and nonischemic (black outline), respectively. The hind limbs have been conceptually divided into three anatomic regions: gastrocnemius, adductor, and hind paw. 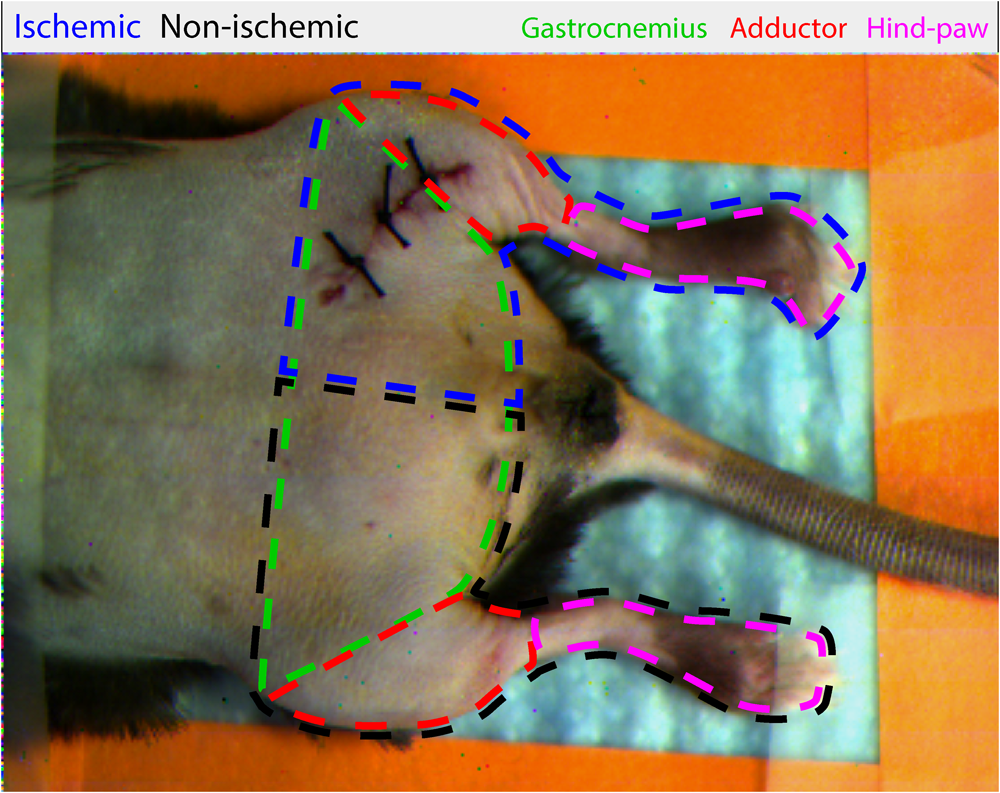 2.3.3.Fluorescence-based near-infrared angiography of murine critical limb ischemia modelsImmediately following each laser-scanning Doppler imager evaluation, all anesthetized mice also underwent dynamic perfusion assessment using our custom FBA imaging system for optical blood perfusion angiography. Through a unilateral retro-orbital infusion, mice received ICG adjusted to a volume-to-mass ratio of . Immediately upon ICG infusion, the fluorescence response of ICG was captured by our FBA imaging system with a laser excitation at 780 nm and fluorescence emission at 800 nm and above. Similar to previous assessments, an investigator blind to the murine diabetic status evaluated the perfusion variables using a custom-developed algorithm in MATLAB and C++. Variables collected included the rate of fluorescent signal inflow and peak fluorescent signal in ischemic and nonischemic hind limbs. To reduce anatomic variance and enhance consistency of the data perfusion variables, the hind-limb adductor, gastrocnemius, and hind-paw segments of ischemic and nonischemic hind limbs were compared. This division gives a total of six anatomic regions of interest per mouse, as shown in Fig. 2. 3.Data AnalysisVariables collected from laser-scanning Doppler imager and our custom multispectral FBA imaging system were then used to compare sensitivity between the two imaging modalities and to determine whether diabetes can influence perfusion dynamics in ischemic hind limbs. To evaluate this, a hind-limb perfusion ratio was derived by dividing the perfusion variables of the ischemic versus nonischemic hind limb for each anatomic region of interest.8,9 Each technology is capable of outputting spatially co-registered intensity and signal images, with the signal image proper to each architecture (Fig. 3). For the laser-scanning Doppler imager, the intensity image is monochromatic, while the signal image is the wavelength change (Doppler shift) of the imager’s laser and is caused by the movement of blood cells, which is directly correlated to the animal’s perfusion. For the RGB-NIR camera, the intensity image is a true color image of the area of interest, and the signal image is the NIRF light emitted by the fluorescent dye. This fluorescence magnitude is directly correlated to, among other factors, the dye concentration, dye volume, and plasma-bonded volume. Since in all mice, the dye concentration was kept constant and the volume was proportional to the animal’s weight, the blood volume bonded to ICG was the only main independent variable. This variable changes dynamically as the dye circulates through the vascular system. Fig. 3Samples of intensity and signal images extracted by each technology on day 0 of the experiments. The RGB-NIR camera’s intensity image is a true color image, and its signal image is the dye’s NIRF emitted light. The Doppler imager’s intensity image is monochromatic, and its signal image is the laser’s output, which signifies perfusion. Red, strong signal; blue, weak signal. 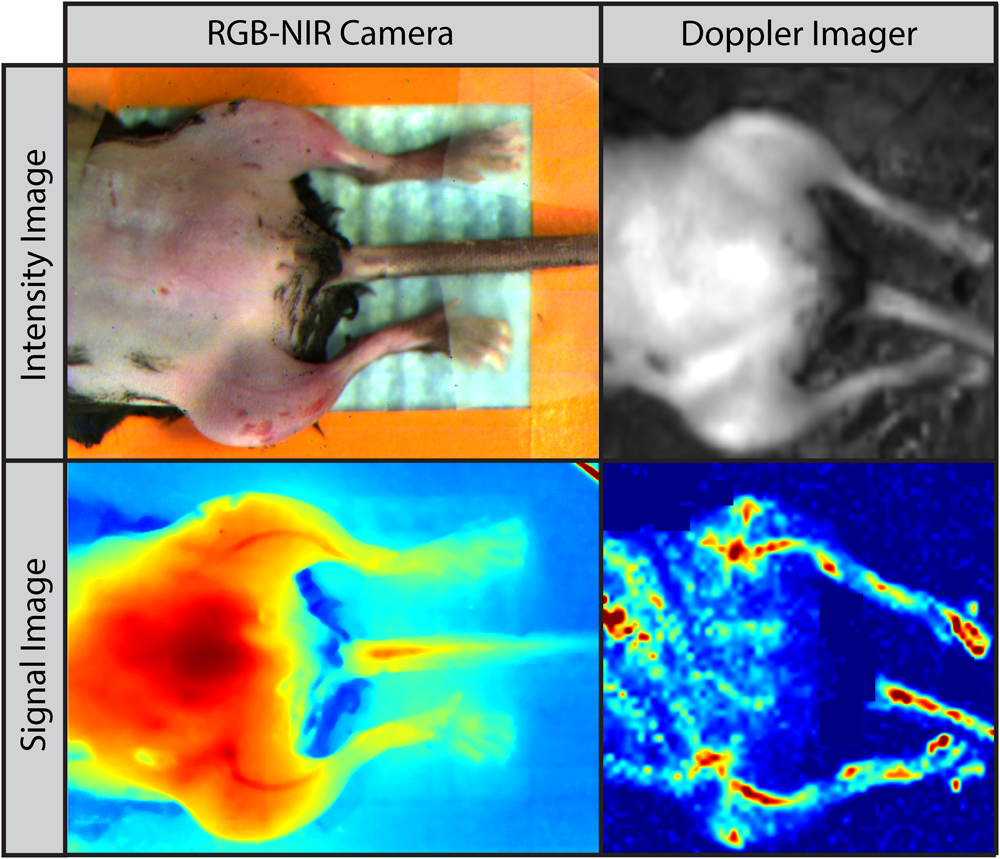 In Fig. 3, the signal image for each technology is depicted in false color, where red represents a strong signal, either high fluorescence or high perfusion, and blue represents a weak signal, either low fluorescence or low perfusion. Note the striking difference of the data refresh rates between these two technologies: the Doppler imager takes several seconds to scan an area of interest for a single snapshot, while the RGB-NIR camera acquires 40 full-resolution data frames every second. This technology limitation of the Doppler imager prevents its use to assess dynamic arterial perfusion, necessary to study microvascular complications in patients with diabetes mellitus. To extract the input hind-limb perfusion metrics for the Doppler imager, the manufacturer’s software was operated by a trained technician. Each anesthetized and shaved animal () was placed on the Doppler imager’s imaging area in the supine position. The Doppler imager performed a scan for each mouse. Using built-in software functions, the technician marked the six anatomic regions of interest per each mouse and then extracted the mean perfusion value per area for a total of six perfusion metrics per mouse per experimental day, three for the ischemic hind limb, and three for the nonischemic hind limb. For optical blood perfusion angiography utilizing the RGB-NIR camera, the setup depicted in Fig. 1 was utilized. The mice were imaged for several minutes while successfully capturing the injection point and the input and output perfusion variables. We focused on the input perfusion variable since it is expected to be the most consistent between mouse groups and would capture whether arterial inflow is altered in the setting of diabetes. The inflow variable commonly lasts only a few seconds. For the RGB-NIR camera, a trained technician used custom-developed software to draw the six areas of interest on each of the animals. The software then extracted the raw pixel-data that constitute each of the areas on each frame. These pixel-data were averaged, taking out 20% of the outliers, and passed through a low-pass filter to reduce high-frequency noise. Figure 4 shows the six normalized angiography vectors over time acquired with the RGB-NIR camera from a nondiabetic and a diabetic mouse on day 0 (before ligation), day 1 (after ligation), and day 7 (during recovery). Figure 4 also shows three fluorescence snapshots on each of the three experimental days at the injection point, halfway between the injection point, and the first local maximum point. Of note, each data point on this vector is directly correlated to the accumulation of ICG in the blood but not necessarily to its flow. To extract a blood perfusion metric, the fluorescence gradient on each of the six vectors was computed. As shown in Fig. 1, points A and B on the inset denote the injection and first local maximum points, respectively, on a sample fluorescence plot. Using these two points, a fluorescence gradient was computed for each of the six time vectors, giving a total of six perfusion metrics per mouse per experimental day that are homologous to those extracted by the Doppler imager. Since the rate of ICG accumulation in the blood is calculated, rather than its momentary signal emission, this metric is more closely related to blood flow than the single-frame data points. This numerical approach has the additional advantage of suppressing any signal baselines caused by imperfections of the optics or nonuniformities on the excitation light source distribution. Fig. 4Representative plots of the six angiography vectors extracted with the RGB-NIR camera, corresponding to the six anatomic regions of interest, on day 0 (before ligation), day 1 (right after ligation), and day 7 (1 week after ligation) for (a) a nondiabetic mouse and (b) a diabetic mouse. Multimedia files are available for the diabetic mouse on day 0 (Video 1; MPEG, 5.3 MB [URL: http://dx.doi.org/10.1117/1.JBO.22.4.046006.1]). and day 1 (Video 2; MPEG, 8.3 MB [URL: http://dx.doi.org/10.1117/1.JBO.22.4.046006.2]). 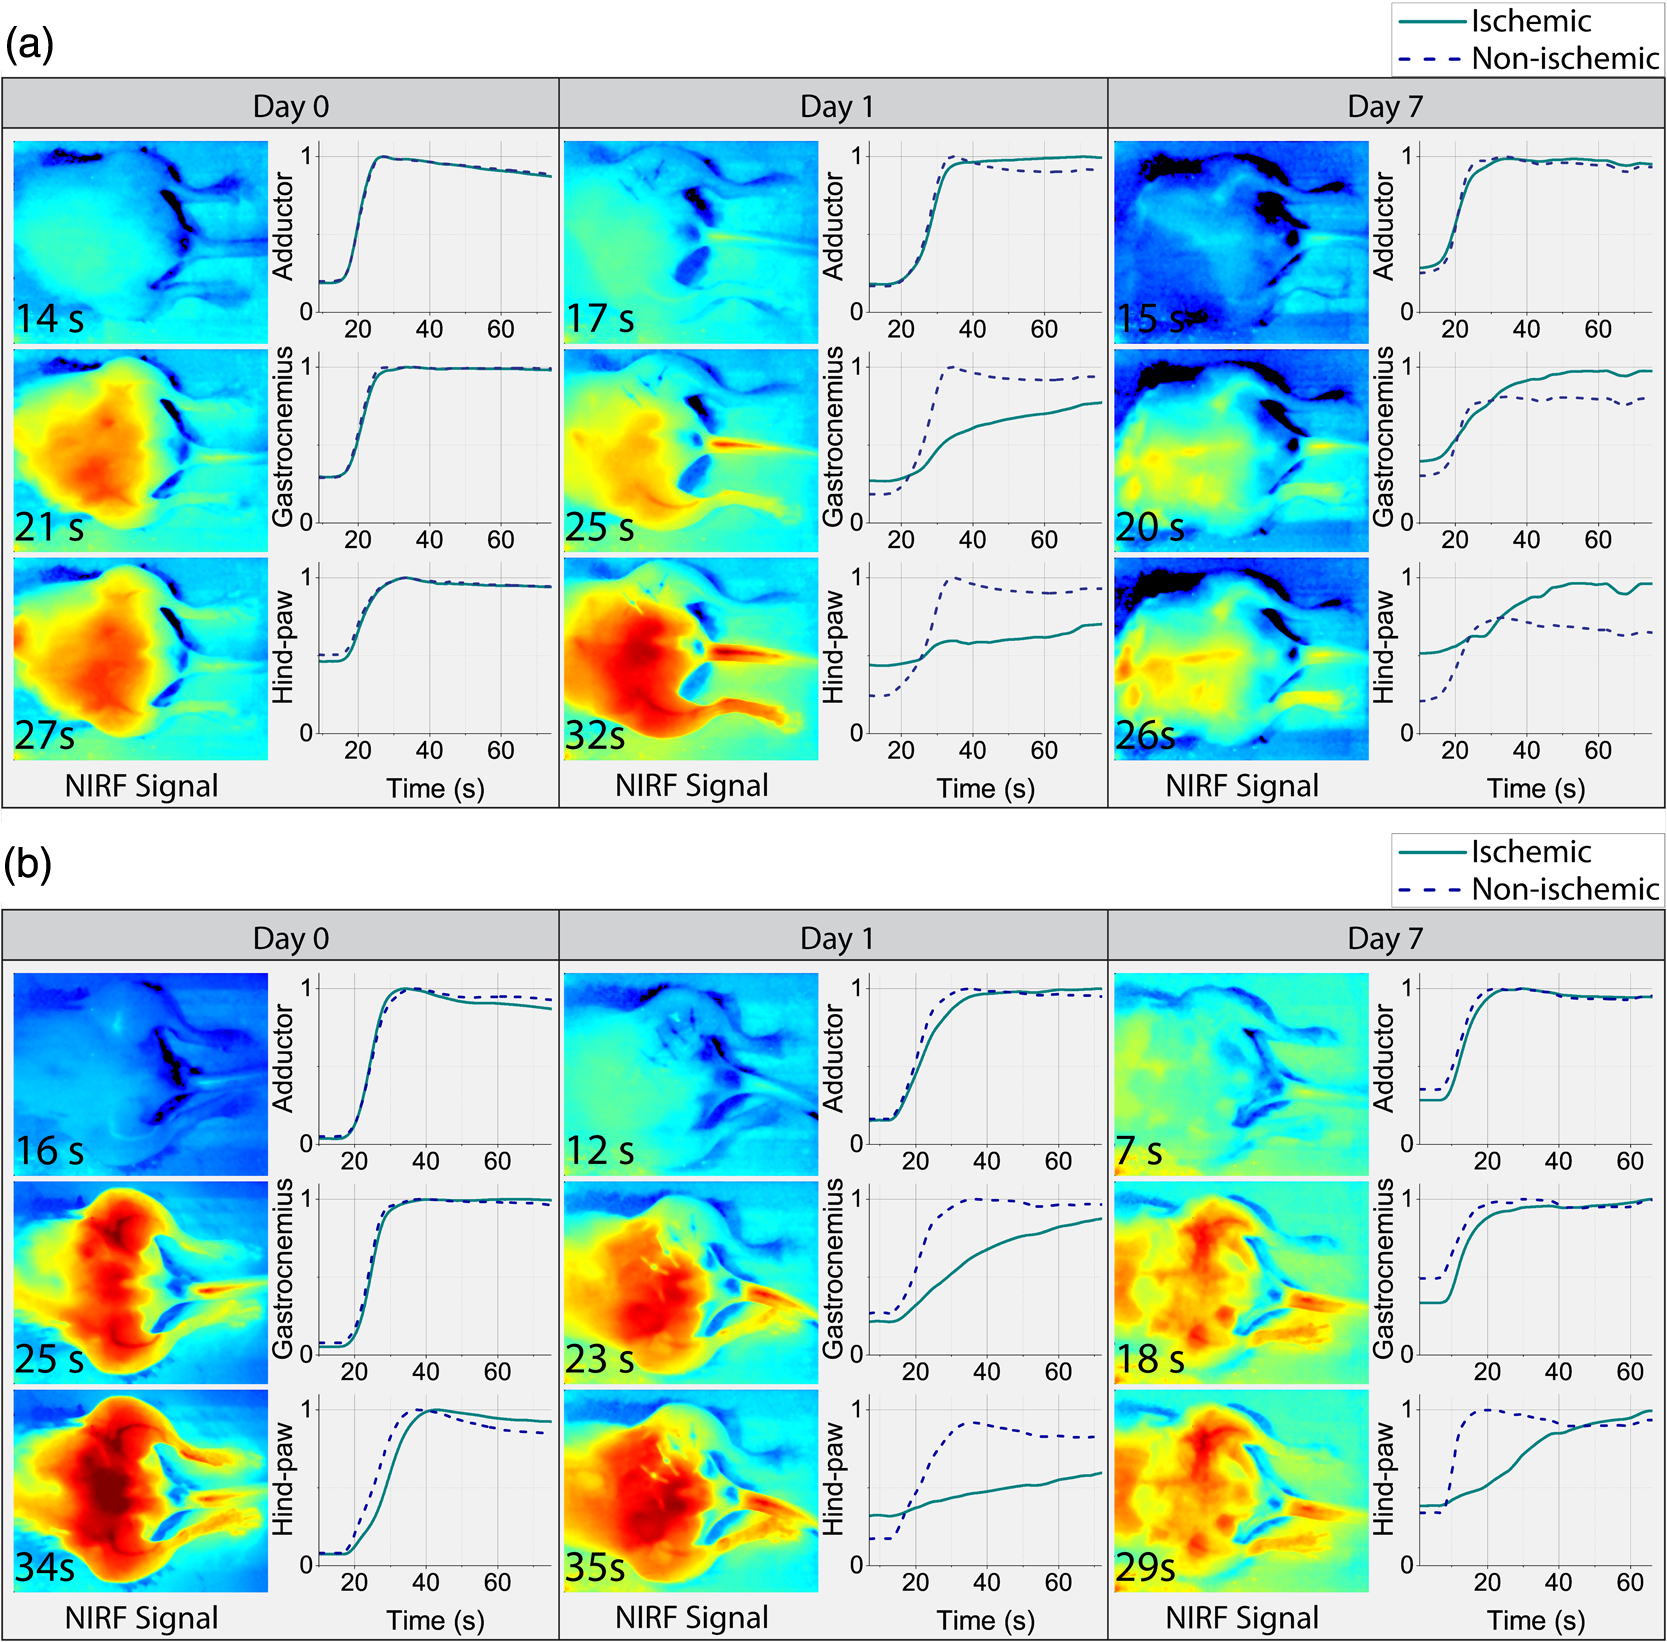 Once the six perfusion metrics were extracted for each technology, the hind-limb perfusion ratios were computed by dividing the anatomic regions of the nonischemic hind limb by the corresponding regions of the ischemic hind limb. These perfusion ratios are the basis of our comparative analysis for these experimental trials. 4.Results and Discussion4.1.Distal Arterial Perfusion During the Ischemic Recovery ProcessHere, we summarize the differences between the gold-standard scanning laser Doppler technology and our FBA imaging system in evaluating hind-limb perfusion recovery in the setting of ischemia and diabetes. We present each technology’s ability to track the recovery process of each phenotype group, as well as data supporting our hypothesis that our FBA system reveals distinct differences in distal arterial perfusion during the recovery process of diabetic mice. The hind-limb perfusion ratios should be minimal immediately following unilateral femoral artery ligation since the ischemic vascular system has been seriously compromised. As time progresses, the ischemic hind limb should progressively recover arterial inflow and distal perfusion. This process is assumed to be impaired in the setting of diabetes. To assess the recovery process, we have clustered the mice by diabetic status and experimental day. Table 1 shows the geometric centroids, equivalent to the cluster-member means, of each anatomic hind-limb perfusion ratio (adductor, gastrocnemius, and hind-paw) at day 0 before ligation, day 1 right after ligation, and days 7 and 14 after recovery for the RGB-NIR camera and the Doppler imager. Both technologies report maximum and minimum hind-limb perfusion ratios on day 0 and day 1, respectively, for all three anatomic regions. To more systematically evaluate the recovery process, we have computed the geometric distances between the centroids for days 1, 7, and 14 and the initial vascular-unaltered centroid for day 0. As expected, the geometric distance for both phenotype groups and for both technologies is greatest on day 1, when ischemic hind-limb perfusion is most compromised. Both technologies show that this geometric distance decreases with time in both phenotypes, confirming that both diabetic and nondiabetic mice are recovering from the induced ischemia. Interestingly, both technologies very similarly demonstrate that hind-limb perfusion on day 1 is more compromised in diabetic mice. These findings, combined with the results from the RGB-NIR camera on day 7 (described below), provide strong evidence that diabetic mice recover more slowly than their nondiabetic counterparts. Finally, the RGB-NIR camera detects a slower recovery, based on the geometric centroid distance, in both diabetic and nondiabetic mice on days 7 and 14 compared to the Doppler imager, possibly indicating that our FBA imaging system is additionally providing microvascular perfusion data that the Doppler imager is less sensitive to. Table 1RGB-NIR camera and Doppler imager centroid coordinates and recovery distances.
Note: Data are geometric centroids of adductor, gastrocnemius, and hind-paw perfusion ratios and geometric distances between the centroids from day 0 (D0; before ligation) and those on days 1, 7, and 14. A more comprehensive view of these distributions is shown in Fig. 5, which offers a three-dimensional visualization of the perfusion ratio data for each phenotype for the RGB-NIR camera and Doppler imager. Figure 5 also shows the centroid locations for each experimental day cluster and their projections to the coordinate planes. These projections visually show how each of the three perfusion ratios agree with the findings in Table 1. Figure 5 also shows the two-dimensional profiles of gastrocnemius versus adductor and hind paw versus adductor. On both profiles, the cluster distribution trend can be appreciated for both phenotypes and for both technologies: day 0 data points cluster at the top right of the profile or coordinate plane, indicating high perfusion ratios; day 1 data points cluster at the bottom left, indicating low perfusion ratios; and day 7 and 14 data points gravitate toward day 0 with those on day 14 being the closest. Fig. 5Data plotted for RGB-NIR camera: (a) Doppler imager (b) for diabetic versus nondiabetic mice: 3-D visualization of the hind-limb perfusion ratios for each mouse with their respective cluster centroids and projections to the coordinate planes (left column) and 2-D profiles for gastrocnemius versus adductor (middle column) and hind paw versus adductor (right column).  4.2.Dynamic Arterial Perfusion Variables Distinguish Diabetic from Nondiabetic Mice Prior to LigationWe hypothesized that the subtle differences caused by the diabetic status on hind-limb perfusion should be sufficient to successfully distinguish diabetic mice from nondiabetic mice before induction of the CLI mode, and indeed, based on the dynamic arterial perfusion variables, we could identify the distinctive phenotypes. Based on the fact that diabetes causes microvascular complications, we hypothesized specifically that ICG propagation through the cardiovascular system would have different dynamics in different phenotypes as it approaches the hind-limb extremities. We support and frame this hypothesis with reference to the chemical properties of ICG and plasma: (a) ICG is known to bind to plasma and this binding is strongly dependent on the albumin protein content10 and (b) the albumin content in plasma is altered greatly in diabetic patients.11 To evaluate our hypothesis, we assessed each mouse hind limb () separately, using the initial perfusion metrics on day 0 (three measures per hind-limb), before ischemia was introduced to the model. To frame these metrics in our hypothesis, the analysis scheme divides the hind-limb perfusion metrics by those of the hind paw, the most distal anatomic region. Figure 6 shows the clear cluster separation between the two phenotypes for the RGB-NIR camera, in contrast to the Doppler imager results, and the ability to draw a decision boundary between the two phenotype clusters computed with a support vector machine. The nondiabetic data points tend toward the top right section of the plot, while the diabetic ones tend in the opposite direction. This data separation does not appear with the data acquired from the Doppler imager. Fig. 6Phenotype clustering for the (a) RGB-NIR camera and (b) the Doppler imager. Unlike data from the Doppler imager, the RGB-NIR camera data allow a clear decision boundary to be drawn between the two phenotype clusters. Day 0 mice hind limbs, diabetic, 14 nondiabetic.  We attribute this difference, first, to the superior resolution and sensitivity of our FBA imaging system and its ability to capture dynamic perfusion variables in real time, and second, to the inherent architectural disparity coming from the different physical phenomena captured. The Doppler imager relies on measuring, for one point in space at a time, the backscattering of light caused by red blood cells. This measurement can suffer from heterogeneities, where the blood perfusion measurement can be affected by spatial variations and optical properties of the tissue.12–14 This effect indicates that the perfusion signal can be compromised if the measurement site is changed, jeopardizing analysis of blood perfusion changes over time. The RGB-NIR camera, in contrast, measures the dye’s emitted fluorescence in an anatomic area of interest at a single point in time. This fluorescence is correlated not only to the blood volume and hence its perfusion but also to its chemistry, providing valuable knowledge about arterial perfusion angiography. 5.ConclusionPAD is a serious health problem for Americans, with life-threatening consequences. PAD can evolve into CLI in the setting of diabetes, causing the patient to undergo arterial surgery or amputation. Current technology is greatly limited in noninvasively evaluating peripheral arterial perfusion in the setting of CLI and diabetes. An imaging system that can provide real-time assessments of arterial hind-limb perfusion would greatly improve our ability to evaluate the pathophysiology of the disease process, which may translate into better management and treatment strategies. Here, we present our custom multispectral FBA imaging system for angiography. Our RGB-NIR camera system can track the ischemic recovery of diabetic and nondiabetic mice in a CLI model, involving arterial ligation more accurately than the gold-standard laser-scanning Doppler imager. Our system can also identify differences between diabetic and nondiabetic murine cohorts prior to arterial ligation (i.e., day 0 mice of the experiment), based on dynamic perfusion parameters that are not detectable with laser-scanning Doppler imaging. The greater accuracy and expanded capability system offers will be useful for both laboratory-based studies and future translational bench-to-bedside human clinical trials. AcknowledgmentsThis work was partly founded by the following grants from the National Science Foundation: OCE under Grant Nos. 1636028 and 1603933. The authors would like to thank James Hutchinson and Patricia J. Watson for manuscript editing. ReferencesA. S. Go et al.,
“Heart disease and stroke statistics-2014 update,”
Circulation, 129
(3), 256
–257
(2014). http://dx.doi.org/10.1161/01.cir.0000442015.53336.12 CIRCAZ 0009-7322 Google Scholar
E. Rapsomaniki et al.,
“Blood pressure and incidence of twelve cardiovascular diseases: lifetime risks, healthy life-years lost, and age-specific associations in 1.25 million people,”
Lancet, 383
(9932), 1899
–1911
(2014). http://dx.doi.org/10.1016/S0140-6736(14)60685-1 LANCAO 0140-6736 Google Scholar
F. G. R. Fowkes et al.,
“Comparison of global estimates of prevalence and risk factors for peripheral artery disease in 2000 and 2010: a systematic review and analysis,”
Lancet, 382
(9901), 1329
–1340
(2013). http://dx.doi.org/10.1016/S0140-6736(13)61249-0 LANCAO 0140-6736 Google Scholar
P. M. Ridker, M. J. Stampfer and N. Rifai,
“Novel risk factors for systemic atherosclerosis: a comparison of C-reactive protein, fibrinogen, homocysteine, lipoprotein (a), and standard cholesterol screening as predictors of peripheral arterial disease,”
J. Am. Med. Assoc., 285
(19), 2481
–2485
(2001). http://dx.doi.org/10.1001/jama.285.19.2481 JAMAAP 0098-7484 Google Scholar
L. Norgren et al.,
“Inter-society consensus for the management of peripheral arterial disease (TASC II),”
Eur. J. Vasc. Endovasc. Surg., 33
(1), S1
–S75
(2007). http://dx.doi.org/10.1016/j.ejvs.2006.09.024 Google Scholar
E. Jude, I. Eleftheriadou and N. Tentolouris,
“Peripheral arterial disease in diabetes—a review,”
Diabetic Med., 27
(1), 4
–14
(2010). http://dx.doi.org/10.1111/j.1464-5491.2009.02866.x DIMEEV 1464-5491 Google Scholar
E. B. Jude et al.,
“Peripheral arterial disease in diabetic and nondiabetic patients: a comparison of severity and outcome,”
Diabetes Care, 24
(8), 1433
–1437
(2001). http://dx.doi.org/10.2337/diacare.24.8.1433 DICAD2 0149-5992 Google Scholar
H. Niiyama et al.,
“Murine model of hind-limb ischemia,”
J. Visualized Exp., 23 e1035
–e1035
(2009). Google Scholar
A. Limbourg et al.,
“Evaluation of postnatal arteriogenesis and angiogenesis in a mouse model of hind-limb ischemia,”
Nat. Protoc., 4
(12), 1737
–1748
(2009). http://dx.doi.org/10.1038/nprot.2009.185 1754-2189 Google Scholar
G. R. Cherrick et al.,
“Indocyanine green: observations on its physical properties, plasma decay, and hepatic extraction,”
J. Clin. Invest., 39
(4), 592
–600
(1960). http://dx.doi.org/10.1172/JCI104072 Google Scholar
K. Oettl and R. Stauber,
“Physiological and pathological changes in the redox state of human serum albumin critically influence its binding properties,”
Br. J. Pharmacol., 151
(5), 580
–590
(2007). http://dx.doi.org/10.1038/sj.bjp.0707251 BJPCBM 0007-1188 Google Scholar
K. Wardell et al.,
“Spatial heterogeneity in normal skin perfusion recorded with laser Doppler imaging and flowmetry,”
Microvasc. Res., 48
(1), 26
–38
(1994). http://dx.doi.org/10.1006/mvre.1994.1036 MIVRA6 0026-2862 Google Scholar
T. Tenland et al.,
“Spatial and temporal variations in human skin blood flow,”
Int. J. Microcirc. Clin. Exp./Eur. Soc. Microcirc., 2
(2), 81
–90
(1982). Google Scholar
I. Fredriksson, C. Fors and J. Johansson, Laser Doppler Flowmetry—A Theoretical Framework, 6
–7 Department of Biomedical Engineering, Linköping University, Linköping, Sweden
(2007). Google Scholar
BiographyMissael Garcia is a PhD candidate in computer engineering at Washington University in St. Louis. He received his MS degree in electrical engineering from SIUE in 2013 and his BS degree in mechatronics engineering from ITESM in 2012. His research interests include near-infrared fluorescence imaging, polarization sensors, and their applications, especially in the field of biomedical imaging. Mohamed A. Zayed earned his MD and PhD degrees, and now he is an assistant professor of surgery at Washington University School of Medicine and a staff physician in the Veterans Affairs St. Louis Health Care System. He is a board certified vascular surgeon and currently practices general vascular surgery with a focus on peripheral arterial occlusive disease. His NIH/NHLBI-funded research laboratory investigates mechanisms of peripheral arterial atheroprogression and plaque lipidomics in the setting of diabetes. Kyoung-mi Park earned her master of science in biology from Yonsei University, South Korea. She is currently a research scientist in Dr. Mohamed Zayed’s Laboratory at Washington University School of Medicine, Department of Surgery. Her research focus is on evaluating endothelial function and plaque lipidomics in the setting of peripheral arterial disease and diabetes. She is an expertise in murine in vivo modeling and imaging, tissue immunohistochemistry, as well as arterial tissue biochemistry. Viktor Gruev is an associate professor in the Department of Electrical and Computer Engineering at University of Illinois at Urbana Champaign. He completed his MS and PhD degrees in electrical engineering from Johns Hopkins University in 2000 and 2004, respectively. He is the recipient of the 2016 Donald Fink award for the best paper published in any IEEE Transactions. His current research focuses on developing bioinspired sensory technology to address the medical needs in resources limited hospitals. |
||||||||||||||||||||||||||||||||||||||||||||||||||||||||||||


