
|
|
1.IntroductionA ligament is a band of soft fibrous tissue that connects bone to bone. Its primary role is to passively control joint motion in response to muscle forces while transmitting mechanical load between bones.1–3 Routine daily activities apply repetitive and sustained loads up to 25% of the maximum strength of knee ligaments,4,5 and excessive external force such as car accidents or sports activities can reach up to four times of the daily applied load.4 This can lead to ligament damage and injury,6 which is most common in knee injuries in the United Kingdom7 and has consistently been increasing among young athletes during the past two decades in the United States.8 Therefore, studying the mechanical properties of ligaments is crucial for developing effective injury prevention strategies and for providing improved surgical treatment. One of the main factors that affects the nonlinear mechanical and viscoelastic properties of ligaments is the structural architecture.9–13 The collagen fiber arrangement, the primary load-bearing component in ligaments, has a structural hierarchy.14–17 From small to large, collagen molecules aggregate to form microfibrils, which in turn form subfibrils, then fibrils, fibers, fascicles, and eventually gross ligament. Approximately 90% of the collagen content in a ligament comprises type I collagen, which is less than what is found in a tendon.3,18 The collagen fibers are known to have complex wavy undulation crimp patterns.19,20 Since crimping strongly affects the nonlinear mechanical response of a ligament,21–24 it is essential to use appropriate imaging techniques to examine the crimp pattern. There have been numerous studies using polarized light (PL) microscopy to image the crimp patterns in ligaments.25–29 PL microscopy captures the birefringence of the sample by sandwiching the sample between a pair of crossed polarizers, and the birefringence intensity becomes maximum when the crossed polarizers are 45 deg with respect to the fiber.30 Occasionally, red first-order compensators are applied to show interference colors indicating fiber orientation, and the variation is observed while rotating the polarizer.30–32 Under the PL microscope, crimped collagen fibers appear to have extinction bands. Combined with tensile tests, researchers have extracted parameters such as crimp angle and fiber orientation under different loading conditions.27,28,33 Scanning and transmission electron microscopies have been utilized to observe helical patterns in ligaments, which refers to fiber undulation in different planes.34–36 This helical fashion is also called “fibrillar crimp.”37,38 Furthermore, the regional difference between the periphery (anterior, posterior) and core portions within ligaments has been analyzed using metrics such as the number of crimps, fibril diameter, and fiber arrangement.38,39 However, these approaches have low-axial resolution and require relatively invasive sample preparation stages including fixation, dehydration, and coating with gold.40,41 In contrast, quantitative second-harmonic generation (SHG) microscopy can provide three-dimensional (3-D) quantitative analysis of type I collagen fiber organization and needs minimum sample preparation. Previous studies have used SHG imaging on ligaments to measure parameters such as fiber density and orientation and have correlated them to the computed mechanical properties to evaluate the effects of smoking,42 laser damage,43 and chemicals.44 SHG is a second-order nonlinear optical process where the signal generated by the sample is at half the wavelength of the incident optical (excitation) field.45,46 As a microscopy technique, SHG offers high-intrinsic contrast, submicron spatial resolution, and 3-D optical sectioning.47 Collagen type I, being intrinsically noncentrosymmetric, is highly specific to SHG46,47 and provides an excellent opportunity for 3-D imaging of ligaments. Our group has previously shown that SHG combined with spatial Fourier transform (FT) analysis, FT-SHG, is a simple and powerful tool for analyzing collagen fiber organization in tendon,48 bone,49 and breast tissue.50 Moreover, we have shown how to extend quantitative SHG to analyze 3-D collagen fiber organization.51,52 In this paper, we apply FT-SHG to analysis of the 3-D collagen fiber spatial arrangement in the posterior cruciate ligament (PCL). While Vidal and Mello32,53 have previously utilized FT analysis on tendons to detect crimp pattern variability, to the best of our knowledge, the work in this study is the first approach to adopt FT-SHG to analyze 3-D crimp organization in ligament tissue. We believe that our crimp pattern analysis could act as a bridge, providing additional information in biomechanical studies that aim to predict damage or injury in the PCL. 2.Method2.1.Sample PreparationFive porcine knee PCL specimens (of age six months) are cut into thirds along the proximal-distal ligament direction and embedded in an optimal cutting temperature compound (Fig. 1). The middle region between the proximal and distal portions is sectioned at thickness by a cryostat (Leica, CM3050S). The thin sections are collected from between the anterior–posterior regions, thereby neglecting the sheath. The tissue sections are then placed on glass microscope slides and #1.5 coverslips are mounted on top with the aqueous mounting media. Tweezers are used to gently lower the coverslip on the microscope slide to avoid creating any air bubbles. After the samples dry, nail polish is applied on the corners to seal the samples. All ligaments are collected from the Meat Science Laboratory of the University of Illinois at Urbana-Champaign. This study is exempt from the Illinois Institutional Animal Care and Use Committee (IACUC). 2.2.Experimental SetupSelected fibrous regions are imaged by SHG microscopy. A tunable Ti:Sapphire laser producing 100-fs duration pulses spectrally centered at 780 nm illuminates the sample. The input beam is focused on the sample by a 0.65 NA objective lens (Olympus, PLAN N), and the backward SHG signal is collected by the same objective. A 390-nm bandpass filter separates the SHG signal from any generated autofluorescence. The beam is raster scanned by an galvanometer scanner at , and the epi-directed-SHG signal is collected by a photomultiplier tube (Hamamatsu, H10721-110). The focus drive attached on the microscope (Olympus, IX81) moves in a step size of 500 nm along the -axis, shifting the focus plane to generate the 3-D stack, and for any single plane four images are tiled together to form a wider area. The size of the obtained SHG 3-D image stacks are in the dimension. The average power of the laser on the sample plane is . A more detailed description of the SHG microscopy setup can be found elsewhere.54 2.3.Image AnalysisThe obtained SHG images are analyzed using a customized MATLAB code to label the crimp patterns in each region (Fig. 2). The type discerning algorithm initially calculates the percentage of the dark pixels in the entire image. Those possessing a lower intensity than the dark threshold are identified as dark pixels, and the dark threshold is a single value applied on the entire image, which segments the background to the SHG signal.41 If the number of dark pixels in the image is less than 10%, the image is assigned as category A (CAT A) or category B (CAT B); conversely, when the number of dark pixels comprises more than 10% of the region, the image is identified as category C (CAT C). Next, spatial FT analysis is carried out on the image, generating a spatial-frequency domain image, and the corresponding two-dimensional magnitude spectrum is integrated radially from 0 deg to 360 deg with a step size of 1 deg. Radial integration values lower than 30% of the maximum value are removed, while those above this threshold are plotted in a polar angular plot for each angle. If the plotted curve fits strongly with a wrapped Gaussian distribution55,56 (), it is defined as CAT A. When the correlation is weak (), then it is defined as CAT B. For CAT C, the identical radial integration process is applied. In the range of 0 deg to 180 deg, the polar plot with two distinct peaks is further classified as CAT C-2, whereas a single peak plot is CAT C-1. The two peaks can be verified by fitting a wrapped two-term Gaussian distribution and observing the distance of the two means of each peak. The difference of means for CAT C-1 is narrower than 35 deg and wider than 70 deg for CAT C-2. This classification process is applied to all SHG images in the stack. Once the images have a clear tendency toward one type of crimping throughout the whole stack, the entire region is assigned that type. A polar plot that represents the volume can be generated by adding all the data points from each slice. Fig. 2Flowchart of image analysis for differentiating crimp types. Initially, the pixels having a lower intensity than the dark threshold are counted and are used to separate CAT A, B from CAT C. FT analysis is applied followed by radial integration to identify CAT A, B, C-1, and C-2. See text for details.  To look at the effect of helicity, the crimp angle is obtained by measuring the fiber orientation differences of the two neighboring SHG bands in CAT C-2 images. Initially, each bright band is isolated, and then FT analysis is applied to the isolated images to calculate the orientation. The same process is implemented on each band, and the corresponding angle is computed. 3.Results and DiscussionBased on observation, the SHG images are categorized as CAT A, B, or C as shown in Fig. 3. CAT A is characterized as samples with little or no observed crimps in the fibers. Crimps that are confined in-plane are defined as CAT B. Crimps that are out-of-plane, along the third spatial dimension, are defined as CAT C. We consider the fibrous features on the SHG images as “fibers” due to the diameter coinciding with previous studies,19 and the probability of each crimp type to be detected in the fibrous regions of the PCL is comparable. We note that conventional sample preparation stages such as dissection and cutting into slices could alter the original, natural fiber structure of ligament. However, structure analysis performed on ex vivo condition is a common methodology conducted by many researchers that has been shown to be of value.25,28,37,38,43 The primary focus of this study is to employ SHG imaging to quantify collagen fiber crimping of ligament under ex vivo conditions. Fig. 3Three types of collagen fiber structure in the PCL. CAT A has almost no waviness of fibers (crimps) and the majority of them are in a single orientation. CAT B has in-plane crimps spreading the range of possible fiber orientations. CAT C has repeating dark and bright bands perpendicular to the fiber direction illustrating crimps out-of-plane. The scale bar is .  Figure 4 shows the results of our FT-SHG analysis on representative crimp patterns for CAT A, B, and C. In Fig. 4(a), we observe the typical SHG images for each type. We confirm that CAT A visually appears to have little to no crimps, whereas CAT B shows an in-plane crimp pattern. We observe in Fig. 4(a) that CAT C images also have crimp patterns but with significantly more dark SHG areas compared to CAT A and B. The dark areas are generated because of the out-of-plane crimps. This is due to the SHG intensity reducing once the fibers go out of the image plane and the signal dropping significantly when the fibers are perpendicular with the image plane.47,57 For further analysis, CAT C is divided into C-1 and C-2, which exhibit irregular and regular crimp patterns, respectively. Fig. 4Representative (a) SHG images and the corresponding (b) FT images for each crimp type (CAT A, B, C-1, C-2). The insets represent a magnified view of low spatial-frequency components (center pixels in the black box). These images are integrated radially across different angles and (c) the resulting integrated values (blue) are plotted in a polar plot format. CAT A and B are fitted with a wrapped Gaussian distribution (red), and the correlation coefficient is calculated. CAT C-1 and C-2 are fitted with a two-term wrapped Gaussian distribution (red), and the number of peaks is detected by measuring the distance between the means of the two peaks. For visualization purposes, the FT images are converted to log scale. The scale bar is .  The corresponding spatial-frequency maps (on a log scale) for the aforementioned crimp patterns are shown in Fig. 4(b), where the insets highlight the low spatial-frequency components in the center of the spectrum. For CAT A and CAT B, the dominant preferred fiber orientations observed in Fig. 4(a) images are readily picked up in the spectral data. In the case of CAT C-1, we observe more spatial isotropy regarding collagen fiber preferred orientation and crimp direction. However, the spatial-frequency patterns for CAT C-2 reveal the preferred orientation of the collagen fibers (similar to the cases of CAT A and CAT B), as well as the approximately orthogonal dark bands observed in the CAT C-2 SHG image. The low spatial-frequency components in CAT C-2 are affected by the dark bands. Figure 4(c) shows the radial integration polar plots, which are the sum of the radial integration (obtained from the spatial-frequency data) from each slice within the volume of images per crimp category. Note that the actual summed intensities for the stack, which would typically be labeled along the radius of the plots, are not shown in Fig. 4(c). The straight fibers in CAT A are characteristic of a single orientation, which corresponds to a wrapped Gaussian distribution55,56 in the polar plot (red curve) with . The majority of fibers in CAT A are oriented along [observed in Fig. 4(a)] as confirmed by the peak of the corresponding plot in Fig. 4(c) being marginally over 90 deg. Conversely, fibers in CAT B are curled in-plane. In this case, the in-plane crimping results in neighboring angles being added to the primary fiber orientation and resulting in a broader peak in the polar plot. It can be observed that the radial integration distribution regarding CAT B deviates from a wrapped Gaussian distribution and has a lower correlation coefficient with . In the case of CAT C, the circular plot from 0 deg to 180 deg has two peaks for CAT C-2. One of the peaks represents the orientation of the fibers in the CAT C-2 SHG image, which is along . The other peak results from the direction of the regular out-of-plane crimp pattern and appears almost orthogonal from the fiber orientation. This distance between the peaks is calculated by fitting a wrapped two-term Gaussian distribution and measuring the difference between the means of each term. In terms of CAT C-1, the out-of-plane crimps are not clear enough to appear as a peak on the circular plot, so there is usually one single broad peak. The irregularity of the dark bands in CAT C-1 could be caused by the disorder of the crimps37,58 and an oblique cut from a regular crimp pattern. The samples are also imaged by conventional imaging techniques such as bright-field [Fig. 5(a)] and PL microscopy [Fig. 5(b)]. The low contrast in Fig. 5(a) results from the unstained biological samples having inherently little contrast.59 These instruments are described elsewhere in more detail54 and are used for the purpose of mapping and selecting areas for subsequent SHG imaging. Due to the tissue size (), images are stitched to generate images with larger fields-of-view. By observing the bright-field images, we choose three fibrous regions per sample and obtain SHG images on the selected regions. As shown in Fig. 5(c), SHG microscopy illustrates the collagen fiber structure variation along the depth (-plane) and the corresponding assigned type. This structure variation also differs by region. For example, in Fig. 5(d), region 2 seems to have irregular out-of-plane crimps on slice 1 (CAT C-1), but below the plane the pattern appears to be more organized and is categorized as type CAT C-2. below slice 1, the out-of-plane crimps disappear, and the image is assigned to CAT B. Other regions have less feature variance, and the assigned type does not change along the -axis. Fig. 5Images of the entire ligament sample using (a) bright-field and (b) PL microscopy (in yellow pseudocolor). Selected fibrous regions on each sample are imaged with SHG in 3-D stacks with the step size of 500 nm. There is (c) a structure variation along the -axis shown by SHG images. All slices in each stack are distinguished by the flowchart and (d) assigned a crimp type. Scale bar is 2 mm and , respectively. 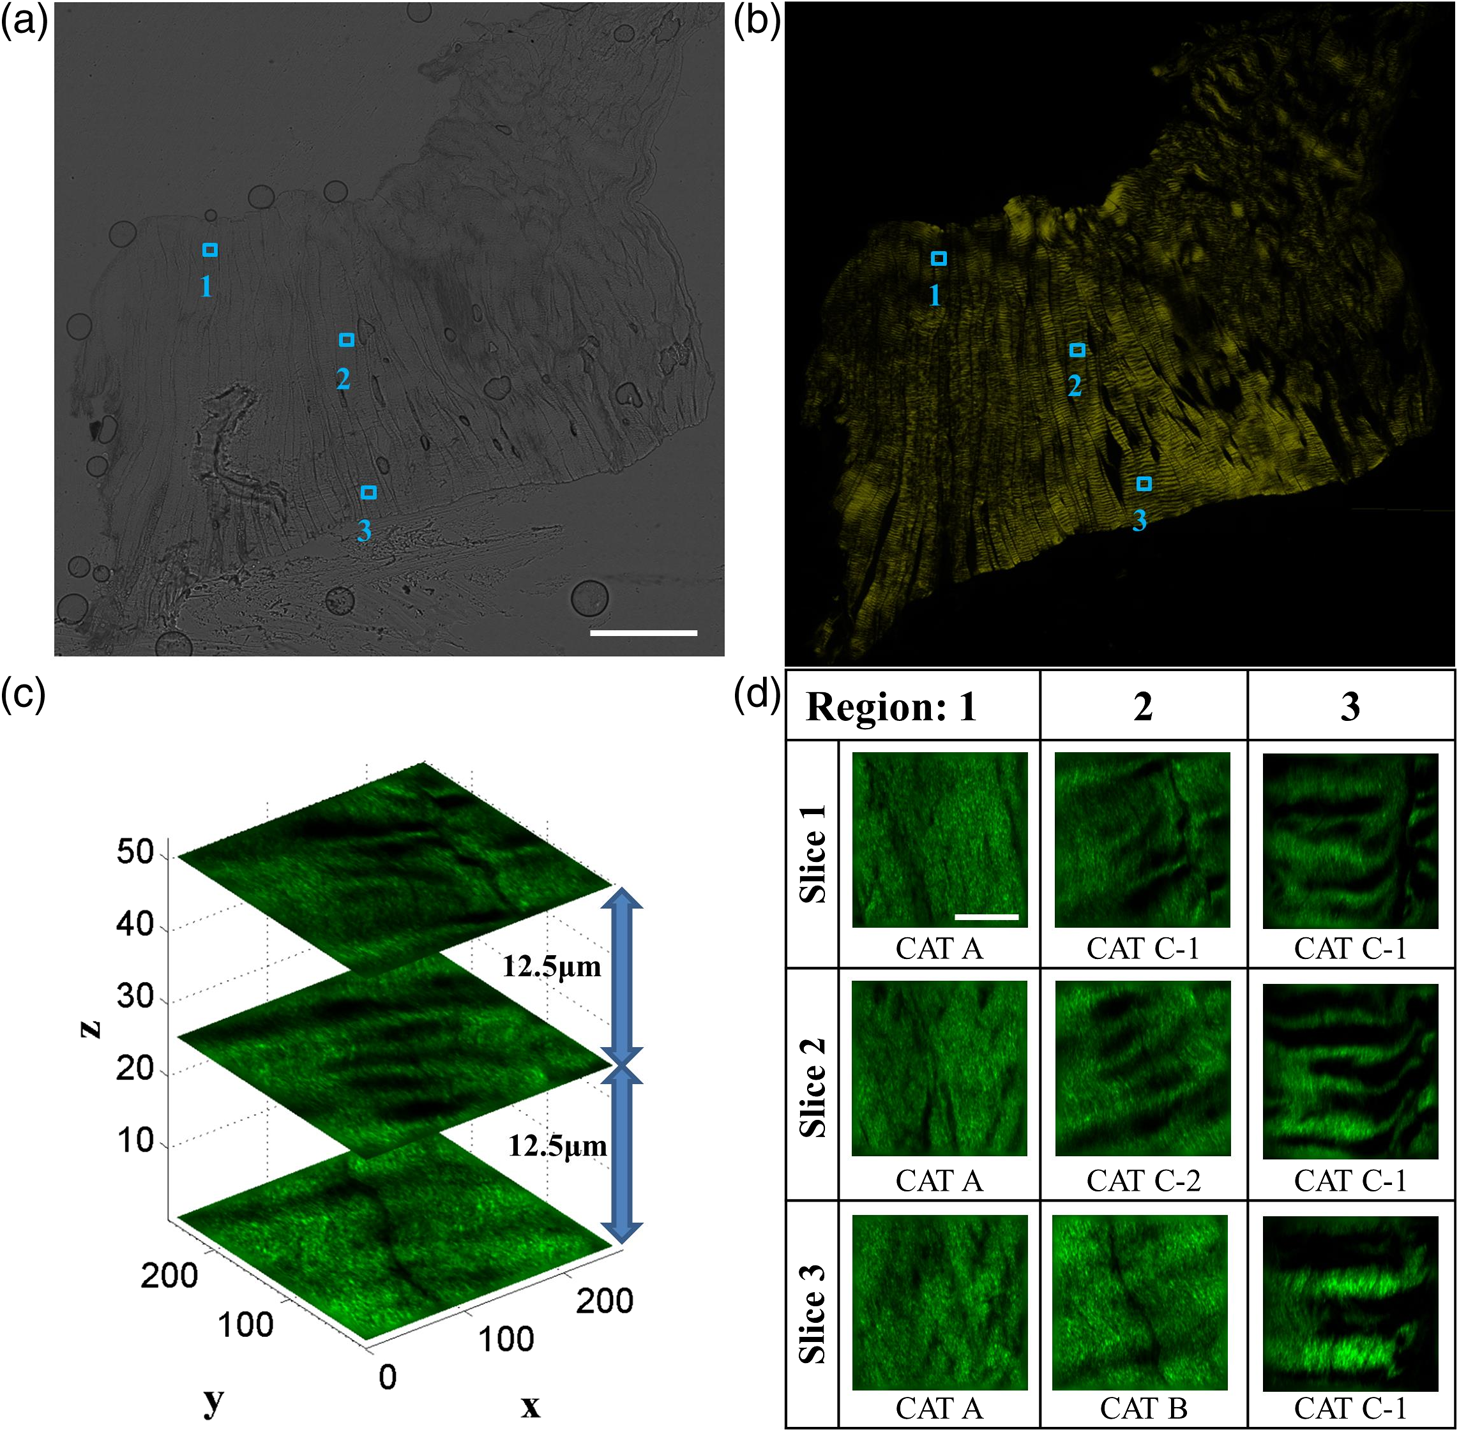 The optical sectioning capability of SHG imaging46,51,60 allows us to capture the overall 3-D structural variations in ligaments. SHG imaging can also be applied to thick samples by collecting the back-scattered SHG signal.61,62 There have been studies using PL microscopy quantifying crimp organization by measuring the linear birefringence;31 however, low-axial resolution diminishes its ability to observe 3-D structural variation. It is important to note that we focus on the aforementioned advantages of SHG microscopy, which make it suitable for revealing collagen fiber structural information. While an in depth one-to-one comparison between imaging modalities is not our primary aim, a brief qualitative comparison of images obtained using SHG microscopy to other modalities is illustrated in the Appendix. In the case of CAT C-2 images, we observe a repetitive pattern of alternating fiber orientations [Figs. 6(a)–6(b)]. In other words, the fiber bands in the SHG images have a similar orientation in every other band. For example, in Figs. 6(a)–6(b), the first red arrow from the top along with the third and fifth arrows have comparable directions. This also applies to the second, fourth, and sixth arrows. Thus, we suggest that the fibers are not only out-of-plane crimped but also in a helical crimp pattern [Fig. 6(c)]. This is because helical crimps naturally have an out-of-plane region once the fibers twist and change directions. The direction shift is repetitive, which leads to dark bands and bright bands alternating orientation for CAT C-2 crimps. These dark and bright regions are indicated as blue and yellow boxes, respectively, in Figs. 6(a)–6(b). However, since the low-SHG-signal areas are relatively large, it can be thought that the twist areas have a planar crimp that makes the out-of-plane area extended. We utilize solder wires to replicate the crimp pattern in Fig. 6(c), which also illustrates each individual crimped fiber aligned next to each other forming bundles. These bundles of fibers are stacked in layers maintaining its structure. This can be explained due to no particular change in the crimp pattern throughout the -stack. Features in CAT C-2, such as the bright and dark areas and fiber directions, remained constant even though the depth of focus changes for roughly . Fig. 6In (a) and (b) CAT C-2 images, fiber orientation shifts in a repetitive pattern. Fibers have a similar orientation in every other bright band. Regions in the yellow rectangle have a high SHG intensity, indicating that the fibers are parallel with the image plane. Regions in the blue rectangle have a low intensity, suggesting that the fibers are oblique or perpendicular with the image plane. (c) Solder wires are used to describe the helical crimp pattern with an out-of-plane crimp. (d) Schematic demonstrating how crimped angle is calculated. The scale bar is .  Previous studies conducted using electron microscopy34–36 and PL microscopy30,31,63 show similar results of the helical crimp patterns. Electron microscopes were able to image twisted fibers directly from highly magnified images, and PL microscopy revealed the helicity of fibers measuring densitometric features from the birefringence intensity. From the helical structure, researchers have suggested their mechanical roles act like a buffer system-absorbing load to prevent damage that could occur in fibers during elongation.38 The helical model has also been applied to simulation models64 and analyzed for applications such as grafts.35,36 Our results from SHG imaging brings another modality for imaging the helicity of ligament fibers and demonstrates the potential to provide image data for 3-D computational simulations of fiber-based anisotropic materials. The crimp angle is defined as the angle of the crimp with respect to the horizontal [Fig. 6(d)]; thus, intuitively crimp angle in our case is equivalent to one half of the angle differences between each band. The measured crimp angle (data not shown) matches well with previously published data.38,64,65 4.ConclusionIn conclusion, FT-SHG was applied for the first time on the PCL to quantitatively assess collagen fiber organization. The results of our work could be summarized in three major points. First, we were able to identify three types of crimping patterns in PCL samples. A customized code, along with FT analysis, was used to quantitatively distinguish each type. Second, unlike traditional imaging modalities used to analyze the PCL, we demonstrated the 3-D variation of crimp structure using SHG imaging. Third, we verified the helical crimp format of collagen fibers in ligament previously observed by electron and PL microscopes. Our work takes advantage of the label-free, high-contrast, and optical sectioning capabilities of SHG microscopy to highlight its potential to be used to link the fibrous structural information in the PCL with its underlying mechanical properties. AppendicesAppendixFigure 7 shows a comparison of ligament images taken by SHG microscopy in comparison to the more conventional approaches of bright-field and PL microscopy. It is important to note that the relative image locations are not identical because of the use of different imaging platforms. However, the regions are chosen where clear image fiducials are present to facilitate coregistration with a spatial uncertainty of less than . Bright-field images normally show fibrous areas, whereas PL images all show out-of-plane crimps (CAT C). For the SHG images, a single image per region from the stack was chosen, and the image features vary by region. DisclosuresWe have no relevant financial interests in this manuscript. There is no conflict of interest. ReferencesJ. Dvorak et al.,
“Biomechanics of the craniocervical region: the alar and transverse ligaments,”
J. Orthop. Res., 6 452
–461
(1988). http://dx.doi.org/10.1002/(ISSN)1554-527X JOREDR 0736-0266 Google Scholar
J. Goodfellow and J. O’Connor,
“The mechanics of the knee and prosthesis design,”
J. Bone Jt. Surg., 60B 358
–369
(1978). http://dx.doi.org/10.1007/978-3-642-59347-5_2 JBJSB4 0021-9355 Google Scholar
U. Meyer et al., Fundamentals of Tissue Engineering and Regenerative Medicine, Springer Science & Business Media, Berlin, Germany
(2009). Google Scholar
L. Yahia, Ligament and Ligamentoplasties, Springer Science & Business Media, Berlin, Germany
(2012). Google Scholar
F. Noyes et al.,
“Biomechanical analysis of human ligament grafts used in knee-ligament repairs and reconstructions,”
J. Bone Jt. Surg., 66 344
–352
(1984). http://dx.doi.org/10.2106/00004623-198466030-00005 JBJSB4 0021-9355 Google Scholar
S. Yamamoto et al.,
“The strain-rate dependence of mechanical properties of rabbit knee ligament,”
in Int. Technical Conf. on the Enhanced Safety of Vehicles,
1
–9
(2003). Google Scholar
S. Bollen,
“Epidemiology of knee injuries: diagnosis and triage,”
Br. J. Sports Med., 34 227
–228
(2000). http://dx.doi.org/10.1136/bjsm.34.3.227-a BJSMDZ 0306-3674 Google Scholar
C. R. LaBella, W. Hennrikus and T. E. Hewett,
“Anterior cruciate ligament injuries: diagnosis, treatment, and prevention,”
Pediatrics, 133 e1437
–e1450
(2014). http://dx.doi.org/10.1542/peds.2014-0623 Google Scholar
J. Callaghan, The Adult Knee, Lippincott Williams & Wilkins, Philadelphia
(2003). Google Scholar
S. M. Full et al.,
“Effect of fiber orientation of collagen-based electrospun meshes on human fibroblasts for ligament tissue engineering applications,”
J. Biomed. Mater. Res. Part B Appl. Biomater., 103 39
–46
(2015). http://dx.doi.org/10.1002/jbm.b.v103.1 Google Scholar
S. Pal, Design of Artificial Human Joints & Organs, 23
–40 Springer Science & Business Media, New York
(2014). Google Scholar
S. Woo, P. Renstrom and S. Arnoczky, The Encyclopaedia of Sports Medicine: An IOC Medical Commission Publication, Tendinopathy in Athletes, John Wiley & Sons, Oxford
(2008). Google Scholar
P. Netti et al.,
“Structure-mechanical properties relationship of natural tendons and ligaments,”
J. Mater. Sci. Mater. Med., 7 525
–530
(1996). http://dx.doi.org/10.1007/BF00122175 JSMMEL 0957-4530 Google Scholar
A. Viidik,
“Functional properties of collagenous tissues,”
Int. Rev. Connect. Tissue Res., 6 127
–215
(1973). http://dx.doi.org/10.1016/B978-0-12-363706-2.50010-6 ICOTAR 0074-767X Google Scholar
J. Kastelic, A. Galeski and E. Baer,
“The multicomposite structure of tendon,”
Connect. Tissue Res., 6 11
–23
(2009). http://dx.doi.org/10.3109/03008207809152283 CVTRBC 0300-8207 Google Scholar
D. Elliott,
“Structure and function of mammalian tendon,”
Biol. Rev., 40 392
–421
(1965). http://dx.doi.org/10.1111/brv.1965.40.issue-3 Google Scholar
W. C. Dale et al.,
“On the ultrastructure of mammalian tendon,”
Experientia, 28 1293
–1295
(1972). http://dx.doi.org/10.1007/BF01965303 EXPEAM 0014-4754 Google Scholar
M. Nordin, T. Lorenz and M. Campello, Basic Biomechanics of the Musculoskeletal System, 102
–125 Lippincott Williams & Wilkins, Berlin, Germany
(2000). Google Scholar
D. L. Butler et al.,
“Biomechanics of ligaments and tendons,”
Exerc. Sport Sci. Rev., 6 125
–182
(1978). Google Scholar
C. B. Frank,
“Ligament structure, physiology and function,”
J. Musculoskelet. Neuronal Interact., 4 199
–201
(2004). Google Scholar
J. Diamant et al.,
“Collagen: ultrastructure and its relations to mechanical properties as a function of ageing,”
Proc. R. Soc. London Ser. B, 180 293
–315
(1972). http://dx.doi.org/10.1098/rspb.1972.0019 Google Scholar
K. A. Hansen, J. A. Weiss and J. K. Barton,
“Recruitment of tendon crimp with applied tensile strain,”
J. Biomech. Eng., 124 72
–77
(2002). http://dx.doi.org/10.1115/1.1427698 JBENDY 0148-0731 Google Scholar
L. U. Bigliani et al.,
“Tensile properties of the inferior glenohumeral ligament,”
J. Orthop. Res., 10 187
–197
(1992). http://dx.doi.org/10.1002/(ISSN)1554-527X JOREDR 0736-0266 Google Scholar
Y. Lanir,
“Structure-strength relations in mammalian tendon,”
Biophys. J., 24 541
–554
(1978). http://dx.doi.org/10.1016/S0006-3495(78)85400-9 BIOJAU 0006-3495 Google Scholar
L. J. Gathercole and A. Keller,
“Crimp morphology in the fibre-forming collagens,”
Matrix, 11 214
–234
(1991). http://dx.doi.org/10.1016/S0934-8832(11)80161-7 Google Scholar
K. S. Miller et al.,
“Characterizing local collagen fiber re-alignment and crimp behavior throughout mechanical testing in a mature mouse supraspinatus tendon model,”
J. Biomech., 45 2061
–2065
(2012). http://dx.doi.org/10.1016/j.jbiomech.2012.06.006 JBMCB5 0021-9290 Google Scholar
T. York et al.,
“Real-time high-resolution measurement of collagen alignment in dynamically loaded soft tissue,”
J. Biomed. Opt., 19 066011
(2014). http://dx.doi.org/10.1117/1.JBO.19.6.066011 JBOPFO 1083-3668 Google Scholar
N. W. Skelley et al.,
“Differences in the microstructural properties of the anteromedial and posterolateral bundles of the anterior cruciate ligament,”
Am. J. Sports Med., 43 928
–936
(2015). http://dx.doi.org/10.1177/0363546514566192 Google Scholar
K. Hayashi and P. Muir, Advances in the Canine Cranial Cruciate Ligament, 43
–92 John Wiley & Sons, Hoboken, New Jersey
(2011). Google Scholar
B. C. Vidal,
“Form birefringence as applied to biopolymer and inorganic material supraorganization,”
Biotech. Histochem., 85 365
–378
(2010). http://dx.doi.org/10.3109/10520290903430496 BIHIEU 1052-0295 Google Scholar
B. de Campos Vidal,
“Image analysis of tendon helical superstructure using interference and polarized light microscopy,”
Micron, 34 423
–432
(2003). http://dx.doi.org/10.1016/S0968-4328(03)00039-8 MICNB2 0047-7206 Google Scholar
B. de Campos Vidal and M. L. S. Mello,
“Structural organization of collagen fibers in chordae tendineae as assessed by optical anisotropic properties and Fast Fourier transform,”
J. Struct. Biol., 167 166
–175
(2009). http://dx.doi.org/10.1016/j.jsb.2009.05.004 Google Scholar
M. Franchi et al.,
“Crimp morphology in relaxed and stretched rat Achilles tendon,”
J. Anat., 210 1
–7
(2007). http://dx.doi.org/10.1111/joa.2007.210.issue-1 JOANAY 0021-8782 Google Scholar
L. H. Yahia and G. Drouin,
“Collagen structure in human anterior cruciate ligament and patellar tendon,”
J. Mater. Sci., 23 3750
–3755
(1988). http://dx.doi.org/10.1007/BF00540523 JMTSAS 0022-2461 Google Scholar
L. H. Yahia and G. Drouin,
“Microscopical investigation of canine anterior cruciate ligament and patellar tendon: collagen fascicle morphology and architecture,”
J. Orthop. Res., 7 243
–251
(1989). http://dx.doi.org/10.1002/(ISSN)1554-527X JOREDR 0736-0266 Google Scholar
J. Zhu et al.,
“Ultrastructural and morphological characteristics of human anterior cruciate ligament and hamstring tendons,”
Anat. Rec., 295 1430
–1436
(2012). http://dx.doi.org/10.1002/ar.v295.9 ANREAK 0003-276X Google Scholar
M. Franchi et al.,
“Tendon and ligament fibrillar crimps give rise to left-handed helices of collagen fibrils in both planar and helical crimps,”
J. Anat., 216 301
–309
(2010). http://dx.doi.org/10.1111/joa.2010.216.issue-3 JOANAY 0021-8782 Google Scholar
M. Franchi et al.,
“Collagen fibre arrangement and functional crimping pattern of the medial collateral ligament in the rat knee,”
Knee Surg. Sport. Traumatol. Arthrosc., 18 1671
–1678
(2010). http://dx.doi.org/10.1007/s00167-010-1084-6 Google Scholar
S. Zaffagnini et al.,
“Collagen fibre and fibril ultrastructural arrangement of the superficial medial collateral ligament in the human knee,”
Knee Surg. Sport. Traumatol. Arthrosc., 23 3674
–3682
(2015). http://dx.doi.org/10.1007/s00167-014-3276-y Google Scholar
S. M. Wilson and A. Bacic,
“Preparation of plant cells for transmission electron microscopy to optimize immunogold labeling of carbohydrate and protein epitopes,”
Nat. Protoc., 7 1716
–1727
(2012). http://dx.doi.org/10.1038/nprot.2012.096 1754-2189 Google Scholar
P. K. Chu and X. Liu, Biomaterials Fabrication and Processing Handbook, CRC Press, Boca Raton
(2008). Google Scholar
J. E. Kelleher, T. Siegmund and R. W. Chan,
“Collagen microstructure in the vocal ligament: initial results on the potential effects of smoking,”
Laryngoscope, 124 E361
–E367
(2014). http://dx.doi.org/10.1002/lary.24626 Google Scholar
N. Y. Ignatieva et al.,
“Laser-induced modification of the patellar ligament tissue: comparative study of structural and optical changes,”
Lasers Med. Sci., 26 401
–413
(2011). http://dx.doi.org/10.1007/s10103-010-0871-0 Google Scholar
H. Chen et al.,
“Microstructure and mechanical property of Glutaraidehyde-treated porcine pulmonary ligament,”
J. Biomech. Eng., 138 061003
(2016). http://dx.doi.org/10.1115/1.4033300 JBENDY 0148-0731 Google Scholar
P. A. Franken et al.,
“Generation of optical harmonics,”
Phys. Rev. Lett., 7 118
–119
(1961). http://dx.doi.org/10.1103/PhysRevLett.7.118 PRLTAO 0031-9007 Google Scholar
B. Masters and P. So, Handbook of Biomedical Nonlinear Optical Microscopy, Oxford University Press, Oxford
(2008). Google Scholar
F. Pavone and P. Campagnola, Second Harmonic Generation Imaging, CRC Press, Boca Raton, Florida
(2013). Google Scholar
M. Sivaguru et al.,
“Quantitative analysis of collagen fiber organization in injured tendons using Fourier transform-second harmonic generation imaging,”
Opt. Express, 18 24983
(2010). http://dx.doi.org/10.1364/OE.18.024983 OPEXFF 1094-4087 Google Scholar
R. Ambekar et al.,
“Quantitative second-harmonic generation microscopy for imaging porcine cortical bone: comparison to SEM and its potential to investigate age-related changes,”
Bone, 50 643
–650
(2012). http://dx.doi.org/10.1016/j.bone.2011.11.013 Google Scholar
R. Ambekar et al.,
“Quantifying collagen structure in breast biopsies using second-harmonic generation imaging,”
Biomed. Opt. Express, 3 2021
–2035
(2012). http://dx.doi.org/10.1364/BOE.3.002021 BOEICL 2156-7085 Google Scholar
T. Y. Lau, R. Ambekar and K. C. Toussaint,
“Quantification of collagen fiber organization using three-dimensional Fourier transform-second-harmonic generation imaging,”
Opt. Express, 20 21821
(2012). http://dx.doi.org/10.1364/OE.20.021821 OPEXFF 1094-4087 Google Scholar
T. Y. Lau et al.,
“Application of Fourier transform-second-harmonic generation imaging to the rat cervix,”
J. Microsc., 251 77
–83
(2013). http://dx.doi.org/10.1111/jmi.2013.251.issue-1 JMICAR 0022-2720 Google Scholar
B. de C. Vidal and M. L. S. Mello,
“Optical anisotropy of collagen fibers of rat calcaneal tendons: an approach to spatially resolved supramolecular organization,”
Acta Histochem., 112 53
–61
(2010). http://dx.doi.org/10.1016/j.acthis.2008.07.005 Google Scholar
W. Lee et al.,
“Third-harmonic generation imaging of breast tissue biopsies,”
J. Microsc., 264 175
–181
(2016). http://dx.doi.org/10.1111/jmi.2016.264.issue-2 JMICAR 0022-2720 Google Scholar
N. Fisher, Statistical Analysis of Ciruclar Data, Cambridge University Press, Cambridge, United Kingdom
(1993). Google Scholar
T. Diethe, N. Twomey and P. Flach,
“Bayesian modeling of the temporal aspects of smart home activity with circular statistics,”
in Joint European Conf. on Machine Learning and Knowledge Discovery in Databases,
279
–294
(2015). Google Scholar
E. Yew and C. Sheppard,
“Effects of axial field components on second harmonic generation microscopy,”
Opt. Express, 14 1167
–1174
(2006). http://dx.doi.org/10.1364/OE.14.001167 OPEXFF 1094-4087 Google Scholar
W. Maurel et al., Biomechanical Models for Soft Tissue Simulation, 1
–21 Springer Science & Business Media, Berlin, Germany
(2013). Google Scholar
C. Krafft and J. Popp, Comprehensive Biomedical Physics, 189
–208 Newnes, Amsterdam, Netherlands
(2014). Google Scholar
M. Shribak and R. Oldenbourg,
“Techniques for fast and sensitive measurements of two-dimensional birefringence distributions,”
Appl. Opt., 42 3009
–3017
(2003). http://dx.doi.org/10.1364/AO.42.003009 APOPAI 0003-6935 Google Scholar
A. H. Reshak,
“Second harmonic generation from thick leaves using the two-photon laser scanning microscope,”
Micron, 40 455
–462
(2009). http://dx.doi.org/10.1016/j.micron.2008.12.008 MICNB2 0047-7206 Google Scholar
X. Han and E. Brown,
“Measurement of the ratio of forward-propagating to back- propagating second harmonic signal using a single objective,”
Opt. Express, 18 10538
(2010). http://dx.doi.org/10.1364/OE.18.010538 OPEXFF 1094-4087 Google Scholar
B. de C. Vidal,
“Crimp as part of a helical structure,”
C. R. Acad. Sci. III., 318 173
–178
(1995). Google Scholar
S. P. Reese, S. A. Maas and J. A. Weiss,
“Micromechanical models of helical superstructures in ligament and tendon fibers predict large Poisson’s ratios,”
J. Biomech., 43 1394
–1400
(2010). http://dx.doi.org/10.1016/j.jbiomech.2010.01.004 JBMCB5 0021-9290 Google Scholar
A. K. Harvey, M. S. Thompson and S. M. Brady,
“Helical crimp model predicts material properties from tendon microsctructure,”
in Medical Image Understanding and Analysis,
1
–5
(2010). Google Scholar
BiographyWoowon Lee received his bachelor’s degree in mechanical engineering from Hanyang University, Republic of Korea, and his master’s degree from the University of Illinois at Urbana-Champaign (UIUC). He is a graduate research assistant in the Department of Mechanical Science and Engineering at UIUC. His research interest is nonlinear imaging techniques such as SHG and THG analyzed by a quantitative metric applied on biological samples. He is also interested in visualizing material properties by nonlinear optical methods. Hafizur Rahman received his bachelor’s degree in mechanical engineering from Bangladesh University of Engineering and Technology, Bangladesh, in 2009, and his MS degree in ocean engineering from Florida Atlantic University, USA, in 2013. Currently, he is a PhD candidate at the University of Illinois at Urbana-Champaign, USA. His research focuses on understanding the effects of rotator cuff tears on shoulder kinematics and glenohumeral cartilage pressure. Mariana E. Kersh received her BA degree in English, her MS degree in mechanical engineering, and her PhD in materials science. She was a postdoctoral McKenzie fellow at the University of Melbourne. She is an assistant professor in the Department of Mechanical Science and Engineering at the University of Illinois at Urbana-Champaign and is head of the Tissue Biomechanics Laboratory. Her research focuses on structure–function relationships in orthopedic tissues to investigate musculoskeletal diseases. Kimani C. Toussaint is an associate professor in the Department of Mechanical Science and Engineering and an affiliate in the Departments of Electrical and Computer Engineering, and Bioengineering at the University of Illinois at Urbana-Champaign. He directs the PROBE lab, which focuses on developing optical techniques for quantitatively imaging collagen-based tissues and investigating the properties of plasmonic nanostructures for control of near-field optical forces. He is a senior member in SPIE, OSA, and IEEE. |


