|
|
|
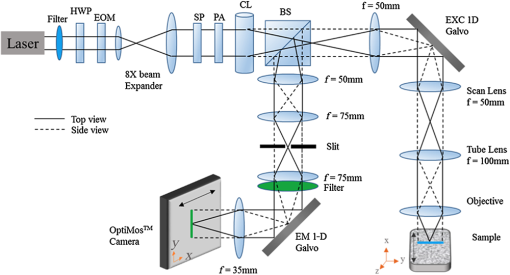
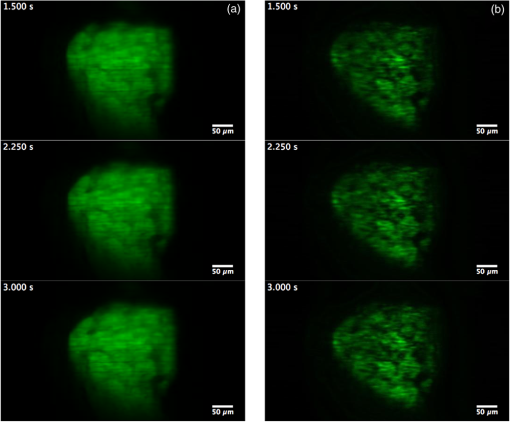
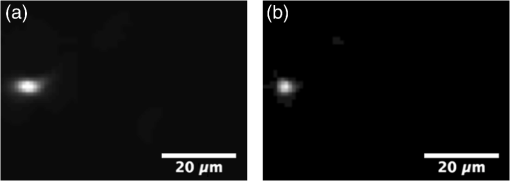
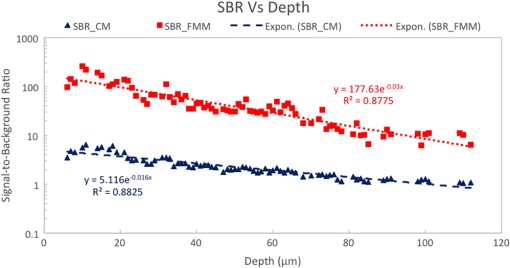
Fluorescence microscopy is an excellent tool for high-resolution imaging of biological tissue.1–4 The increasing development of transgenic fluorescent probes have opened up the door for in vivo imaging to be carried out for a wide range of dynamic biological applications in developmental biology,5 neurobiology,6 and cell biology.7,8 For in vivo microscopy imaging platforms, it is desirable for them to provide adequately high spatial resolution, penetration depth, and imaging speed at the same time. While a wide variety of microscopic methods have been developed in the past decades,9–13 few can meet all the three requirements simultaneously. Focal modulation microscopy (FMM) is an emerging microscopy technique that has the ability to image up to in depth in optically thick tissues.14–16 It employs a spatiotemporal phase modulator in the excitation light path to modulate the phase of the excitation beam spatially and temporally (at a fixed frequency). The spatially and temporally phase modulated beam, after being condensed by an objective, is subjected to intensity modulation that is essentially confined to the focal plane. As a result, fluorescence emissions arising from the focal plane are modulated at the same frequency, whereas emissions from out-of-focus planes are not. The combination of focal modulation and confocal pinhole has proved to be much more effective in background rejection than the confocal pinhole alone, especially in the case of strong scattering in the sample. By improving the signal-to-background ratio (SBR), FMM enables a threefold improvement in the imaging depth of a conventional confocal microscope.17 The superiority of FMM over confocal systems in terms of SBR and penetration depth is evident from the literature.14,17,18 However, the reported FMM system could only achieve a maximum imaging speed of 0.48 fps for an image size of ,19 which was limited by the point-to-point scanning mode. Many biological processes such as cell signaling and the interaction of proteins with membranes occur in the milliseconds time range.20 For the monitoring of these fast and dynamics processes without causing detrimental effects by observation, video rate image acquisition becomes necessary.21,22 Here, we report a line-scan FMM (LSFMM) system that addresses the above issues. LSFMM speeds up the image acquisition process by scanning a line focus in one-dimension (1-D) only. It allows three-dimensional (3-D) visualization of thick biological specimens at subcellular and submillisecond spatiotemporal resolutions, yielding a widely applicable tool for biomedical and potential clinical applications. Compared with the established light microscopy methods, LSFMM provides a set of combined advantages in imaging speed, background rejection, and spatial resolution. The LSFMM system (as shown in Fig. 1) includes a Cobolt Dual CalypsoTM continuous-wave diode pumped solid-state laser operating simultaneously at two fixed wavelengths, 473 and 532 nm, as the excitation light source. A filter wheel with appropriate filters is placed in front of the laser module to select the illumination wavelength. The beam is expanded eight times to increase the beam diameter to overfill the back aperture of the objective and create a diffraction limited illumination line within the focal plane of the objective. Fig. 1System schematic. HWP, half-wave plate; EOM, electro-optic modulator; SP, spatial polarizer; PA, polarizing analyzer; CL, cylindrical lens; BS, beam splitter; EXC/EM 1D galvo, excitation/emission 1-D galvo mirrors.  A cylindrical lens (CL) is used to condense the light in 1-D and form a line focus, which is relayed to the objective by a spherical lens, a scan lens, and a tube lens. A 1-D galvo mirror (Exc 1-D Galvo, GSV011, Thorlabs) is used to provide rapid line scanning of the excitation beam on the sample. The fluorescence emissions from the sample are collected by the objective, descanned, and reflected into the detection arm by the beam-splitter. A long-pass filter is used to suppress the illumination light. A confocal slit is used for spatial filtering, which rejects out-of-focus light to some extent. A second 1-D galvo mirror (EM 1D Galvo, GSV011, Thorlabs), synchronized to the first galvo mirror, is used to scan the line focus formed after the filter across the active area of a 2-D fast sCMOS camera (OptiMOSTM, Qimaging). It maps the time-dependent line distribution of the fluorescence emission intensity sequentially to different columns of the imaging sensor. An early implementation of LSFMM employed a line camera, which, however, suffered from high readout noise.23 The Qimaging sCOMS camera features very low noise () that supports high-speed image acquisition. Rapid phase modulation of the excitation beam is achieved using a spatiotemporal phase modulator (STPM) consisting of a half-wave plate, an electro-optic modulator (EOM), a spatial polarizer, and a polarizing analyzer. The operation of this STPM is explained elsewhere,19 except that the spatial polarizer (stripe-shaped) in this case must be translational symmetric along the -axis (parallel to the line focus). The STPM output field at is given by where the modulation function is the phase shift introduced by the modulator and is a periodic function of time . The spatial pattern , whose value varies from 1 to 0.5, is defined by the spatial polarizer. The modulation frequency is typically a few tens of kilohertz. The spatial distribution of the illumination beam condensed by the cylindrical can be written as where is the back aperture and is the focal length of the CL, respectively. The wavenumber is related to the excitation wavelength as . Due to the spatiotemporal phase modulation, the distribution of the excitation light intensity in the focal plane contains a dc component and an ac component oscillating at the modulation frequency . While the fluorescence emission passing through the slit is also subject to intensity modulation, the second 1-D Galvo mirror creates a spatially modulated pattern on the camera by linearly scanning the fluorescence emission line. Image processing algorithms, involving multiplication with a demodulation mask and spatial filtering, are employed to differentiate the modulated signal from a stationary background and reconstruct the demodulated FMM images.It is well known that line-scan confocal microscopy (LSCM) is inferior to point-scanning confocal microscopy as the slit is a less effective spatial filter than a pinhole. The disadvantages for LSCM include deteriorated optical sectioning capability and axial resolution. In LSFMM, however, optical sectioning is significantly enhanced by combining focal modulation with a confocal slit. We have performed fluorescence beads imaging experiments to quantify the improvements in axial resolution and SBR. We used Fluoresbrite® Yellow Green Microspheres from Polyscience that had an excitation maxima of 441 nm and an emission maxima at 485 nm. To ensure that the beads were well separated from each other, a 1:1000 dilution of the beads was prepared in water, which was subsequently suspended in a solution containing 5% agarose (Sigma, A9539). The bead mixture was vortexed vigorously and sonicated for 2 min before heating. After heating, the mixture was deposited on #0 glass-bottomed dishes (MatTek, P35G-0-10-C), allowed to cool, and then imaged 3-D. Example LSCM and LSFMM images of the same beam are compared in Fig. 2. The bead appears elongated along the -axis (horizontal) in the LSCM image [Fig. 2(a)], while no shape distortion is visible in the LSFMM image [Fig. 2(b)]. The axial resolution was estimated by measuring the FWHM of the line profile through the center of individual beads. The mean and standard deviation of the axial resolution values measured for 50 randomly chosen beads in the sample was found to be for LSFMM and for LSCM. Note that the diffraction limited axial resolution of the objective () is about at 488 nm. It is evident that focal modulation significantly improves the axial resolution of a line scan system to nearly diffraction limited, which is usually achievable with a point-scanning system only. The transverse resolution of the LSFMM system was estimated from the edge spread function of the beads. It was found that resolutions along the and directions were and , respectively. To quantify the SBR of the line-scan focal modulation system as a function of depth, another sample with fluorescence beads embedded in a scattering medium was prepared using 0.5% (w/v) ultrapure agarose (Invitrogen), 4% of lipofundin (diluted from 20% Lipofundin MCT/LCT emulsion), and 1:20 diluted fluorescent beads. Lipofundin was used to simulate light scattering in biological tissues.24,25 Five-milligrams of agarose was stirred in 1 mL of deionized (DI) water at 100°C until it dissolved completely and was allowed to cool. When the solution was still in liquid form and the temperature was lower than 50°C, beads and of 20% lipofundin were added to of the agarose solution. The total solution was stirred well and pipetted into a #0 glass-bottomed dish (MatTek, P35G-0-10-C), allowed to cool, and then imaged. There are two types of unwanted signals in an image, namely noise and background. Noise sources include the camera read-out noise, laser intensity fluctuation, shot noises, and electronic noises from the image acquisition device, whereas background arises from the sample or its surroundings. Unwanted light sources, such as stray lights, room lights, unfiltered specular, or diffuse reflectance and fluorescence etc., may contribute to the background in the image. These can be eliminated and/or reduced by imaging in a dark room with proper enclosures to minimize stray light and using filters and antireflection coatings to minimize reflectance. However, the most significant background in a microscopic image is due to scattering of light, which becomes increasingly dominant as the focal plane moves deeper into the sample.26 Assuming an adequate signal-to-noise ratio, the SBR is the bottleneck that determines how deep the imaging system can reach. For this reason, we calculated the SBR degradation of the LSFMM as a function of depth in the tissue phantom. To measure the signal intensity, a box was drawn over the center of a bead of interest. Each background area was chosen as a box at a position free from beads. SBR was calculated as the ratio of the average signal from a bead over the average background intensity27,28 for the LSFMM and line-scan CM images at different depths and for different laser powers. The drop-off in SBR with depth for the LSFMM and line-scan CM systems is shown in Fig. 3. These values were measured at a maximum laser power of 0.09 mW after the objective. The SBR for both LSFMM and LSCM reduces exponentially with depth. The SBR for LSFMM drops from at the coverslip to at deep in the scattering sample. In comparison, the SBR for LSCM is much lower at both the shallow and deep regions. It varies from at the coverslip to at . As LSFMM provides high imaging speed without compromising the imaging quality, it could become a very useful tool for imaging small animal models in vivo. To demonstrate its potential, we conducted preliminary imaging experiments to visualize the constitutive expression of DsRed fluorescent protein in the liver of live 5-day-old zebrafish larvae of strain Tg(fabp10a:DsRed;elaA:egfp), a two-color transgenic zebrafish line (LiPan).29,30 Zebrafish larvae were maintained in the fish facilities at the Department of Biological Sciences, National University of Singapore (NUS) according to the established protocols31 and in compliance with Institutional Animal Care and Use Committee (IACUC) guidelines. Before imaging, a zebrafish was placed on a #0 glass-bottomed dish (MatTek, P35G-0-10-C) and positioned in the dorsal orientation. A 2%-low melting point agarose at 40 deg was added to the zebrafish to immobilize them. Imaging was done within an hour of fixing the zebrafish in agarose gel. The zebrafish liver was imaged at 40 fps using a Olympus objective. LSFMM and LSCM images were acquired simultaneously. With such a high frame rate, it was possible to capture real-time, motion artifact-free image sequences from the live animal. The cellular- and organ-level deformations in various time scales could be observed. In the sample for LSCM [Fig. 4(a)] and LSFMM [Fig. 4(b)] frames taken at 1500, 2250, and 3000 ms, relatively large (but slow) deformation on the up left part of the liver is evident. While both LSCM and LSFMM meet the speed requirement for in vivo imaging, they result in remarkably different image qualities. Even though the zebrafish is relatively transparent, LSCM has limited optical sectioning capability to adequately suppress the out-of-focus background. The corresponding contrast and effective spatial resolution are very poor in comparison with traditional point-scanning confocal microscopy, which, of course, has limited imaging speed. On the other hand, cellular and microvascular structures in the liver are clearly visible in the LSFMM images. Fig. 4(a) LSCM (Video 1) and (b) LSFMM (Video 2) images acquired at 40 fps from the liver of a live zebrafish (Video 1, MOV, 301 KB [URL: http://dx.doi.org/10.1117/1.JBO.22.5.050502.1]; Video 2, MOV, 307 KB [URL: http://dx.doi.org/10.1117/1.JBO.22.5.050502.2]).  To conclude, we have developed a line-scan focal modulation microscope that is capable of high quality imaging of thick biological tissues at high speed (greater than 40 frames per second) with improved imaging quality in terms of background rejection and effective spatial resolution. Its capability of achieving diffraction limited axial resolution and much improved SBR (as compared with LSCM) have been quantitatively validated with phantom imaging experiments. AcknowledgmentsThis work was supported in part by National Medical Research Council (NMRC) grants (NMRC/CBRG/0100/2015 and NMRC/CBRG/0036/2013) and internal funding from the National University of Singapore. ReferencesH. Ohata et al.,
“Optical bioimaging: from living tissue to a single molecule: calcium imaging in blood vessel in situ employing two-photon excitation fluorescence microscopy,”
J. Pharmacol. Sci., 93 242
–247
(2003). http://dx.doi.org/10.1254/jphs.93.242 Google Scholar
M. Dellinger and M. Geze,
“Detection of mitochondrial DNA in living animal cells with fluorescence microscopy,”
J. Microsci., 204 196
–202
(2001). http://dx.doi.org/10.1046/j.1365-2818.2001.00954.x Google Scholar
J. Yan et al.,
“In vivo label-free quantification of liver microcirculation using dual-modality microscopy,”
J. Biomed. Opt., 19 116006
(2014). http://dx.doi.org/10.1117/1.JBO.19.11.116006 Google Scholar
N. Chen, S. Rehman and C. J. R. Sheppard,
“Recent advances in optical microscopy methods for subcellular imaging of thick biological tissues,”
Crit. Rev. Biomed. Eng., 41 393
–403
(2013). http://dx.doi.org/10.1615/CritRevBiomedEng.2014010461 CRBEDR 0278-940X Google Scholar
Z. Y. Chen et al.,
“Primary neuron culture for nerve growth and axon guidance studies in zebrafish (Danio rerio),”
PLoS ONE, 8 e57539
(2013). http://dx.doi.org/10.1371/journal.pone.0057539 Google Scholar
S. H. Chung, L. Sun and C. V. Gabel,
“In vivo neuronal calcium imaging in C. elegans,”
Jove—J. Vis. Exp., 74 e50357
(2013). http://dx.doi.org/10.3791/50357 Google Scholar
C. H. Contag and M. H. Bachmann,
“Advances in vivo bioluminescence imaging of gene expression,”
Annu. Rev. Biomed. Eng., 4 235
–260
(2002). http://dx.doi.org/10.1146/annurev.bioeng.4.111901.093336 Google Scholar
M. Hara et al.,
“Transgenic mice with green fluorescent protein-labeled pancreatic beta-cells,”
Am. J. Physiol. Endocrinol. Metab., 284 E177
–E183
(2003). http://dx.doi.org/10.1152/ajpendo.00321.2002 Google Scholar
S. Nie, D. T. Chiu and R. N. Zare,
“Probing individual molecules with confocal fluorescence microscopy,”
Science, 266 1018
–1021
(1994). http://dx.doi.org/10.1126/science.7973650 SCIEAS 0036-8075 Google Scholar
W. Denk, J. H. Strickler and W. W. Webb,
“Two-photon laser scanning fluorescence microscopy,”
Science, 248 73
–76
(1990). http://dx.doi.org/10.1126/science.2321027 SCIEAS 0036-8075 Google Scholar
G. R. Price,
“Fluorescence microscopy: use in intracellular microscopy,”
Science, 141 1111
(1963). http://dx.doi.org/10.1126/science.141.3585.1111 SCIEAS 0036-8075 Google Scholar
P. J. Keller et al.,
“Reconstruction of zebrafish early embryonic development by scanned light sheet microscopy,”
Science, 322 1065
–1069
(2008). http://dx.doi.org/10.1126/science.1162493 SCIEAS 0036-8075 Google Scholar
J. Huisken et al.,
“Optical sectioning deep inside live embryos by selective plane illumination microscopy,”
Science, 305 1007
–1009
(2004). http://dx.doi.org/10.1126/science.1100035 SCIEAS 0036-8075 Google Scholar
N. Chen, C. H. Wong and C. J. Sheppard,
“Focal modulation microscopy,”
Opt. Express, 16 18764
(2008). http://dx.doi.org/10.1364/OE.16.018764 Google Scholar
N. G. Chen, S. Rehman and C. J. R. Sheppard,
“Advanced optical microscopy methods for in vivo imaging of sub-cellular structures in thick biological tissues,”
J. Innovative Opt. Health Sci., 7 1440001
(2014). http://dx.doi.org/10.1142/S179354581440001X Google Scholar
Y. Duan et al.,
“Analytic method to optimize aperture design in focal modulation microscopy,”
Opt. Lett., 39 1677
–1680
(2014). http://dx.doi.org/10.1364/OL.39.001677 OPLEDP 0146-9592 Google Scholar
W. Gong et al.,
“Improved spatial resolution in fluorescence focal modulation microscopy,”
Opt. Lett., 34 3508
–3510
(2009). http://dx.doi.org/10.1364/OL.34.003508 OPLEDP 0146-9592 Google Scholar
S. P. Chong et al.,
“Focal modulation microscopy: a theoretical study,”
Opt. Lett., 35 1804
–1806
(2010). http://dx.doi.org/10.1364/OL.35.001804 OPLEDP 0146-9592 Google Scholar
N. Chen and G. Gao,
“Multi-contrast focal modulation microscopy for in vivo imaging of thick biological tissues,”
Opt. Express, 20 12166
(2012). http://dx.doi.org/10.1364/OE.20.012166 OPEXFF 1094-4087 Google Scholar
R. Wolleschensky, B. Zimmermann and M. Kempe,
“High-speed confocal fluorescence imaging with a novel line scanning microscope,”
J. Biomed. Opt., 11 064011
(2006). http://dx.doi.org/10.1117/1.2402110 JBOPFO 1083-3668 Google Scholar
Y. Duan and N. Chen,
“Hybrid wide-field and scanning microscopy for high-speed 3D imaging,”
Opt. Lett., 40 5251
–5254
(2015). http://dx.doi.org/10.1364/OL.40.005251 OPLEDP 0146-9592 Google Scholar
Y. Duan and N. Chen,
“Optical sectioning with hybrid images to reconstruct in Fourier space,”
in OSA Technical Digest Asia Communications and Photonics Conf.,
(2014). Google Scholar
P. Shilpa and N. Chen,
“Line scan focal modulation microscopy for in-vivo imaging of zebrafish,”
in OSA Technical Digest Asia Communications and Photonics Conf.,
(2014). Google Scholar
W. F. Cheong, S. A. Prahl and A. J. Welch,
“A review of the optical-properties of biological tissues,”
IEEE J. Quantum Electron., 26 2166
–2185
(1990). http://dx.doi.org/10.1109/3.64354 IEJQA7 0018-9197 Google Scholar
S. L. Jacques,
“Optical properties of biological tissues: a review,”
Phys. Med. Biol., 58 R37
–R61
(2013). http://dx.doi.org/10.1088/0031-9155/58/11/R37 PHMBA7 0031-9155 Google Scholar
B. McCall,
“Fluorescence microscopy/quantitative imaging: a systems-engineering approach to quantitative fluorescence bioimaging,”
(2015) http://www.bioopticsworld.com/articles/print/volume-8/issue-1/features/fluorescence-microscopy-quantitative-imaging-a-systems-engineering-approach-to-quantitative-fluorescence-bioimaging.html January ). 2015). Google Scholar
D. Kobat, N. G. Horton and C. Xu,
“In vivo two-photon microscopy to 1.6-mm depth in mouse cortex,”
J. Biomed. Opt., 16 106014
(2011). http://dx.doi.org/10.1117/1.3646209 JBOPFO 1083-3668 Google Scholar
Z. Lavagnino et al.,
“Two-photon excitation selective plane illumination microscopy (2PE-SPIM) of highly scattering samples: characterization and application,”
Opt. Express, 21 5998
–6008
(2013). http://dx.doi.org/10.1364/OE.21.005998 OPEXFF 1094-4087 Google Scholar
S. Korzh et al.,
“Requirement of vasculogenesis and blood circulation in late stages of liver growth in zebrafish,”
BMC Dev. Biol., 8 84
(2008). http://dx.doi.org/10.1186/1471-213X-8-84 Google Scholar
X. Zhang, C. Li and Z. Gong,
“Development of a convenient in vivo hepatotoxin assay using a transgenic zebrafish line with liver-specific DsRed expression,”
PLoS ONE, 9 e91874
(2014). http://dx.doi.org/10.1371/journal.pone.0091874 POLNCL 1932-6203 Google Scholar
M. Westerfield, The Zebrafish Book: a Guide for the Laboratory Use of Zebrafish (Danio rerio), University of Oregon Press, Eugene
(2000). Google Scholar
|


