|
|
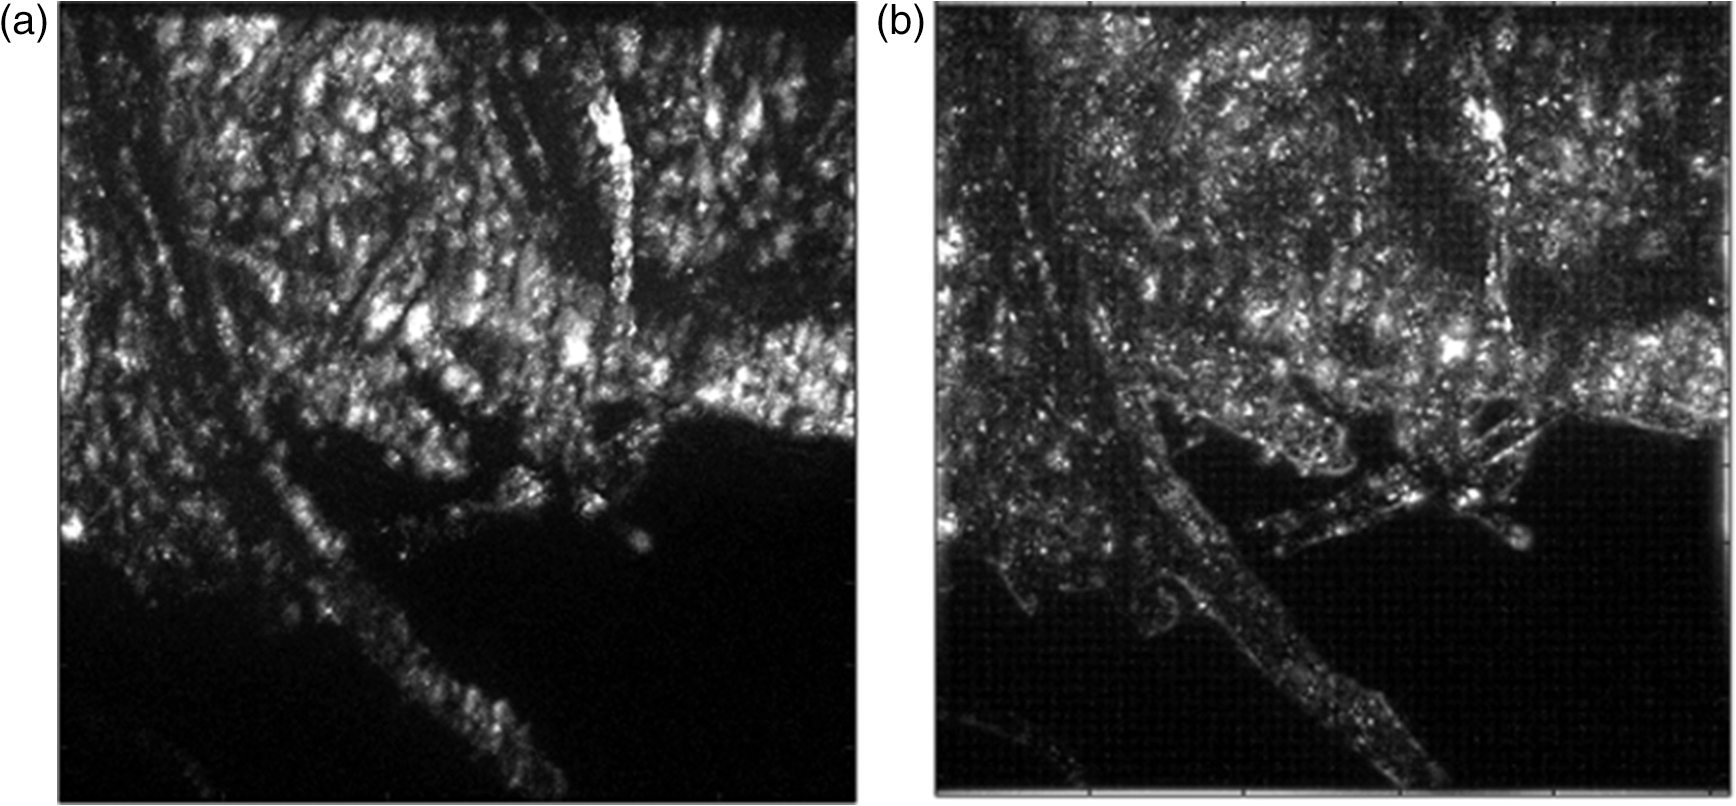
1.IntroductionIn this paper, we introduce a technique that produces confocal-like optical sectioning from a single structured illumination microscopy (SIM) image. This new method requires a single sample, which is time limited only by the frame rate of the camera. This allows us to section samples at physiologically relevant time scales. This is in comparison to confocal microscopy and traditional structured illumination, which require either sequential scanning of or at least three frames of data, respectively. The method outlined also produces more robust sectioning within a turbid medium than traditional structured illumination. Optical sectioning has provided pathologists and clinicians with the ability to image biological samples noninvasively, at or below the surface. In cases such as skin cancer, malignant cells are often located below the stratum corneum, a layer of cornified epithelial cells that occludes living subsurface cells.1 This makes it difficult for a pathologist to determine the health of cells without excising the cells for further analysis. Sectioning is used to build a depth map of a specimen, measuring axial information providing a three dimension or tomographic map to give depth information about subsurface objects.2,3 Additionally, optical sectioning produces higher contrast images by rejecting scattered light from out-of-focus planes.4 Currently, the most common method of optical sectioning is confocal microscopy. Confocal microscopy works by passing received light through a pinhole, which rejects out-of-focus light from reaching the detector. While confocal microscopy produces sectioning, it also rejects a disproportionally large amount of light, requiring a high powered source to function properly. Additionally, because the pinhole only allows a single pixel to be imaged at a time, raster scanning is required to build a full two-dimensional image.4,5 Recently, a new method of optical sectioning known as SIM, which does not require the use of a pinhole, has been developed. SIM has the advantage of using a widefield imaging technique, eliminating the need to raster scan. A high-frequency pattern is used to modulate the plane of interest. Optical sectioning is achieved by decoupling the AC light (in-focus) from the DC light (out-of-focus) of a given image. Decoupling is achieved by phase shifting the pattern to at least three different positions and then pairwise subtracting them from one another.2,3 SIM, however, has not been used for imaging within highly scattering media as issues with contrast and phase alignment at depth produce very weak sectioning.6–8 There have been other attempts to overcome these issues using many more samples, such as tens of random modulation patterns, but this comes at the cost of requiring much more data to produce sectioning.9 These factors have greatly limited the usage of SIM, especially with regard to in vivo imaging. The methods described above require multiple samples over a period of time to produce sectioning, making in vivo imaging difficult. Also, because SIM requires alignment of three different phases, small differences in optical path length can introduce strong artifacts, particularly at depth, as we will show later in this paper. This paper will show that only a single phase is required to produce sectioning at depth, providing axial information about the specimen and increasing the contrast. Using a specialized two-dimensional Hilbert transform, Nadeau et al. showed that only two images are required to decouple the signals from one another.10–12 We directly apply the Hilbert demodulation technique to show that it also works with sectioning on a micron scale. Additionally, we extend the work by reducing the number of images required from 2 to 1, making single-shot optical sectioning possible. We show that subsurface objects can be sectioned through a turbid medium, generating better contrast and resolution than the traditional three-phase SIM at depth and evidence for application in in vivo skin imaging. 2.Methods2.1.Structured Illumination—Conventional ApproachStructured illumination is achieved by projecting high frequency, spatially patterned light onto a specimen. The typical setup for SIM and for all experimentation throughout this paper is sketched in Fig. 1. The pattern lies on a plane conjugate to both the CCD and a discrete plane of focus at the specimen. As a result, light scattered from the in-focus plane is modulated, separating it from the out-of-focus light. Separating these two components allows for the removal of unwanted light from regions above and below the plane of interest. This is accomplished by measuring a total of three images, typically with phases 0, 120, and 240 deg, and then processing them with the differencing scheme:2 where is a 2-D array of the lateral coordinates and .Fig. 1Layout of the experimental setup. The dashed lines represent planes that are conjugate to one another. This focuses a pattern from the DMD onto a discrete plane of the specimen (after the objective) and relays this back onto the camera.  When selecting the frequency of the modulation pattern, there is a trade-off between sectioning depth and sectioning resolution. A high-frequency pattern will produce higher sectioning resolution as it quickly blurs away from the conjugate plane. However, it becomes difficult to resolve at depth, limiting the absolute sectioning depth. Using a lower frequency pattern will result in poorer sectioning resolution but good sectioning depth. The absolute value of the resolutions will depend on the numerical aperture (NA) of the system. However, for this paper, we use a single-modulation pattern of for all depths and samples to simplify comparison across all scenarios. This particular value was selected to achieve a reasonable sectioning resolution () and sectioning depth (). At these sizes, we will be able to section at biologically relevant sizes and depth, specifically when considering skin cells and at depths located near the junction of the epidermis and dermis.1 Also, because we have used only a single modulation frequency, data acquisition time and processing will remain constant for all targets and depths. 2.2.Spatial Frequency Domain Imaging—Using Hilbert TransformTo achieve single-image sectioning, we extend the spatial frequency domain imaging (SFDI) work done by Nadeau et al.12 Similar to SIM, SFDI functions by modulating an image with a known frequency and phase. SFDI works to separate the absorption coefficient () and reduced scattering coefficient () of a material, which have differing sensitivities to the spatial frequency of the projected light. As a result, and can be decoupled using the DC and AC portions of the signal, respectively.13–15 In SIM, we use the same principal to decouple in-focus and out-of-focus light. Conventional SFDI requires three phases to be measured along with one image without modulation, for a total of four images. Recent advancements in signal processing and SFDI have produced a method of demodulating an image of unknown phase, frequency, and angle using the 2-D Hilbert transform. Developed by Larkin et al.,10,11 a spiral function is applied to demodulate a 2-D fringe pattern of unknown frequency and phase. In the two-dimensional case, the Hilbert transform is applied using the spiral function, where and are positional indices within the frequency domain: which has the benefit of being agnostic to both the frequency and angle of the modulation pattern. This Hilbert demodulation technique was leveraged by Nadeau et al.12 to perform fast, accurate SFDI processing. With this method, only two images are required to decouple and . SIM and SFDI differ in that the higher frequency modulation of SIM quickly goes out-of-focus away from the focal plane. As such, we treat the in-focus and out-of-focus regions as separate, distinct regions.2.3.One-Dimensional SimulationUsing a one-dimensional simulation, we describe how the in-focus light (AC) and out-of-focus light (DC) components from a signal can be isolated from one another. For the simulation, the “Hilbert” function from Mathworks MATLAB v2015a is used but serves as a suitable stand-in for the spiral function when applied to the two-dimensional cases going forward. First, synthetic data are generated to demonstrate the algorithm. Here, the synthetic data represent a spatially varying signal in one direction, a simplified version of the two-dimensional images, which will be considered later on. This is the signal that will lie in the conjugate plane, just beyond the objective in Fig. 1. A random signal is constructed with a mean of 0.5, which represents the signal we hope to extract from a given focal plane (shown in green in Fig. 2). A modulation pattern is constructed as , which is the patterned light that will be projected by the digital micromirror device (DMD). This modulation pattern represents an irradiance pattern projected onto the sample, which has a mean of 0.5 and ranges from 0.25 to 0.75 (shown by the dashed blue line) and multiplied by the in-focus signal (). Independently, a second low spatial frequency, random pattern is created to represent the out-of-focus light (, shown in red). This signal is generated with low spatial frequency, as it represents the background scattered light from regions outside the conjugate plane. Fig. 2All data in raw samples (unitless counts). (a) The low frequency out-of-focus and high frequency in-focus signals that are combined with the modulation pattern, as described in Eq. (3). (b) Power spectral density of the measured signal before and after the DC component is removed. We can see the modulation pattern present at . (c) Time-series data of the signals before (black) and after signal subtraction (yellow). (d) The recovered in-focus portion of the signal using the Hilbert transform as compared to the original signal. 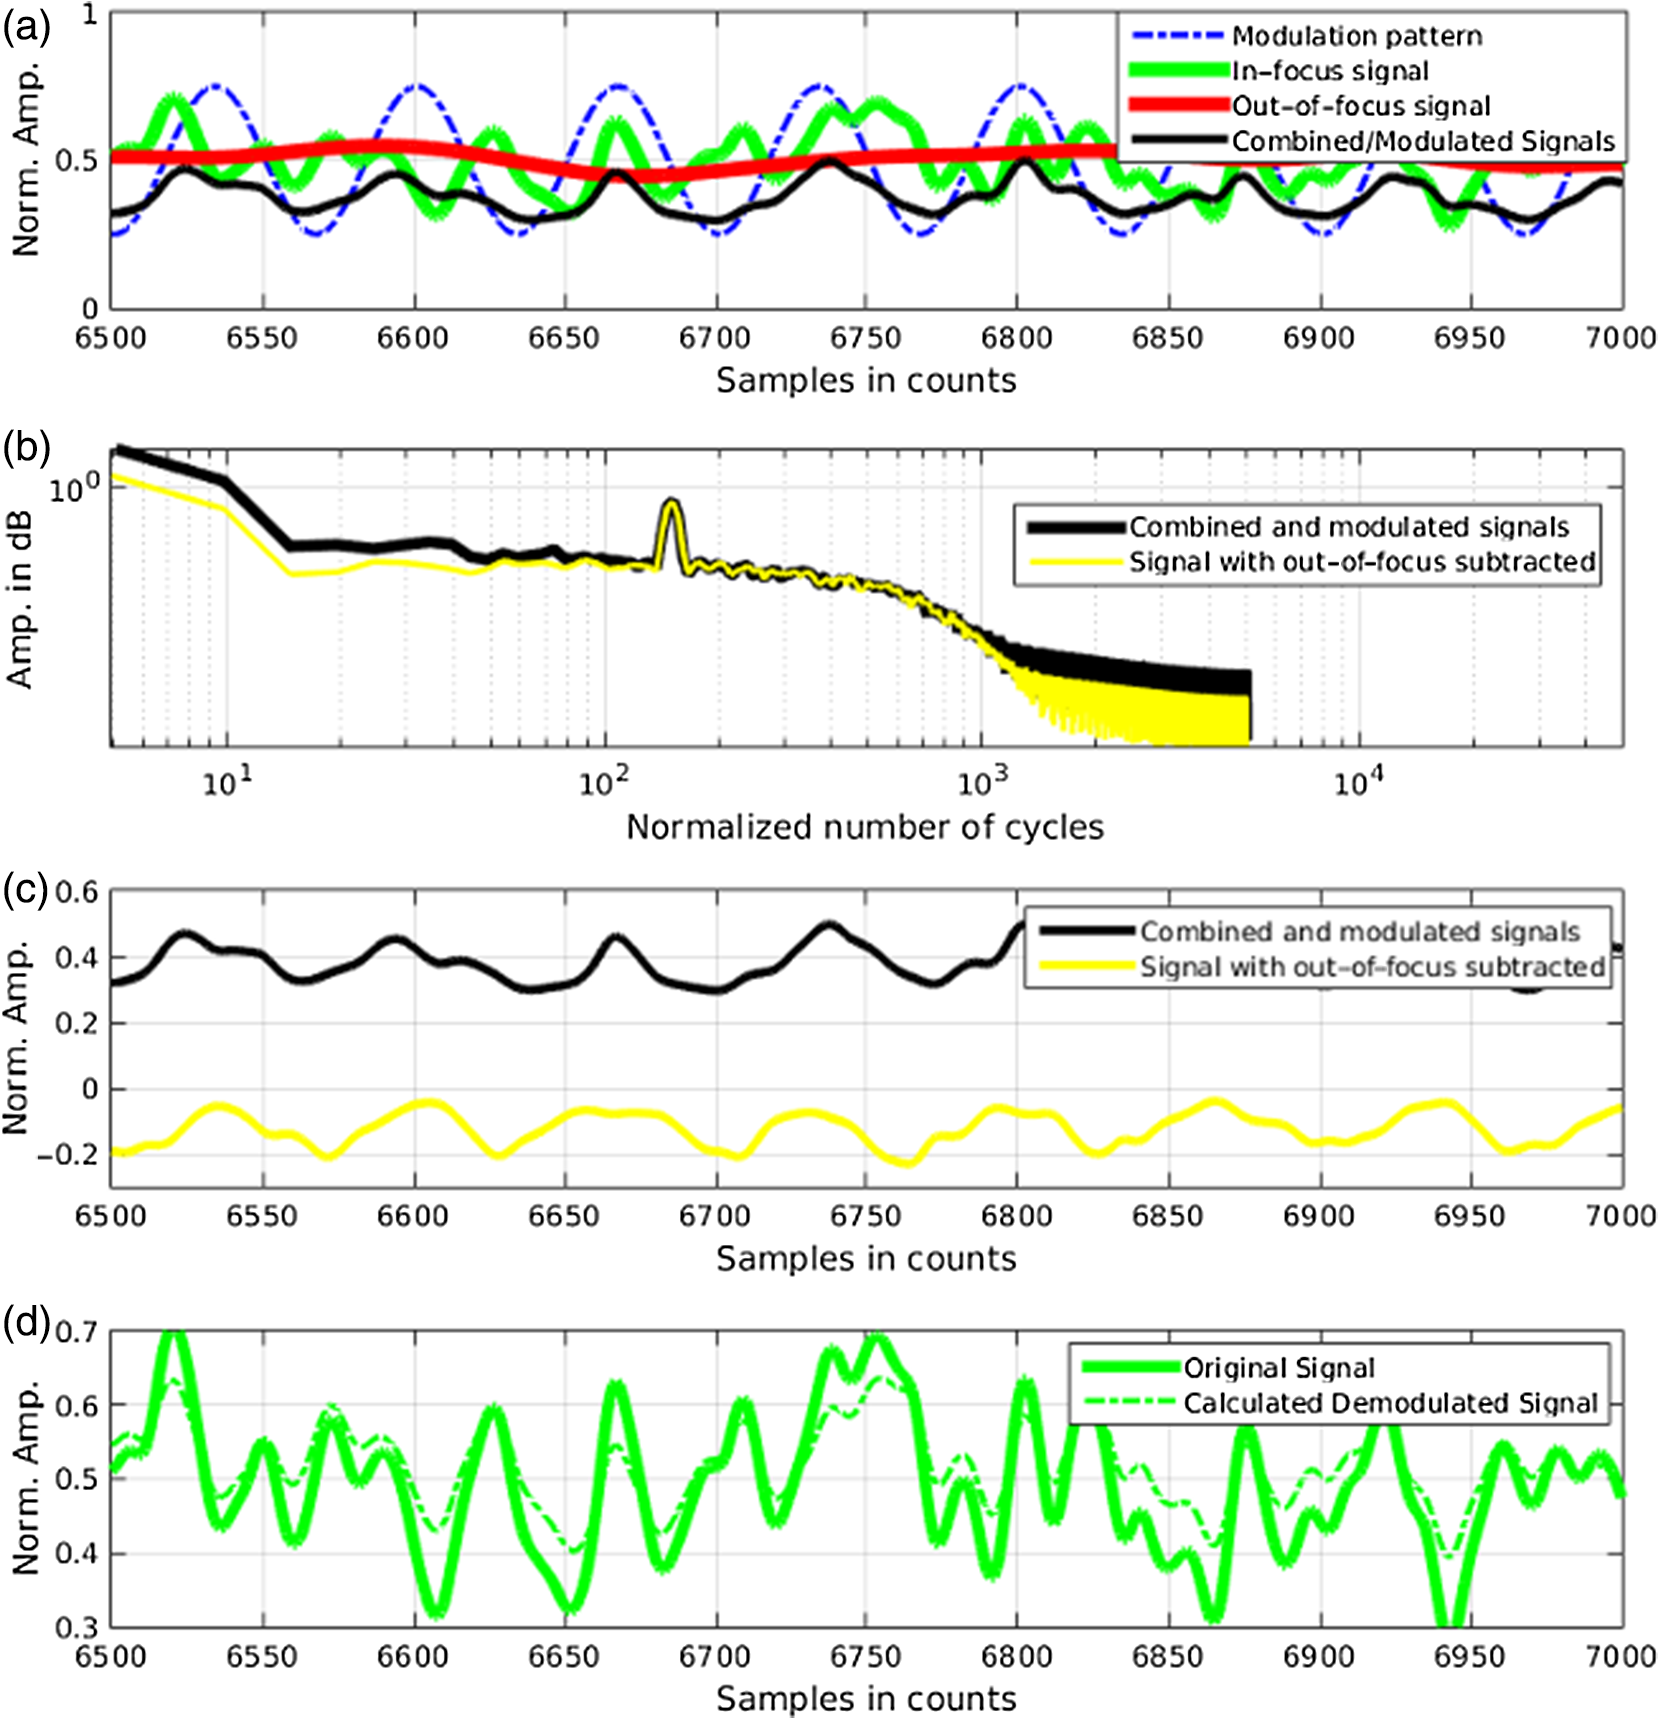 To simulate some error, we couple about 2% modulation into the out-of-focus light to visualize how small errors, such as imperfect focusing, will impact the final reconstruction. At the extremes, 100% of the modulation pattern would exist in the out-of-focus signal, making it impossible to decouple the two signals, thus, producing no sectioning at all, whereas as an error of 0% would produce a perfect reconstruction, with infinitely small sectioning resolution. Here, the small error is used to ensure that our simulation accurately models these imperfections. The 2% value is intended to show a small amount of error expected in real-world data, while still demonstrating the accuracy of the simulation/technique. The in-focus and out-of-focus signals are then added together to construct the simulated signal, shown in black. The construction of the signal is thus where represents the fully modulated signal, which is composed of the modulated in-focus portion and partially modulated out-of-focus light.The modulated in-focus portion of the signal is recovered by subtracting the combined in-focus and out-of-focus signals, without modulation: The unmodulated portion, , can be independently measured without projecting a modulation pattern [simulated here, ] or estimated by filtering out the modulation pattern, as we will do later in this paper. In Eq. (4), we are left with the modulated in-focus portion of light. The in-focus section can then be reconstructed using the “Hilbert” function to demodulate the signal as follows: We have now successfully decoupled the in-focus light from the background. To show the accuracy of the technique, Fig. 2(d) shows an estimation of the in-focus light compared to the original signal. We note that there is some loss in accuracy due to modulation from some of the out-of-focus regions. This type of error will manifest itself as a loss of contrast, particularly in regions of high-spatial frequency. In the above simulation, was known and subtracted from the modulated signal. This can be achieved by measuring the signal twice: one measurement with modulation and one without. However, similar results can also be achieved with only one measurement, as will be shown in the next section. Rather than trying to measure the unmodulated signal, it is estimated by filtering out the modulated portion of the image. In both scenarios, this unmodulated portion is then subtracted from the modulated measurement. 2.4.Structured Illumination—Single Image ApproachBy projecting a high-frequency modulation pattern under planar illumination, at a plane conjugate to the CCD, all components of this plane are spatially shifted outside the broadband signal. This scattered out-of-focus light remains centered in the baseband of the spatial frequency domain due to the pattern being blurred outside of the focal plane. In Sec. 3.2, a method of decoupling the in-focus and out-of-focus signals, which can readily be adapted to this type of 2-D application, is described. Our algorithm, outlined in Fig. 3, describes the process required to separate the modulated and unmodulated images, producing a high-contrast sectioned image. In the interest of developing an optical sectioning system with the least number of samples required, we have extended this work to function using only a single sample. Using a single sample will prove to be extremely useful in real-time biological imaging. Specifically, motion artifacts can create constraints on any method that requires multiple samples of data for reconstruction. As long as there is minimal movement within the integration time of the frame, a single sample will suffice in producing high-quality sectioned images in vivo. Also, in comparison to the three-phase SIM, there is no need to finely align multiple phases of data, making our method particularly robust at depth. In the 1-D simulation, we directly measure the broadband signal without modulation. With this new method, only a single image, which contains both the in-focus and out-of-focus components and the modulation pattern, is measured. Using a combination of a low-pass filter and a notch filter, which are defined based on the frequency of the modulation pattern, the low frequency information from the out-of-focus light is estimated, as shown in Fig. 4. It should be noted that, for these experiments, a generic Gaussian filter is applied to eliminate the modulation pattern. However, the selection of this filter will differ depending on the frequency and angle of the modulation pattern applied, i.e., the region of data that will be filtered within the frequency domain. For our experimental data, the frequency () and angle (30 deg) are known ahead of time and can be tuned to filter out the first orders of the modulation pattern. From multiple experimental datasets, we have empirically selected a Gaussian filter with a full width, half max, of 10 cycles, providing the best sectioning results. This estimated unmodulated image can then be subtracted from the image, leaving only the modulated in-focus signal. As we described in Sec. 3.2, we apply the Hilbert transform using the spiral function technique to remove the modulation pattern from the in-focus signal. The result is a sectioned image that has been demodulated. Depending on how well is estimated, the success of the demodulation will vary; for instance, we may find some residual banding if the modulation pattern cannot be completely filtered out. However, it is shown that our method provides good sectioning over a wide variety of situations. 2.5.Experimental SetupA 635-nm LED with a line width of 17 nm was used as the light source. The patterns were projected onto the specimen using a TI Lightcrafter DMD. The images were then captured using an Allied Vision Guppy PRO F-125 CCD camera. The objective has a nominal magnification of in air with a NA of 0.25. When combined with the tube lens, the system has an overall magnification of . The configuration of the microscope is outlined in Fig. 1 and is used for all data captured throughout this paper. 3.ResultsTo show that this technique is comparable to ordinary SIM, we must be able to verify that we can accurately extract topographic and tomographic information. In cases of biological samples, such as skin imaging, we would like to isolate planes of focus located within the sample, which would otherwise be occluded by scattered light from surrounding layers. To test the topographic capabilities of the system, a paper card, which contains multiple layers of fibers positioned at various unknown depths, is imaged. Each single image result is compared against the typical three-phase sectioning method of SIM to ensure the accuracy of the results. A widefield image is also constructed by summing each of the three phase images together. This simulates an image of the specimen as it would be seen through a conventional microscope without any sectioning. Next, a tomographic phantom is constructed based on Glazowski and Zavislan.16 A 1951 Air Force resolution chart is placed below a piece of ground glass, which serves as a source of scattering. Between the two planes, ultrasonic gel with an index of refraction of 1.33 is used to simulate water contained within the skin tissue. 3.1.Single Image ResultsWe start by sectioning a business card, which contains multiple layers. To compare to the three-phase SIM, three total images are taken with phases of 0, 120, and 240 deg. Each image encompasses a region, with a square wave modulation pattern of frequency projected at an arbitrary angle of 30 deg. The images are processed using Eq. (1) to produce the demodulated AC signal. Then, only a single phase image is processed using the Hilbert technique developed above. Figure 5 shows a comparison of the wide-field (a) versus the three image sectioning (b) and single-image sectioning (c). It is clear that both methods remove a great deal of light from the out-of-focus regions, isolating a single plane-of-interest. Additionally, the contrast is greatly improved in the remaining regions. There are some small artifacts in the single-image sectioning. Specifically, some banding remains from an imperfect estimation of the DC image. Additionally, there are some edge effects from the application of the Hilbert function. Taking the difference between the three-phase SIM and single-phase SIM, there are only small changes between images (, where the images are scaled from 0 to 1). However, on the whole, we produce a high-quality sectioned image, providing good isolation of a single plane, quite comparable to the three phase reconstruction. Furthermore, we have been able to produce this image with one-third the number of samples as required by traditional SIM, decreasing the measurement time from 150 to 50 ms. In this experiment, Fig. 6 quantifies the difference between the actual and estimated DC images, with the vast majority of pixels within a few percent (). Fig. 5Image of a business card at depth. (a) The widefield image with no sectioning is shown. (b) The three-phase SIM reconstruction is shown. (c) The single-image demodulation is shown.  Fig. 6DC images shown of the business card from Fig. 5, representing the out-of-focus portions of the card. Both (a) and (b) are scaled from 0 to 1. (a) The actual DC image taken without modulation pattern present. (b) The estimated DC image by filtering as described above. (c) Difference between the two images. The color bar on (c) represents the normalized difference between the two.  3.2.Image Results from Multiple DepthsBy building a z-stack from 25 individually processed images, a full map has been built of each specimen across a depth of at increments, as shown in Fig. 7. The same modulation frequency is used across all depths, where three phases are taken at each depth. These data can be used to verify the axial resolution and isolation of planes through the construction of a high depth-of-field (DoF) image. To show the extended DOF, we use a maximum intensity projection, which combines the pixels with the highest amplitude from each depth into a single image. This projection removes all scattered light and shows the entire specimen in focus along the -axis, helping to visualize the two-dimensional structure without any occlusion from the layer above or below the focal plane. For this data, we use the three-phase SIM as our ground truth and qualitatively compare it to our single image method. We should expect to see individual fibers existing on discrete planes, as well as continuity along each of the fibers. Reviewing Fig. 7, we see how well the single-image sectioning is able to section the image. It is clear that the fibers are well isolated from one another, on par with typical SIM methods. Figure 8 shows the structure of the fibers. Here, even the smaller fibers are retained providing good resolution and reconstruction of the card. When comparing the two height maps to one another, we find that all layers sectioned using the single-image technique are within . Similar to the single image above, the large DoF image matches within a few percent (, where the image amplitude is scaled from 0 to 1). 3.3.Sectioning Versus DepthAdditionally, we want to ensure that this method works at depth, even when the plane of interest is occluded by scattering layers above and below the plane of interest. To model skin imaging, we have built a phantom, as developed and demonstrated by Glazowski and Zavislan,16 for testing sectioning in highly scattering media. This phantom consists of a 1951 Air Force resolution chart at a depth of below a piece of highly scattering ground glass. The space between the target and the glass has been impregnated with a gel () to simulate water. The objective lens has been increased to ; otherwise, all other components of the optical setup are the same, as described in Sec. 3.5. As demonstrated in Fig. 9, the resolution chart was imaged using both the three-phase and single-phase SIM. In the widefield image (d), we see the structure present from the resolution chart below, but the contrast is low due to scattered light from the ground glass above. Reviewing the three-phase SIM, we notice that the sectioning is poor (e). This is likely due to small changes in the phases of the modulation patterns as it passes through multiple surfaces before reaching the focal plane.7,8 Because three images are used, sectioning is highly dependent on how well each of the three phases overlaps at the focal plane. Any changes in phase are liable to produce artifacts at the intended target. This can be slightly mitigated using additional phases or multiple random patterns, but at the cost of additional samples.9,17 For this experiment, the phase changes are likely due to differences in the optical path length from the rough surface of the ground glass above the target. However, with in vivo imaging, phase misalignment may be exacerbated by a host of factors, such as vibration, diffusion, and small changes in index of refraction, all of which can be overcome using our single-phase sectioning system. Fig. 91951 Air Force resolution target below skin phantom. The chart displays group 6, elements 2 to 6, which encompasses resolutions of to . The top row shows the single-phase reconstruction on each of three phases, (a) 0 deg, (b) 120 deg, and (c) 240 deg, demonstrating the effectiveness regardless of modulation phase. (d) Widefield image with strong cluttering from out-of-focus regions. (e) Three-phase sectioning exhibiting major distortions due to local phase shifts from turbid media. (f) Average of all three single phase images (a)–(c), providing additional noise reduction.  As expected, the single-phase sectioning provides much better resolution as it is much less sensitive to phase. Because the spiral function used for the Hilbert transform does not require a-priori knowledge, small deviations in the frequency or angle of the pattern do not negatively impact the sectioning. This results in a much more robust method of sectioning at depth. Figures 9(a)–9(c) show good contrast at the target, isolating a single plane from the scattered light. We show that the processing works regardless of the phase, as long as the modulation pattern is present [(a) 0 deg; (b) 120 deg; (c) 240 deg]. By taking the mean of all three phases after they have been individually processed, we see that there is a further improvement in noise reduction and contrast [Fig. 9(f)]. Figure 10 shows the contrast improvement, by taking a cross-section of the image along group 6, element 4, with a line width of [outlined in red in Fig. 9(d)]. There is a clear difference in the contrast of the signal as the scattered light from above the target has been removed. Note that there is a small trend along the resolution chart; this is due to slight nonuniformities in the lighting of our sample and is not related to the target itself. By calculating the relative contrast (max–min) for each cycle, there is a improvement in the vertical direction and a improvement in the horizontal direction. The three-phase sectioning has been left out as the bars are no longer resolvable at this depth. Fig. 10From Fig. 9, group 6, element 4, outlined in red, cross-sections along the (a) vertical bars and (b) horizontal bars are compared. The red line is taken from Fig. 9(d) and compared to the blue line taken from 9(f). This shows the contrast improvement and removal of DC signal using the single-phase sectioning. 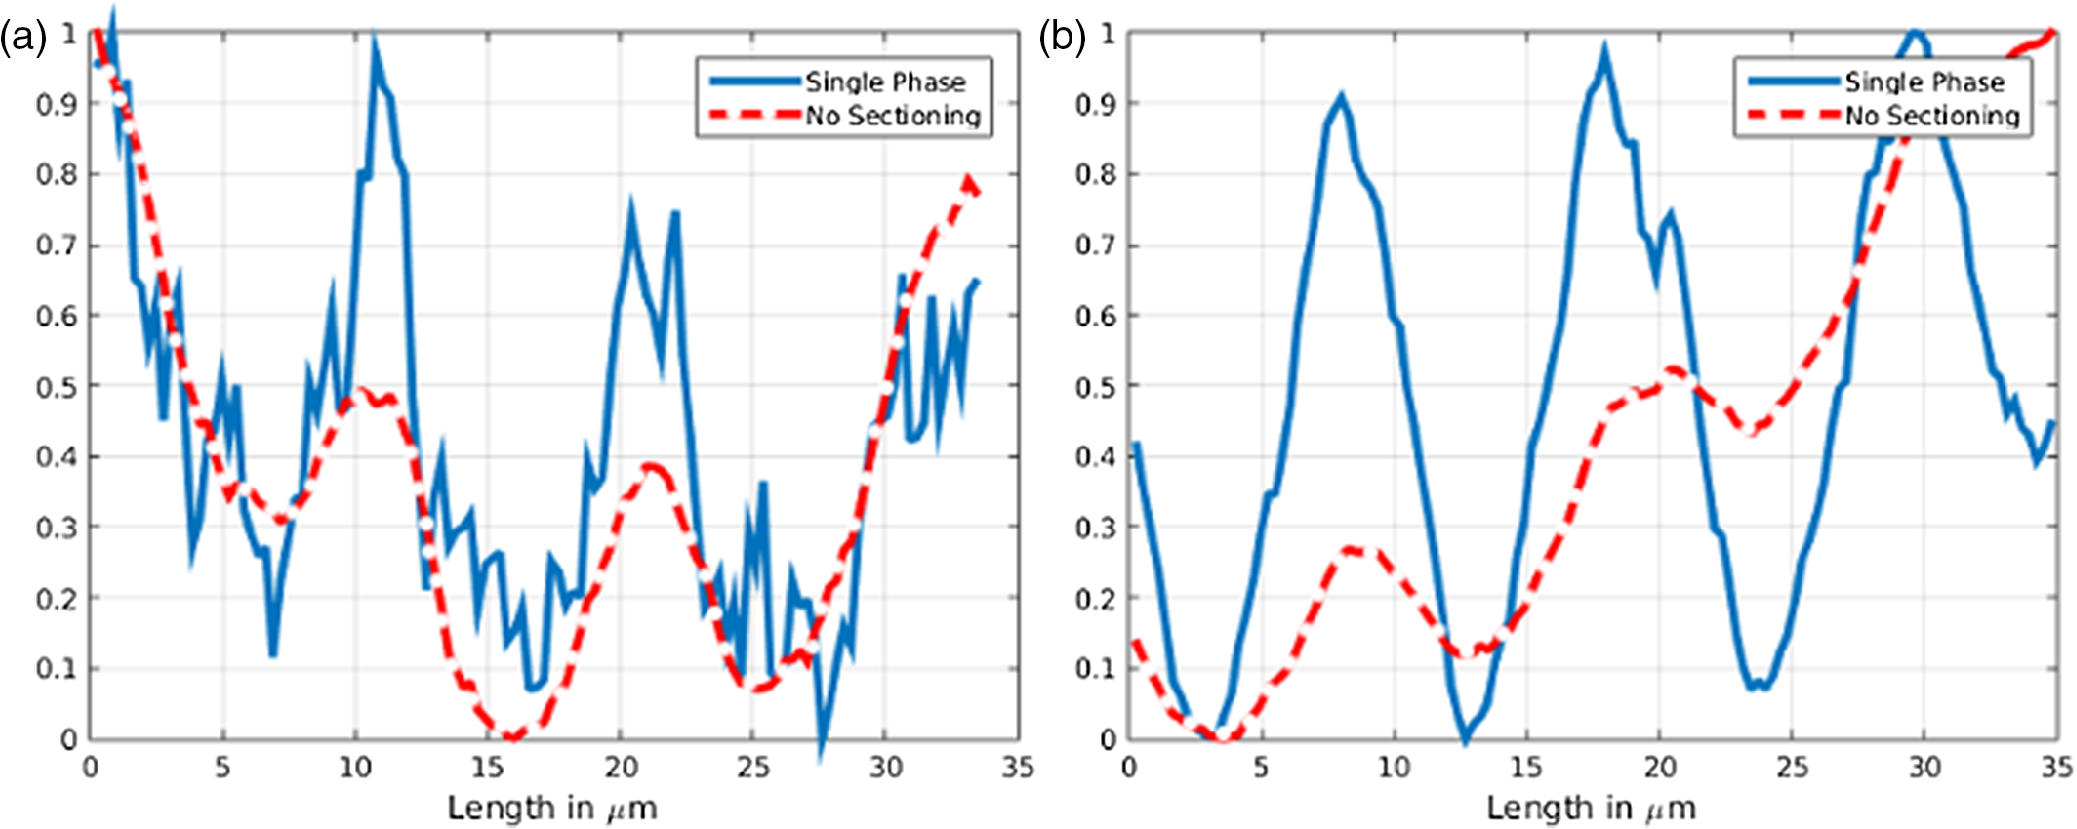 A measurement of the resolution chart was also taken at the surface () to verify that the system is diffraction limited (). We find that the minimum resolution at the surface is , which agrees with our expectations. As we attempt to image the chart at depth, there will be considerable resolution loss due to the scattering of light above the target. In Fig. 9(d), it can be seen that, without any sectioning, the resolution varies quite a bit but, at best, has a resolution of about (group 6, element 4, highlighted in red). Reviewing Fig. 9(f), it can be seen that the next element down (group 6, element 3) is now visible, having increased the lateral to . Therefore, at a depth of , we find there to be a loss of resolution. However, after sectioning, this can be modestly improved. 3.4.Three-Phase Structured Illumination Microscopy at DepthTo better understand why the three-phase sectioning suffers within a turbid media, we have imaged the square pattern on a mirror at the surface () and within our skin phantom (; Fig. 11). Taking the cross-sections, how the relative phase and frequency begin to diverge can be seen. The amplitude from the surface measurements (left) extends from 0.1 to , the total dynamic range of the camera, whereas at depth, the signal contrast is cut in half. As a result, the sectioning contrast of traditional SIM is greatly degraded, achieving a maximum amplitude of 0.5. Additionally, the phase of each signal is shifted slightly, creating a low frequency modulation, which does not actually exist on the mirror. As we attempt to image the pattern beyond , these errors are greatly exacerbated, rendering the final three-phase sectioned image nearly useless. The alignment of these patterns is critical for the success of the three-phase SIM. However, our single-phase technique is robust to small changes in frequency and phase and, therefore, produces high-quality sectioning in these scenarios. 3.5.Sectioning Biological SamplesTo further validate the method, sectioning was applied to a number of biological samples, including onion cells and in vivo to the skin of a human arm. Again, a square modulation pattern of is projected horizontally to modulate the image. Two layers of onion cells were placed directly on top of one another. The system was focused at the top layer of cells, as shown in Fig. 12. The widefield image [Fig. 12(a)] shows multiple cells aligned diagonally across the image. Scattered light from the cells below the surface can be seen in the image. The single-image sectioning [Fig. 12(c)] works in removing the scattered light from below. However, there are strong banding artifacts due to an imperfect demodulation. This imperfect demodulation comes as a result of data loss, where the patterned light goes to zero. This banding is exacerbated by choosing a low frequency modulation pattern. A higher frequency pattern would produce more uniform sectioning; however, it would decrease our sectioning depth. In clinical application, adjusting the frequency of the modulation pattern relative to the imaging depth might be worth considering. Adding in the other two phases ameliorates this issue by filling gaps of data loss. By processing the other two phases and adding them together [Fig. 12(d)], we see that the results are nearly identical to the three-phase sectioning [Fig. 12(b)]. In comparison to the traditional three-phase SIM, the results show that similar sectioning and resolution can be achieved through the methods developed above. Fig. 12Two layers of onion cells. This figure shows the top layer (). Scale bar is . (a) Widefield image from adding all three phases. (b) Traditional three-phase sectioning. (c) Single-phase sectioning using Hilbert demodulation. (d) Three images sectioned using Hilbert demodulation then added together.  One particularly strong advantage of our method is the robustness of sectioning within a turbid media. Figure 13 shows the layer of onion cells about below the cells, as shown in Fig. 12. The scattered light from the cells above can be seen clearly in the widefield image (A). Again, the single-image sectioning (C) produces high-quality sectioning with only minimal artifacts. When adding all three phases together (D), the advantages over the traditional SIM method (B) can be seen; first, many artifacts in traditional SIM can be seen around the edges, reducing total contrast within the image. Additionally, there is some residual modulation pattern within the image. After the sectioning is applied, the two layers are completely separated from one another. Given that onion cells have a thickness of to , this experiment demonstrates that our axial resolution is . Fig. 13Two layers of onion cells, this figure shows the bottom layer (). Scale bar is . (a) Widefield image from adding all three phases. (b) Traditional three-phase sectioning. (c) Single-phase sectioning using Hilbert demodulation. (d) Three images sectioned using Hilbert demodulation then added together.  Finally, we apply our sectioning method directly to in vivo sectioning of human skin. The results are shown in Fig. 14. The widefield image shows very little detail as there is a great deal of scattering. Given the frame rate (21 Hz) of the camera, there is motion from frame to frame. The motion results from many factors including muscle twitches beneath the skin, as well as larger movements due to breathing and heartbeats. Due to all of this motion, the traditional three-phase imaging (B) is completely distorted. The differencing scheme relies on only the modulation changing phase but does not account for motion within the specimen itself. With the specimen changing location over the three frames, the result does not contain useful information. Reviewing Fig. 14(b), only highly reflective portions of the image are seen in the processed image. However, there is no indication of structure, such as nuclei, which would present themselves as dark circles within the tissue. This is an important detail as even minor changes in position of the pattern can result in major degradation of the sectioned image. Fig. 14Human skin cells imaged at a depth of . Scale bar is . All images are normalized and scaled from 0 to 1. (a) Widefield image from adding all three phases. (b) Traditional three-phase sectioning, greatly distorted by motion artifacts. (c) Single-phase sectioning using Hilbert demodulation. (d) Three images sectioned using Hilbert demodulation then added together. Arrows are superimposed on (c) and (d) to show the nucleus of the cells within the granular layer of the skin.  Applying the single-image processing (C) provides good sectioning and contrast of the cells below the surface. Here, we can see the granular layer of the skin, where the dark spots (shown by the superimposed arrows) point out the nucleus of the cells. The depth, dimension, and relative sizes appear to agree with those shown by Rajadhyaksha et al.4 Furthermore, the three phases can be added together (D) to increase the contrast of the image. For images that contain motion, the contrast is improved. As compared to the differencing method (B), there are only minor motion artifacts; otherwise, the method is much more robust to small changes in the pattern position. To show the motion frame to frame, Fig. 15 plots an RGB map of the three images used in Fig. 14(d). At the bottom left edges of the structures within the image, the color is predominately red. The red represents the first frame in the stack and shows that only some of the cells are in this location for a moment. By the third frame (shown in blue), the cells have shifted toward the upper right corner. It can be seen that within those three frames, the subject moved a few microns diagonally, resulting in an imperfect reconstruction of the multiframe sectioning techniques. 4.ConclusionTraditional structured illumination has provided a strategy for producing optical sectioning when compared to confocal microscopy. However, limitation in overall speed still restricts its absolute application in biological imaging. Here, it is shown that, using the Hilbert transform, optical sectioning can be produced using only a single image. The sectioning works well for extracting 3-D information about highly structured material, as well as subsurface objects within a highly turbid media. Through a number of experiments, we have shown that the methods developed are able to provide both lateral and axial information about a specimen. Additionally, we can isolate the plane of interest with similar quality, or in turbid media, better than that of the typical three-phase SIM, as shown in the experiments above. These results improve further when there is a component of motion, which would otherwise misalign the phases of the modulation pattern in the traditional three-phase SIM. More importantly, the processing algorithm only relies on one frame of data, limiting the overall speed to the integration time of the camera. This opens up the possibility of using fast imaging, which relies on stroboscopic light sources, which previously were incompatible with SIM. The process now allows for real-time confocal imaging on biological samples. Additionally, we have shown that within a turbid medium, the sectioning ability far exceeds that of traditional SIM, greatly enhancing its resolution at depth and making in vivo applications possible. The algorithm described in this paper takes SIM one step closer to producing high-contrast images at depth, approaching the quality of confocal with the advantage of sectioning in real time. Using structured illumination for sectioning within turbid media has always been difficult due to loss of contrast and the need for exact alignment of phases. As a result of this and the need for multiple images to produce high-quality sectioning, SIM has never been a serious tool in skin imaging. However, the methods we have developed in this paper overcome many of these limitations, taking SIM much closer to producing confocal like images. Using only a single frame, we have shown that high-quality sectioning can be produced even within tens of microns deep within highly scattering media, such as skin. This method makes SIM a powerful new tool for in vivo and real-time imaging of biological samples. AcknowledgmentsThe authors would like to thank Kyle Nadeau, Will Goth, Joseph Hollmann, Guoan Zheng, and Kaikai Guo for their input on the paper. This work was done in part under and NSF grant from the Division of Chemical, Bioengineering, Environmental, and Transport Systems (CBET); Award No. 1510281. ReferencesM. Haftek,
“Compartmentalization of the human stratum corneum by persistent tight junction like structures,”
Exp. Dermatol., 20
(8), 617
–621
(2011). http://dx.doi.org/10.1111/exd.2011.20.issue-8 EXDEEY 0906-6705 Google Scholar
M. A. A. Neil et al.,
“Method of obtaining optical sectioning by using structured light in a conventional microscope,”
Opt. Lett., 22
(24), 1905
–1907
(1997). http://dx.doi.org/10.1364/OL.22.001905 OPLEDP 0146-9592 Google Scholar
M. G. L. Gustafsson,
“Surpassing the lateral resolution limit by a factor of two using structured illumination microscopy,”
J. Microsc., 198
(2), 82
–87
(2000). http://dx.doi.org/10.1046/j.1365-2818.2000.00710.x JMICAR 0022-2720 Google Scholar
M. Rajadhyaksha et al.,
“In vivo confocal scanning laser microscopy of human skin: melanin provides strong contrast,”
J. Invest. Dermatol., 104
(6), 946
–952
(1995). http://dx.doi.org/10.1111/1523-1747.ep12606215 Google Scholar
M. J. Booth,
“Adaptive optics in microscopy,”
Philos. Trans. R. Soc. A, 365
(1861), 2829
–2843
(2007). http://dx.doi.org/10.1098/rsta.2007.0013 Google Scholar
M. Arigovindan, J. W. Sedat and D. A. Agard,
“Effect of depth dependent spherical aberrations in 3D structured illumination microscopy,”
Opt. Express, 20
(6), 6527
–6541
(2012). http://dx.doi.org/10.1364/OE.20.006527 OPEXFF 1094-4087 Google Scholar
J. G. McNally et al.,
“Artifacts in computational optical-sectioning microscopy,”
J. Opt. Soc. Am. A, 11
(3), 1056
–1067
(1994). http://dx.doi.org/10.1364/JOSAA.11.001056 Google Scholar
Z. R. Hoffman and C. A. DiMarzio,
“Structured illumination microscopy using random intensity incoherent reflectance,”
J. Biomed. Opt., 18
(6), 069803
(2013). http://dx.doi.org/10.1117/1.JBO.18.6.069803 JBOPFO 1083-3668 Google Scholar
K. G. Larkin, D. J. Bone and M. A. Oldfield,
“Natural demodulation of two-dimensional fringe patterns. I. General background of the spiral phase quadrature transform,”
J. Opt. Soc. Am. A, 18
(8), 1862
–1870
(2001). http://dx.doi.org/10.1364/JOSAA.18.001862 JSDKD3 Google Scholar
K. G. Larkin,
“Natural demodulation of two-dimensional fringe patterns. II. Stationary phase analysis of the spiral phase quadrature transform,”
J. Opt. Soc. Am. A, 18
(8), 1871
–1881
(2001). http://dx.doi.org/10.1364/JOSAA.18.001871 JSDKD3 Google Scholar
K. P. Nadeau, A. J. Durkin and B. J. Tromberg,
“Advanced demodulation technique for the extraction of tissue optical properties and structural orientation contrast in the spatial frequency domain,”
J. Biomed. Opt., 19
(5), 056013
(2014). http://dx.doi.org/10.1117/1.JBO.19.5.056013 JBOPFO 1083-3668 Google Scholar
T. D. O’sullivan et al.,
“Diffuse optical imaging using spatially and temporally modulated light,”
J. Biomed. Opt., 17
(7), 0713111
–07131114
(2012). http://dx.doi.org/10.1117/1.JBO.17.7.071311 JBOPFO 1083-3668 Google Scholar
D. J. Cuccia et al.,
“Modulated imaging: quantitative analysis and tomography of turbid media in the spatial-frequency domain,”
Opt. Lett., 30
(11), 1354
–1356
(2005). http://dx.doi.org/10.1364/OL.30.001354 OPLEDP 0146-9592 Google Scholar
D. J. Cuccia et al.,
“Quantitation and mapping of tissue optical properties using modulated imaging,”
J. Biomed. Opt., 14
(2), 024012
(2009). http://dx.doi.org/10.1117/1.3088140 JBOPFO 1083-3668 Google Scholar
C. E. Glazowski and J. Zavislan,
“A coherent model for turbid imaging with confocal microscopy,”
Biomed. Opt. Express, 4
(4), 500
–513
(2013). http://dx.doi.org/10.1364/BOE.4.000500 BOEICL 2156-7085 Google Scholar
E. Mudry et al.,
“Structured illumination microscopy using unknown speckle patterns,”
Nat. Photonics, 6
(5), 312
–315
(2012). http://dx.doi.org/10.1038/nphoton.2012.83 NPAHBY 1749-4885 Google Scholar
BiographyZachary R. Hoffman is a PhD candidate at Northeastern University where he works in Professor Charles DiMarzio’s lab. His research focuses on developing and improving methods of structured illumination microscopy for resolving subsurface information in-vivo. He is also working as an engineer at Draper Laboratory, developing light based inertial sensors. Charles A. DiMarzio holds degrees from the University of Maine, WPI, and Northeastern University. After 14 years at Raytheon Company in coherent laser radar, he joined Northeastern University. He is an associate professor of electrical and computer engineering, mechanical and industrial engineering, and bioengineering in Northeastern University. He is the author of a textbook, Optics for Engineers. His interests include confocal microscopy, structured illumination, and the interaction of light and sound. |