|
|
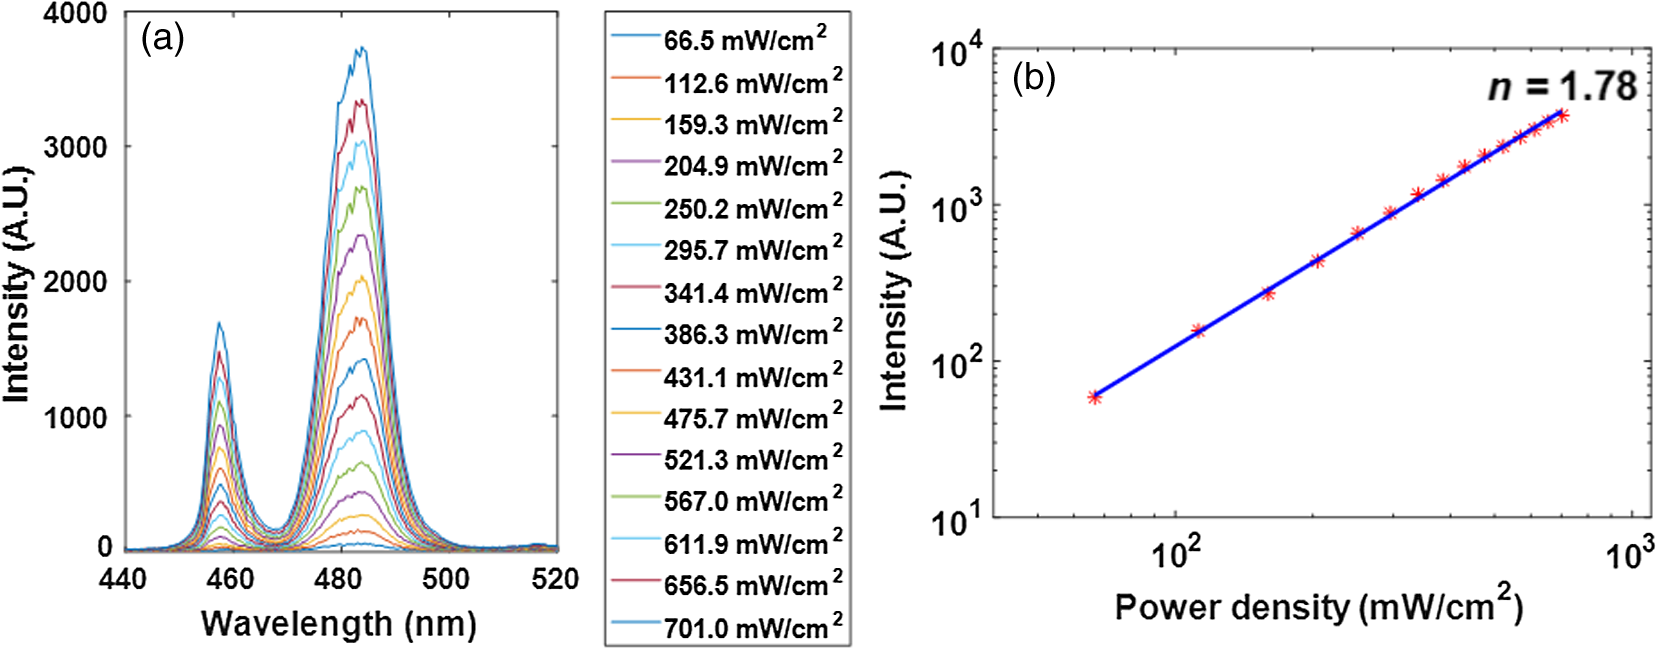
1.IntroductionDental caries is one of the most prevalent oral diseases throughout the world.1 Typical treatment of a carious lesion comprises the removal of caries and then placement of a filling with composite material into the tooth. In cases where the caries are too deep and the pulp tissue is already inflamed or necrotic, a root canal treatment is performed to eliminate the infection. In both dental filling and endodontic therapy, one major concern is to kill harmful bacteria while protecting the decontaminated tooth from future microbial invasion. However, therapy may still fail even when following the highest standards of surgery.2,3 Multiple factors can influence the success rate of dental restoration. For instance, inappropriate fillings could lead to bacteria infiltrating into the deep parts of the tooth, causing secondary infections. Hence, it is necessary to assess the distribution of dental fillings to ensure that the hollow space created during surgery is filled appropriately. Even though X-ray radiography is conventionally used, unfortunately it cannot provide definite information to dentists3 as it only displays two-dimensional (2-D) projections along the X-ray beam. Cone beam computed tomography (CT) can overcome this issue by providing improved detection and three-dimensional (3-D) panoramic views of dental fillings. However, it still has limited use due to its increased cost and hazard risks associated with radiation exposure near sensitive organs such as the head and neck.4 Hence, there is a strong drive to develop noninvasive modalities that can assess the 3-D functional and structural status of dental specimens. Over the last two decades, optical modalities have been widely investigated for dental applications. For instance, confocal microscopy5 and optical coherence tomography6 have been employed to detect dental lesions. However, none of these modalities have been tested to monitor the status of dental fillings. This is mainly due to their limited probing depth, which prevents these modalities from assessing the tooth in its entirety. Conversely, we have recently demonstrated that mesoscopic fluorescence molecular tomography (MFMT) can accurately retrieve the biodistribution of fluorescence inclusions deep inside teeth.7 This was performed using ex-vivo samples and a near-infrared (NIR) contrast agent. Hence, MFMT can potentially provide means to assess the distribution of fluorescently labeled dental restoration fillings, including inert materials that fill the root canal after canal enlargement and cleaning. However, this approach is still limited in assessing the completeness in filling the surgical cavity. If bacteria are left in the cavity, secondary infection is likely to occur. Therefore, there is a need to develop molecular approaches that can both report on the status of the fillings as well as kill the remaining bacteria. It is well established that exposure to blue light even at relatively low levels can kill bacteria.8,9 However, irradiation of deep tissues at such wavelengths is impractical due to the high attenuation of dental tissues in the visible region. Thankfully, upconversion nanoparticles (UCNPs), a new generation of fluorophores, have the ability to convert NIR radiation with lower energy into visible radiation with higher energy via a nonlinear optical process. Unlike widely-used linear dyes, UCNPs have large anti-Stokes shifts, which means that upon NIR irradiation, UCNPs can emit multiple colors of light from the NIR to the ultraviolet (UV) regions. This property makes UCNPs an ideal theranostic agent for dental applications. For example, NIR emission can be employed to indicate the dental fillings’ status due to its long penetration depth while blue or UV emission can locally kill the residual bacteria.10 Moreover, UCNPs offer additional benefits, such as reduced autofluorescence background,11 no photobleaching, and a sharp emission band.12 In particular, the characteristic of reduced autofluorescence background is attractive since teeth (dentin or enamel) exhibit multiple autofluorescence bands13 that could lead to suboptimal reconstructions.11 Furthermore, using UCNPs as imaging contrast agents may increase the resolution attainable when performing fluorescence diffuse optical tomography.14 Herein, we investigate the potential of using UCNPs as a contrast agent in dental applications. We developed a continuous wave transmission optical tomography system with 975-nm excitation and acquisition in the NIR (800 nm) and visible (480 nm) regions to observe the status of dental fillings ex vivo. In this preliminary study, in silico and ex vivo experiments based on anatomically accurate phantoms derived from a real tooth sample were employed to investigate the performance of various spectral emissions of UCNPs in optical tomography. This simplistic experimental model is a first step toward real anatomical geometries that should include all the jaw components for chairside applications. Within this limitation, our ex vivo and in silico experimental results demonstrate that it is possible to acquire optical signals both in the visible and NIR regions in dental samples and that tomographic reconstructions with high accuracy are feasible when using UCNPs, as validated via coregistration with micro-computed tomography (micro-CT). 2.Materials and Methods2.1.Upconverting NanoparticlesIn the last decade, there has been increased interest in using UCNPs for sensing, imaging, and/or as photoactivating fluorescent agents.15–17 UCNPs are nanoscale particles that have the unique ability to absorb two or more incident photons of low energy and emit one with higher energy. Hence, UCNPs may potentially facilitate deep tissue applications since they can be excited in the infrared and emit in the visible or UV spectral bands. This upconversion process results in large Stokes shifts, multiple sharp emission bands, low autofluorescence, and very limited photobleaching. Herein, we selected a commercially available Lanthanide-doped UCNP for use. Lanthanide-doped UCNPs are dilute guest host systems in which lanthanide ions function as guests in the lattice of the host.18 Selection of different lanthanide ions and synthesizing methods will make UCNPs emit different colors of light, from NIR to UV. One advantage of UCNPs is that the excitation of particles does not need high power or use of a pulsed laser, in contrast to multiphoton dyes.19 Briefly, the sensitizer ions, such as Ytterbium, will capture multiple incident low energy photons and transfer the energy to activators, such as thulium or erbium, which will emit high energy photons. In contrast to normal fluorescence dyes, the relationship between the emission intensities and the power of excitation is nonlinear and can be expressed as follows: In Eq. (1), represents the intensity of emission light and is the power of incident light. is the power-dependent index of UCNPs, which will depend on the selection of ions, emission band, structure of UCNPs, etc.18 The mechanism of the upconversion process is complex and beyond the scope of this manuscript; the reader can refer to Refs. 2021.–22 for more details. In our experiment, one UCNP (sodium yttrium fluoride, ytterbium and thulium doped, NaY0.77Yb0.20Tm0.03F4, Sigma-Aldrich, United States) was employed as an optical contrast agent. The UCNPs are a white powder with particle size less than that can be easily and uniformly suspended in dental fillings or resin. To estimate the power-dependent index of UCNPs, a 975-nm laser diode (L975P1WJ, Thorlabs, United States) mounted to a TCLDM9 (Thorlabs), controlled by a current driver (LDC200C, Thorlabs) and temperature controller (TED200C, Thorlabs), was used as the excitation source. The laser output was collimated to form an illumination spot with a radius of 4 mm. The laser power was controlled to generate illumination power densities ranging from up to [see Fig. 4(a)]. A bandpass filter (FGB37M, Thorlabs) was employed to filter out the excitation light. The emission light of the UCNPs was coupled to an optical fiber that was connected to the spectrometer (USB 2000, Ocean Optics). The power of the excitation light was monitored by an optical power meter (S310C, Thorlabs). Double logarithm plots were employed to determine the power-dependent index, as shown in the following sections. 2.2.Teeth Phantom PreparationTo mimic dental restoration after therapy, extracted teeth were acquired from local dentists with approval from Rensselaer Polytechnic Institute’s Institutional Biosafety Committee (IBC). Approximately three to four fiducial marks (shallow semispherical dents) were made in the apical part of mesiodistal root surface [see Fig. 1(a)]. The fiducial marks mainly have two functions: to perform rigorous registration between optical reconstructions and micro-CT images and to accurately pinpoint the irradiation point of excitation light. A simplified model in which a through hole with diameter 1.2 mm was drilled from the canal foramen to the pulp chamber was employed. A glass capillary with inner diameter 1.0 mm filled with optical contrast agents was then placed inside the cavity. The processed teeth were scanned by micro-CT (Medical Viva CT 40, Scanco, Switzerland) to obtain the anatomical structure [Fig. 1(b)]. In our experiments, micro-CT equipped with a microfocus cone beam X-ray source with tube voltage settings 70 kVp and current settings was employed. The resolution of the micro-CT was set to (voxel size ), which was suitable for our purpose. The overall micro-CT scanning time for one tooth was around to 30 min. In total, around to 400 slices were acquired for each tooth. Furthermore, the micro-CT images were then processed by ImageJ or MATLAB for k-means segmentation or binarization [Fig. 1(c)]. Finally, a tetrahedron-based mesh was generated based on the binary images from micro-CT using the precompiled computational geometry algorithms library [Fig. 1(d)]. Fig. 1Demonstrations of processing teeth. (a) Photograph of the teeth in which the red circle indicates the fiducial mark and the dashed blue box highlights the MFMT FoV; (b) one slice from a micro-CT image; (c) binary image of the same slice (b) with depiction of the illumination side and detection side (blue and green arrows, respectively; depiction not to size); and (d) mesh generated by the computational geometry algorithms library. 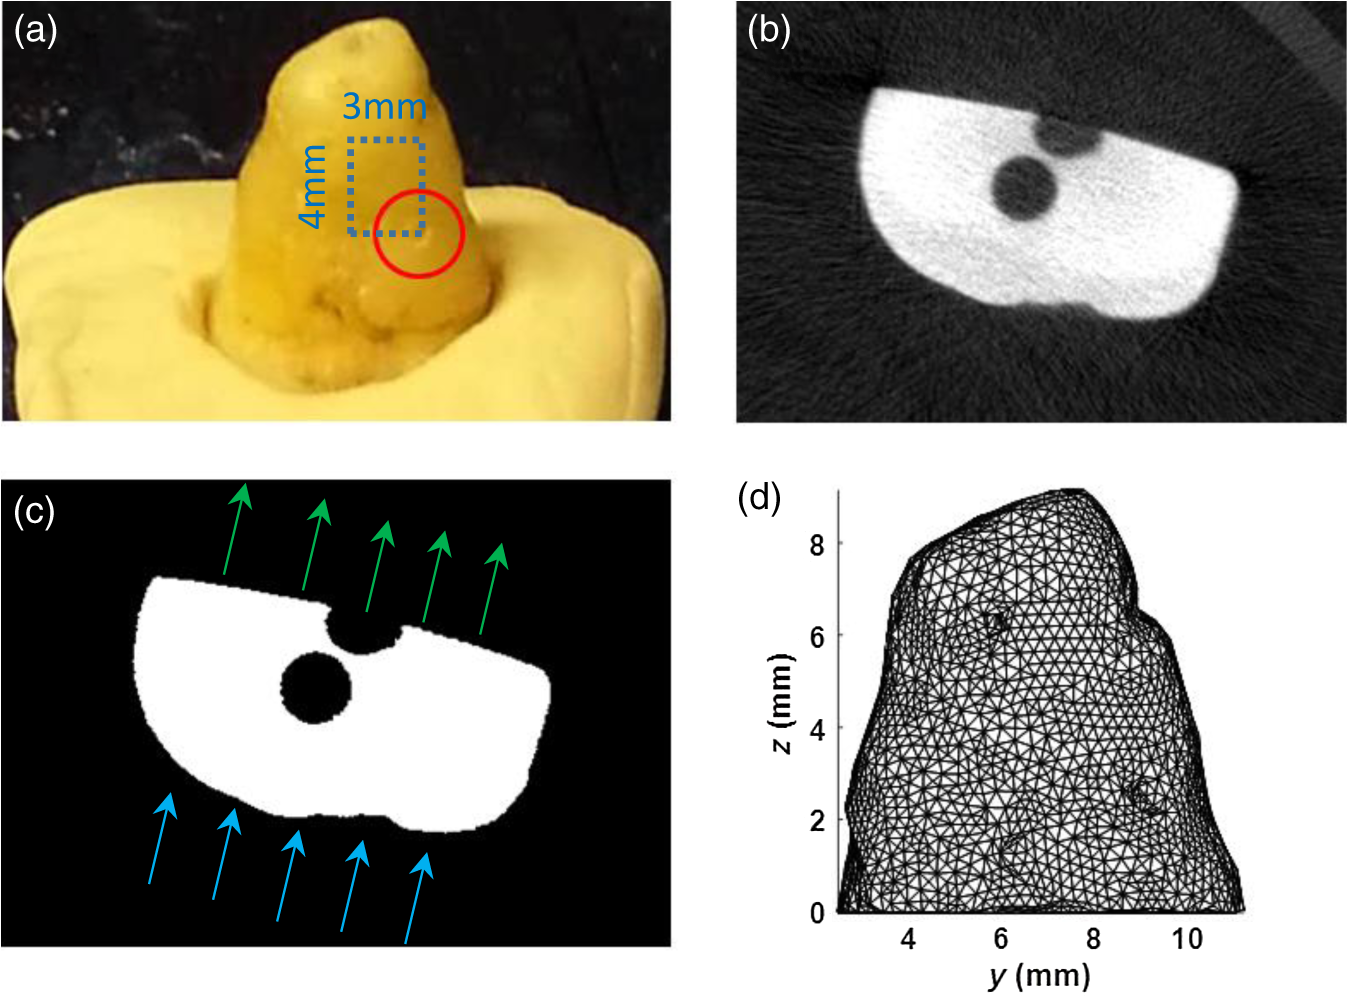 2.3.Optical SettingsThe system employed in the experiment was very similar to the MFMT system reported in Refs. 7 and 23, with two major modifications. First, transmission geometry was employed instead of the reflection geometry of MFMT, which means that the source and detectors were located at opposite sides of the object (see Fig. 2). This change in configuration was implemented because our previous MFMT configuration has limited detectable depth, typically between 3 and 5 mm.24 However, for chairside applications, the teeth are embedded into the jaw, leading to potential total thicknesses of .25 Second, an electron multiplying CCD (EM-CCD) camera was used instead of an avalanche photodiode array, leading to an increased number of measurements for improved resolution. A brief description of the whole system is provided below. Fig. 2Schematic of the system proposed in the manuscript. The red line represents excitation light (975 nm), whereas the blue line represents the upconverted emission light. 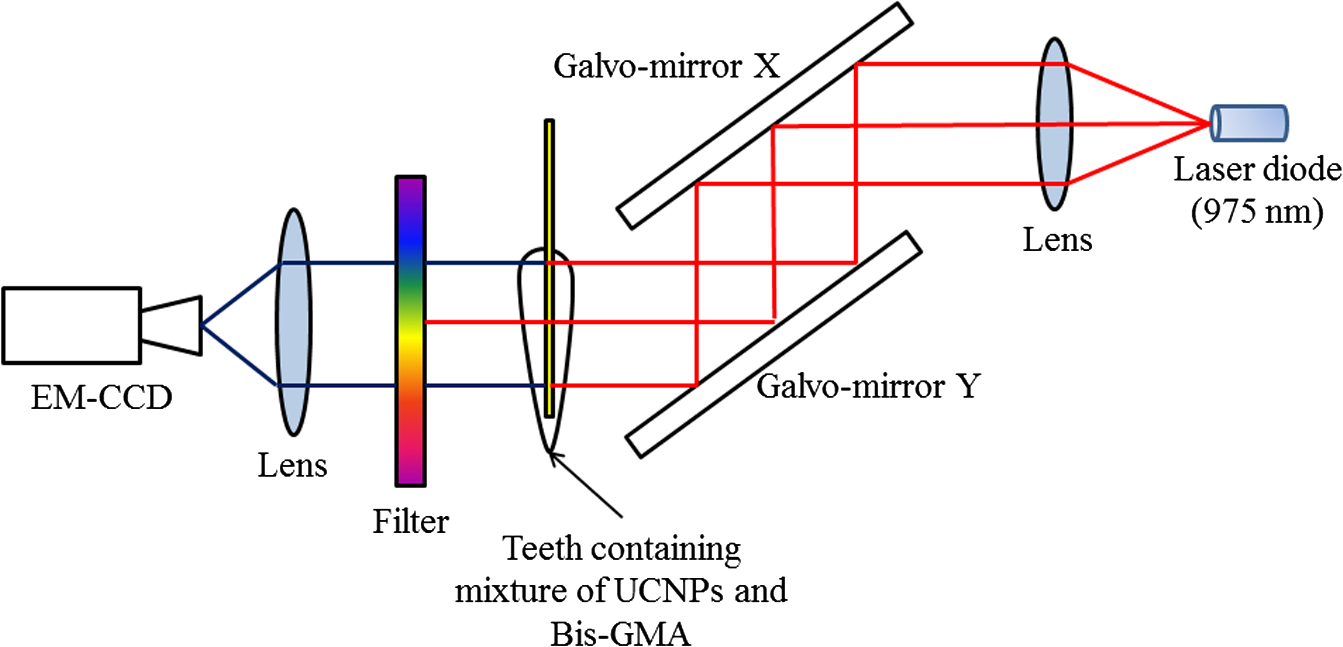 On the illumination side, a 975- or 658-nm excitation light (for use with UCNPs or linear dye) generated by the laser diode (L975P1WJ or L658P040, Thorlabs), controlled by the current controller (LDC200C, Thorlabs) and temperature controller (TED200C, Thorlabs), was fed into a 2-D galvoscanner system (GVS002, Thorlabs) and focused on the surface of the sample through an objective lens to yield a diameter illumination spot. On the detection side, the emission light (upconverted blue and NIR, or fluorescence emission) was captured by the EM-CCD (iXonEM+ 885, Andor) after passing through specific filters (FGB37M, Thorlabs or FF01-800/12-25, Semrock) and lenses. The field-of-view (FoV) was set to during the experiment. At each irradiation point, the galvoscanner would dwell 1 s before moving to the next position. 2.4.Optical ReconstructionIn our experiment, tetrahedron-based Monte Carlo (MC) simulations26 were employed to generate the Green’s function at each source and detector. The number of photons employed in the simulation was set to for each forward calculation. A forward-adjoint MC methodology was used to generate the sensitivity matrix.27 The Born normalized formulation was used to cast the inverse problem:28 In Eq. (2), and represent the Green’s functions at excitation (source) and emission (detector) wavelengths, respectively, and represents the distribution of the optical contrast agent (UCNP or linear dye). is defined as , in which and represent the acquired intensity data at emission (with optical contrast agent inside the object, irradiated by excitation light and with filter) and excitation (same conditions as emission except without the filter in place), respectively. Note that this formulation is very similar to the one used for classical NIR fluorophores (linear dyes) for which the power-dependent index is equal to 1 (for UCNP depending on the different components or synthesizing methods). Note also that no a-priori information on the location of the fluorescent heterogeneity, as could be derived from CT, was imparted in the inverse problem.29 After direct discretization of Eq. (2), the following depth-dependent adaptive Tikhonov regularization equation was obtained: with being the sensitivity matrix calculated by the forward-adjoint MC method [discretization of the integral in Eq. (2)], is the Tikhonov regularization parameter, which was first selected through -curve analysis30 and adjusted manually to obtain the best performance, is a diagonal matrix whose elements are the square root of the corresponding elements of the diagonal of , is the measurement vector, and is the distribution of optical contrast agent. When solving Eq. (3), the generalized minimum residue iterative solver was employed through the MATLAB built-in function (GMRES). The maximum number of iterations was set to 1000, and the error bound for the GMRES solver was . The calculations stopped when either criterion was met.2.5.In silico and Ex-vivo Experiment SettingsTo investigate the behavior of UCNPs, in silico experiments were first conducted. A real tooth model with anatomical structure obtained by micro-CT was employed as the phantom. A simulated cylinder filled with optical contrast agent was placed inside the tooth. To assess the effect of spatial sampling on the reconstruction quality, a series of simulations with a varied number of sources and/or detectors was performed. The detector sampling (associated with camera pixel selection) was set either to 70 or 105 [two sets of data—see Figs. 3(i) and 3(ii), left panel]. The distance between adjacent detectors was fixed to 0.5 mm, which means that 105 detectors would cover a larger area () than 70 detectors (). For the source sampling (associated with galvo scanner settings), with a fixed number of detectors, we increased the spatial density of illumination points while keeping the illumination FoV constant (). The different number of sources was implemented by adjusting the distance between adjacent sources along two dimensions. The number of sources was set to 15, 20, 25, 27, 35, 36, 45, and 63 [see Figs. 3(a)–3(h), right panel]. Fig. 3Source–detector configurations—left panel (blue): detector spatial location for (i) 70 and (ii) 105 sampling, respectively; right panel (green): source position for (a) 15, (b) 20, (c) 25, (d) 27, (e) 35, (f) 36, (g) 45, and (h) 63 total illumination points. The position of the source–detectors is overlaid on each external element of the tetrahedron-based mesh used for the forward and inverse calculations. 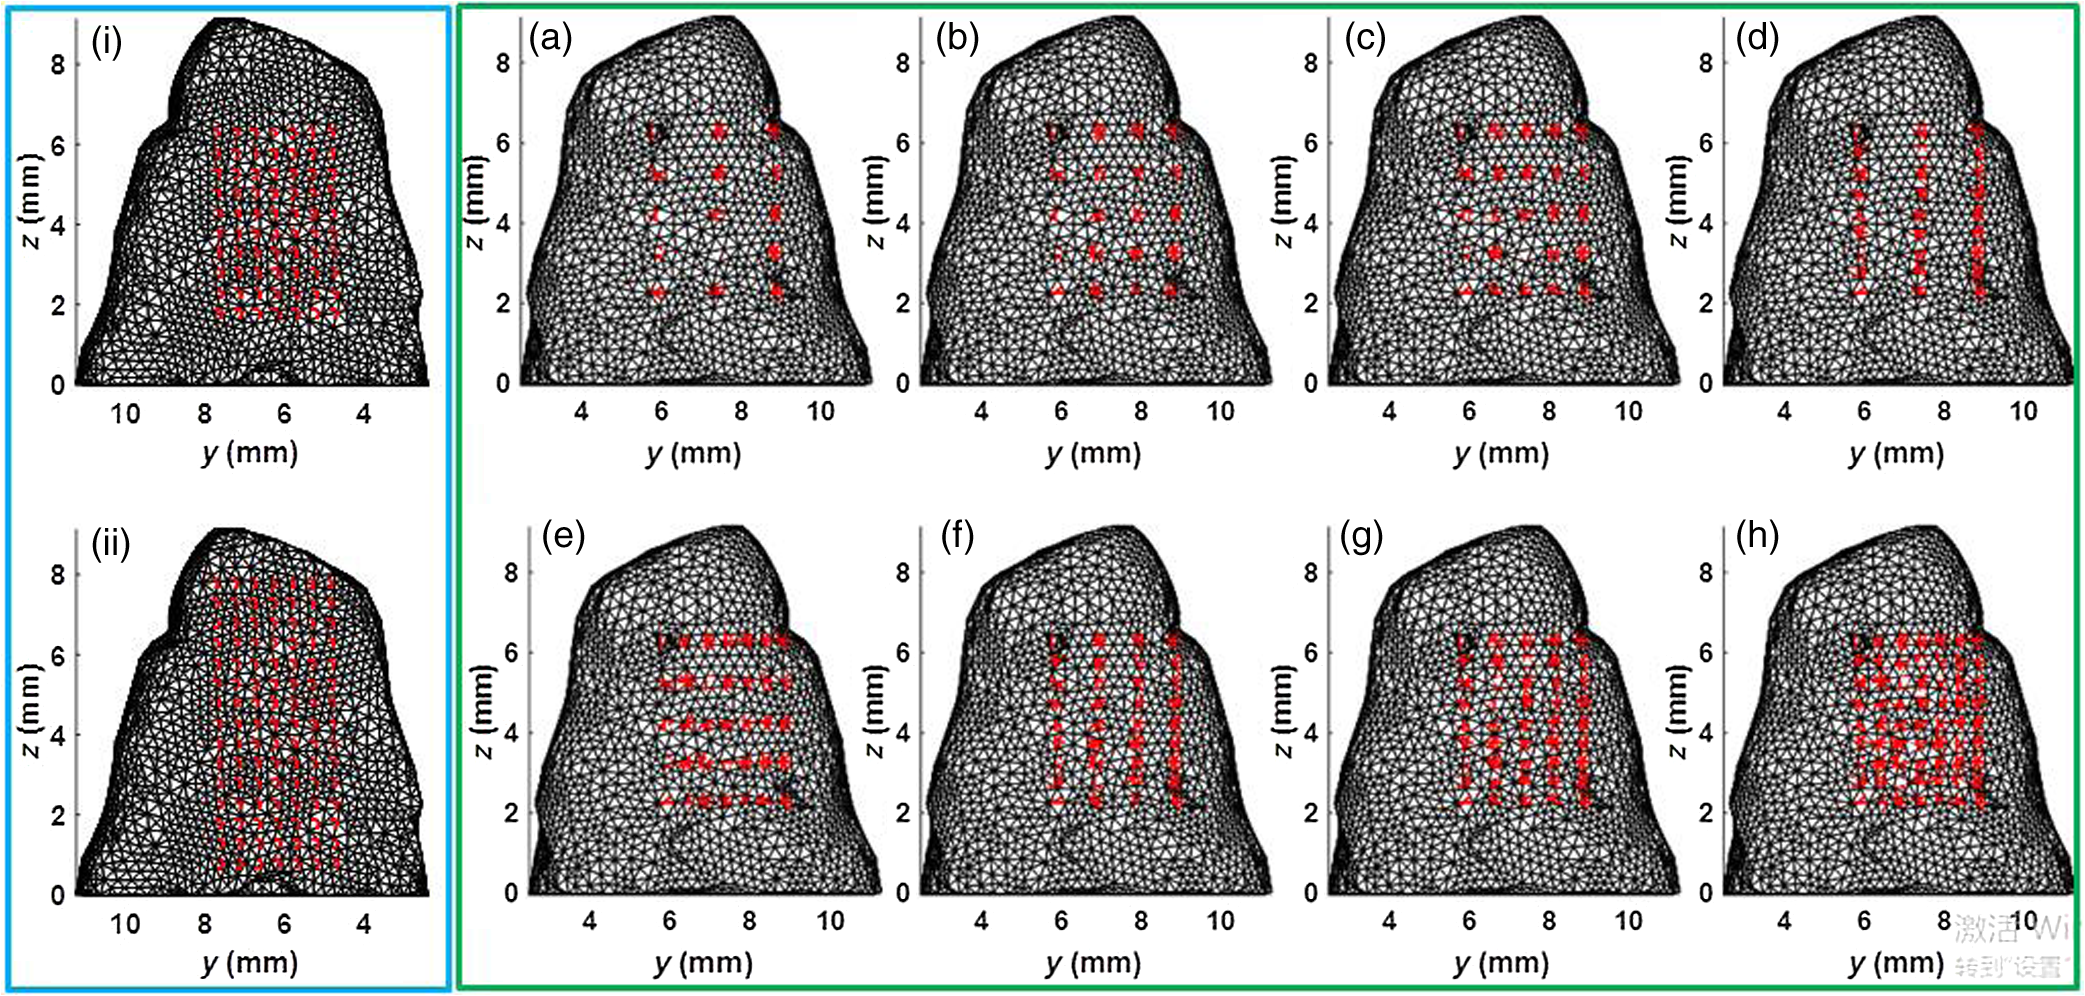 Reconstructions were performed for all the sampling settings described above and the fidelity of the inverse problem was assessed using two image-driven quantities. The first is the relative error between the volume of reconstruction and simulated volume within the FoV. The second metric is the absolute centroid error between the centroid of the reconstruction and the simulated object. The differences of centroid position along three dimensions were calculated first, and the largest one was employed as the absolute centroid error, namely . In the in silico study, the power-dependent index was set to typical values, which were for blue emission and for NIR emission. The average volume for the elements was set to , which sets the limit in resolution to around 0.1 mm. Overall, the imaging space was discretized into 32,242 nodes and 196,469 elements. The optical properties of the tooth were assumed to be homogenous over the sample and were set based on a literature review.31,32 The absorption coefficient of dentin was set to for all wavelengths. The scattering coefficient of dentin was set to at 975 nm and at around 800 nm.32 For the blue light, the scattering coefficient of dentin was set to .31 For all the simulations and experiments herein, the Henyey–Greenstein scattering function was employed and the anisotropy factor was set to , as reported in Ref. 31. Besides in silico experiments, ex vivo experiments were conducted with the same sample used to generate the synthetic phantom. Three optical contrast agent mixtures were tested: (1) pure UCNPs with blue and NIR emission, respectively (NaY0.77Yb0.20Tm0.03F4), (2) mixture of UCNPs and bisphenol A glycol dimethacrylate (Bis-GMA), 20% w.t. with blue emission and NIR emission, respectively, and (3) linear dye: Alexa Fluor 660 (Succinimidyl ester, ThermoFisher) in water. The synthesis of Bis-GMA can be found in Ref. 33. After thoroughly mixing UCNPs with Bis-GMA, the mixture was cured with irradiation. For each optical contrast agent, the transmitted intensity fields at excitation and emission were recorded sequentially by the EM-CCD and the appropriate spectral filter sets. In the ex vivo experiments, the number of sources was set to 63 and the number of detectors was set to 105 following the findings of the in silico investigation (see Sec. 3.2). Due to our mesh-based MC methodology, the optical reconstructions were seamlessly registered with anatomical structure obtained from micro-CT via affine registration algorithms (Amira 5.4.5, FEI), leading to a rigorous comparison between the two imaging modalities. As in the in silico experiments, relative volume error and absolute centroid error were calculated to assess the accuracy of optical reconstruction compared with the ground-truth obtained from micro-CT. 3.Results3.1.Determination of Power-Dependent Index for Upconversion Nanoparticles with Blue EmissionWe experimentally established the power-dependent index of our UCNPs by comparing illumination power density versus the relative UCNP emission intensity. The spectral UCNP emission as reported via spectrophotometry and for various illumination power densities is provided in Fig. 4(a). The blue spectral emission was integrated to yield the overall blue-emitted intensity, as depicted in Fig. 4(b). The experimental power-dependent index was estimated via the linear relationship between illumination power density and emitted intensity and was found to be . Hence, for all experimental reconstructions, a power-dependent index of was employed for the calculation of the forward model. 3.2.In Silico ExperimentsExamples of the sensitivity matrix as calculated by the adjoint mesh MC approach for the same source–detector pair but at different excitation and emission settings are provided in Fig. 5. A visual inspection of these profiles determines that the Jacobian associated with the blue emission of UCNPs [Fig. 5(a)] has the sharpest sensitivity profile despite being associated with the largest scattering coefficient. By contrast, the sensitivity profile of the linear dye [Fig. 5(c)] exhibits a more homogenous distribution and, hence, increased volume probed by the detected photons. However, when considering the full Jacobians and assessing their respective ill-posedness via their condition numbers and eigenvalue distribution [Fig. 5(d)], the linear dye outperforms the UCNPs and the NIR spectral band is better conditioned than the blue spectral band. Hence, it is expected that the UCNP inverse problem is more prone to artefacts and is harder to solve. This assessment is validated via an image-driven assessment of the reconstructions. Fig. 5Comparison of sensitivity profiles of different optical contrast agents. (a) UCNPs with blue emission (475 nm). (b) UCNPs with NIR emission (800 nm). (c) Linear dye with NIR emission. (d) Comparison of the eigenvalue of sensitivity matrices for different optical contrast agents. The position of the specific source–detector pair depicted in these sensitivity maps is provided by arrows.  Tables 1 and 2 summarize the reconstruction volume and corresponding error for the different optical contrast agents considered and for 70 and 105 detectors separately. First, as expected, we noticed that increasing the number of sources leads to a reduction in the relative error no matter if we use UCNP- or linear dye-based reconstructions. However, for identical optode settings, the UCNP-based reconstructions systematically exhibit larger relative volume errors compared to the linear dye-based reconstructions. Note that the error reported herein is calculated for reconstructions with individual optimal regularization parameters. Table 1Reconstruction volume with 70 detectors of different optical contrast agents.a
Table 2Reconstruction volume with 105 detectors of different optical contrast agents.a
Similarly, the absolute centroid error is provided in Table 3. The same findings are observed when using this metric. The absolute centroid error for the linear dye is smallest () whereas for UCNPs, the error is around 0.5 mm for NIR emission and to 1.2 mm for blue emission. Note that the absolute centroid error does not reduce with an increasing number of sources under the same number of detectors. In all cases herein, the largest error always occurred along the direction [see Fig. 1(d)]. This depth-related volume enlargement is associated with the single projection configuration of our instrument design. Overall, the linear dye inverse problems provided more reliable reconstructions, followed by the UCNP NIR spectral band and then the UCNP blue spectral band. Table 3The absolute centroid error of different optical contrast agents.
3.3.Ex Vivo ExperimentsIn all experiments, we were able to acquire optical signals with relatively good signal-to-noise ratio (SNR). The data were acquired both at excitation and emission over the three cases tested. The experimental data were postprocessed to yield the same formulation in the in silico investigation. Reconstructions were performed using the same inverse problem methodology. The optical reconstructions for the best regularization parameters and with micro-CT fusion are provided for two views in Figs. 6 and 7. The optical reconstructions are displayed with an isosurface set at 0.5. Fig. 6Merged image of micro-CT and optical reconstructions (front view). (a) UCNPs with blue emission, (b) Bis-GMA mixture with UCNPs (20% w.t.) blue emission, (c) UCNPs with NIR emission, and (d) Bis-GMA mixture with UCNPs (20% w.t.) NIR emission. 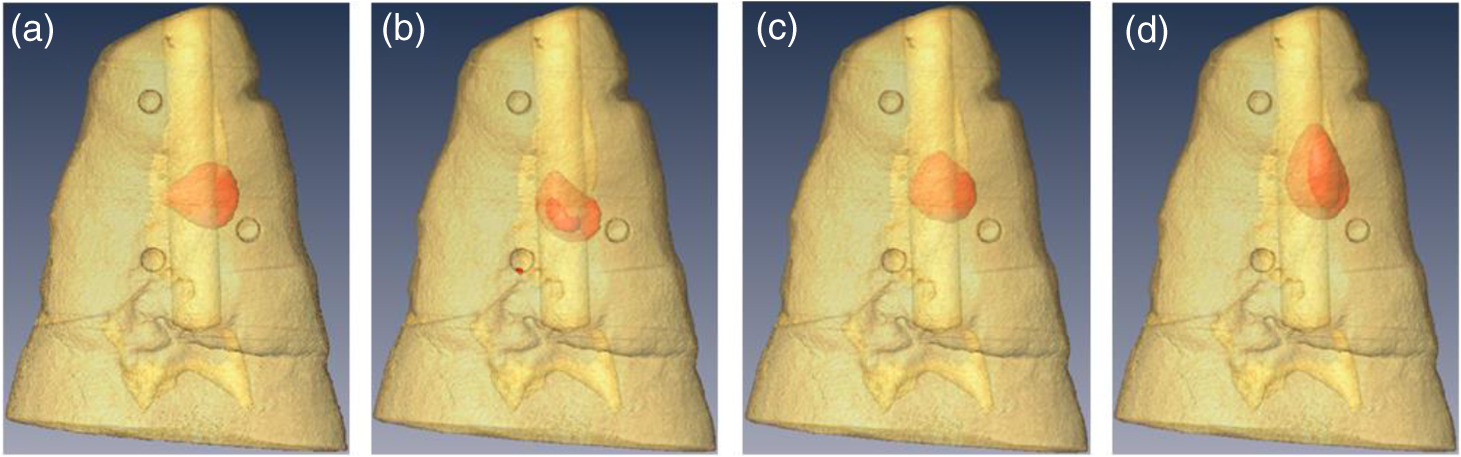 Fig. 7Merged image (lateral view): (a) UCNPs with blue emission, (b) Bis-GMA mixture with UCNPs (20% w.t.) blue emission, (c) UCNPs with NIR emission, and (d) Bis-GMA mixture with UCNPs (20% w.t.) NIR emission. 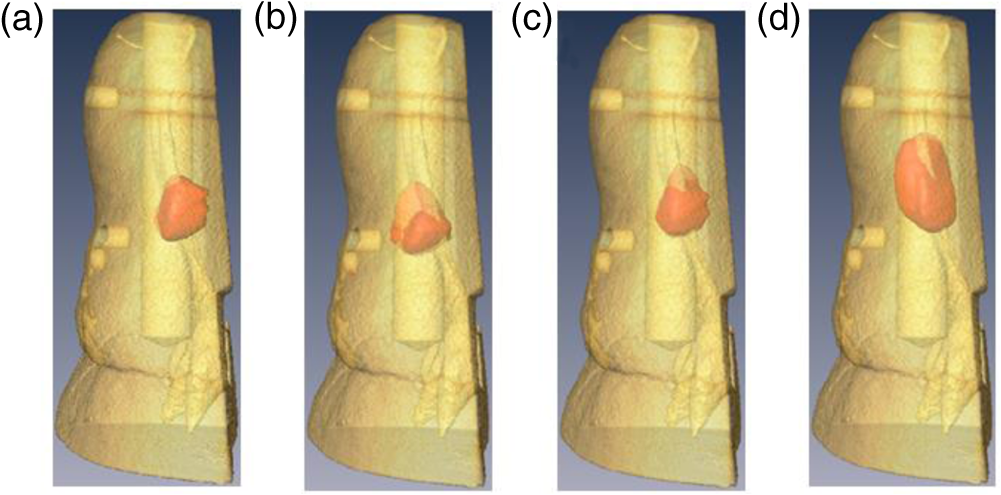 The relative volume error and absolute centroid error were calculated as in the in silico experiments and are provided in Table 4. The real volume in the FoV is , and the centroid of the real cylinder was estimated as (4.5, 7.0, 4.2) mm from micro-CT images. From Table 4, the relative volume error of UCNP reconstructions is normally , while the absolute centroid error is around 1.0 mm from the bottom of sample. As in the in silico experiments, the linear dye outperforms the UCNPs. Table 4Relative volume error and absolute centroid error between optical reconstructions and real values.
4.DiscussionThe goal of this study was to investigate if it was possible to perform optical tomography in dental tissue using UCNPs. In particular, there is still very limited work focusing on the use of UCNPs as imaging agents for optical tomography. To date, a few studies reported successful use of UCNPs in optical tomography, but they are still limited to favorable phantom studies and employ the NIR emission band of UCNPs. Hence, in this preliminary study, we embarked on establishing the possibility of performing mesoscopic fluorescence tomography on realistic tissues with challenging optical properties while using all emission bands of UCNPs. We employed commercially available Lanthanide-doped UCNPs that were experimentally characterized with a power-dependent index of , which is very close to the value reported in Ref. 34. This power-dependent index is slightly below the theoretical one, which may be due to strong saturation effects.35,36 Both our in silico and ex vivo experiments demonstrated that it was possible to perform optical tomography using UCNPs with accurate results when using UCNPs with NIR emission. However, even though the reconstruction performance was still superior compared to the results when using the UCNP blue emission band (better spatial location), linear dyes still provided better results. This is in contrast with previously published data in which higher resolution and, hence, better performances were observed using UCNPs versus a linear dye.14 One major difference between these studies and the work herein is the application settings. First, dental tissues are extremely scattering and, hence, may be not well-suited for harnessing the upconversion process for imaging purposes since scattering significantly increases with a decrease of wavelength. Second, the tooth sample used herein had a complex shape characterized by different thicknesses of tissue probed, whereas previous work used planar phantoms. The complex shape led to a large dynamical range in the data acquired that can significantly reduce the SNR for optical projections with long path-lengths. This then limits, especially in the case of UCNPs with blue emission, the useful information to a small subset of data with limited viewing angles. Additionally, we should note that the optical properties of the dental samples were assigned values derived from the literature. Even if we are confident that they are within the range of true values for experimental samples due to the good agreement between experimental data and fitted data, there is still most likely some model mismatch. In this regard, our recent implementation of hyperspectral widefield tomography based on single pixel implementations and compressive sensing should provide means to accurately estimate the sample’s optical properties over a wide spectral band,37 acquire the UCNPs’ multiple emission bands,38 resolve autofluorescence signals via lifetime unmixing,39 and enable higher optical tomographic resolution due to the early gate data type40 or phased-array configuration.41–43 Despite these drawbacks, it is feasible to perform UCNP-based optical tomography in dental tissue, and the impinging light power on the localized UCNP is strong enough to generate blue emission that can be detected despite huge attenuation. This indicates that the blue emission may be strong enough to kill bacteria. In a previous in vitro study, we reported that blue light as emitted by UCNP excited via NIR light could kill bacteria without having a harmful effect on mammalian cells.44 More precisely, we demonstrated that Streptococcus mutans, a caries-relevant bacteria,45 could be killed without any harmful effect to mammalian cells (NIH3T3 fibroblasts) when subjected to blue light emitted from the same UCNP used. The bacteria and mammalian cells were plated on Bis-GMA composite wells (with and without UCNP) and subsequently irradiated with the same NIR laser. We found that mammalian cells recovered when exposed to total energies below , whereas all bacteria were killed at up to (when UCNPs were present).46 Additionally, we would like to point out that UCNPs have been employed as biological labeling and therapeutic material,47 and their toxicity has been evaluated in multiple experiments.48,49 These experiments established that, at least with low concentration, UCNPs had no significant adverse biological effect.50 Hence, we hypothesize that UCNPs could be used as a reporter agent, as demonstrated by the possibility of imaging their biodistribution in dental tissues and as a therapeutic agent to kill bacteria for in vivo chairside applications. However, it is important to note that the experimental model employed herein is simplistic. In clinical scenarios for deep therapies, the illumination light may have to propagate through a complex set of tissues including gingiva tissue, bone, and periodontal ligament. Hence, our next steps will be to evaluate the energy deposition achieved by NIR illumination on the local UCNP-labeled dental restoration fillings to further establish if UCNPs could be used as potential theranostic agents for dental applications. 5.ConclusionsIn this manuscript, we report in silico and ex vivo experiments to demonstrate the potential use of optical tomography with UCNPs as an imaging agent to monitor the status of restorative fillings in dental applications. Although exhibiting larger condition number, optical reconstructions with UCNPs can still provide results with relative volume error ex vivo. This study is a preliminary stage toward more experiments, including in vitro experiments, which should be performed in the future to detect the feasibility of UCNPs as theranostic agents in clinical applications. AcknowledgmentsThe authors would like to thank Dr. Shiva Kotha for generating the initial idea of using UCNPs as theranostic agents for dental applications. The authors acknowledge the funding support from National Institutes of Health (NIH) under Grant Nos. R01-EB19443 and R01-CA 207725 and from the National Science Foundation (NSF) under Grant No. CBET-1263455. ReferencesT. Vos et al.,
“Years lived with disability (YLDs) for 1160 sequelae of 289 diseases and injuries 1990-2010: a systematic analysis for the global burden of disease study 2010,”
Lancet, 380 2163
–2196
(2012). http://dx.doi.org/10.1016/S0140-6736(12)61729-2 LANCAO 0140-6736 Google Scholar
R. F. Elemam and I. Pretty,
“Comparison of the success rate of endodontic treatment and implant treatment,”
ISRN Dent., 2011 640509
(2011). http://dx.doi.org/10.5402/2011/640509 Google Scholar
J. F. Siqueira,
“Aetiology of root canal treatment failure: why well-treated teeth can fail,”
Int. Endod. J., 34 1
–10
(2001). http://dx.doi.org/10.1046/j.1365-2591.2001.00396.x IENJEA 1365-2591 Google Scholar
D. A. Tyndall and S. Rathore,
“Cone-beam CT diagnostic applications: caries, periodontal bone assessment, and endodontic applications,”
Dent. Clin. North Am., 52 825
–841
(2008). http://dx.doi.org/10.1016/j.cden.2008.05.002 DCNAAC 0011-8532 Google Scholar
T. F. Watson,
“Fact and artefact in confocal microscopy,”
Adv. Dent. Res., 11 433
–441
(1997). http://dx.doi.org/10.1177/08959374970110040901 Google Scholar
J. S. Holtzman et al.,
“Ability of optical coherence tomography to detect caries beneath commonly used dental sealants,”
Lasers Surg. Med., 42 752
–759
(2010). http://dx.doi.org/10.1002/lsm.20963 LSMEDI 0196-8092 Google Scholar
F. Long et al.,
“Dental imaging using mesoscopic fluorescence molecular tomography: an ex vivo feasibility study,”
Photonics, 1 488
–502
(2014). http://dx.doi.org/10.3390/photonics1040488 Google Scholar
S. Guffey and J. Wilborn,
“In vitro bactericidal effects of 405-nm and 470-nm blue light,”
Photomed. Laser Surg., 24
(6), 684
–688
(2006). http://dx.doi.org/10.1089/pho.2006.24.684 Google Scholar
J. Dobson and M. Wilson,
“Sensitization of oral bacteria in biofilms to killing by light from a low-power laser,”
Arch. Oral Biol., 37
(11), 883
–887
(1992). http://dx.doi.org/10.1016/0003-9969(92)90058-G AOBIAR 0003-9969 Google Scholar
R. Lubart et al.,
“A possible mechanism for the bactericidal effect of visible light,”
Laser Ther., 20 17
–22
(2011). http://dx.doi.org/10.5978/islsm.20.17 LATHE5 0898-5901 Google Scholar
C. T. Xu, J. Axelsson and S. Andersson-Engels,
“Fluorescence diffuse optical tomography using upconverting nanoparticles,”
Appl. Phys. Lett., 94 251107
(2009). http://dx.doi.org/10.1063/1.3156857 APPLAB 0003-6951 Google Scholar
Q. Zhan et al.,
“Optimization of optical excitation of upconversion nanoparticles for rapid microscopy and deeper tissue imaging with higher quantum yield,”
Theranostics, 3 306
–316
(2013). http://dx.doi.org/10.7150/thno.6007 Google Scholar
Y.-K. Lee,
“Fluorescence properties of human teeth and dental calculus for clinical applications,”
J. Biomed. Opt., 20 040901
(2015). http://dx.doi.org/10.1117/1.JBO.20.4.040901 JBOPFO 1083-3668 Google Scholar
C. T. Xu et al.,
“High-resolution fluorescence diffuse optical tomography developed with nonlinear upconverting nanoparticles,”
ACS Nano, 6 4788
–4795
(2012). http://dx.doi.org/10.1021/nn3015807 ANCAC3 1936-0851 Google Scholar
J. Zhou, Z. Liu and F. Li,
“Upconversion nanophosphors for small-animal imaging,”
Chem. Soc. Rev., 41
(3), 1323
–1349
(2012). http://dx.doi.org/10.1039/C1CS15187H CSRVBR 0306-0012 Google Scholar
C. Wang, L. Cheng and Z. Liu,
“Upconversion nanoparticles for photodynamic therapy and other cancer therapeutics,”
Theranostics, 3
(5), 317
–330
(2013). http://dx.doi.org/10.7150/thno.5284 Google Scholar
Y. Min et al.,
“Recent advance of biological molecular imaging based on lanthanide-doped upconversion-luminescent nanomaterials,”
Nanomaterials, 4
(1), 129
–154
(2014). http://dx.doi.org/10.3390/nano4010129 Google Scholar
G. Chen et al.,
“Upconversion nanoparticles: design, nanochemistry, and applications in theranostics,”
Chem. Rev., 114 5161
–5214
(2014). http://dx.doi.org/10.1021/cr400425h CHREAY 0009-2665 Google Scholar
H. Qiu et al.,
“Enhanced upconversion luminescence in -codoped fluoride active core/active shell/inert shell nanoparticles through directed energy migration,”
Nanomaterials, 4 55
–68
(2014). http://dx.doi.org/10.3390/nano4010055 Google Scholar
G. Y. Chen et al.,
“Bright white upconversion luminescence in rare-earth-ion-doped nanocrystals,”
Appl. Phys. Lett., 91 133103
(2007). http://dx.doi.org/10.1063/1.2787893 APPLAB 0003-6951 Google Scholar
G. Y. Chen et al.,
“Two-color upconversion in rare-earth-ion-doped nanocrystals,”
Appl. Phys. Lett., 89 163105
(2006). http://dx.doi.org/10.1063/1.2363146 APPLAB 0003-6951 Google Scholar
G. Y. Chen et al.,
“Ultraviolet upconversion fluorescence in rare-earth-ion-doped induced by infrared diode laser excitation,”
Opt. Lett., 32 87
–89
(2007). http://dx.doi.org/10.1364/OL.32.000087 OPLEDP 0146-9592 Google Scholar
M. S. Ozturk et al.,
“Mesoscopic fluorescence molecular tomography of reporter genes in bioprinted thick tissue,”
J. Biomed. Opt., 18 100501
(2013). http://dx.doi.org/10.1117/1.JBO.18.10.100501 JBOPFO 1083-3668 Google Scholar
M. Ozturk et al.,
“Mesoscopic fluorescence molecular tomography for evaluating engineered tissues,”
Ann. Biomed. Eng., 44
(3), 667
–679
(2016). http://dx.doi.org/10.1007/s10439-015-1511-4 ABMECF 0090-6964 Google Scholar
V. V. Kumar et al.,
“Comparative evaluation of thickness of jaw-closing muscles in patients with long-standing bilateral temporomandibular joint ankylosis: a retrospective case-controlled study,”
Clin. Oral Invest., 19 421
–427
(2015). http://dx.doi.org/10.1007/s00784-014-1246-x Google Scholar
R. Yao, X. Intes and Q. Fang,
“Generalized mesh-based Monte Carlo for wide-field sources and detectors via mesh retesselation,”
Biomed. Opt. Exp., 7
(1), 171
–184
(2016). http://dx.doi.org/10.1364/BOE.7.000171 BOEICL 2156-7085 Google Scholar
J. Chen and X. Intes,
“Comparison of Monte Carlo methods for fluorescence molecular tomography—computational efficiency,”
Med. Phys., 38
(10), 5788
–5798
(2011). http://dx.doi.org/10.1118/1.3641827 MPHYA6 0094-2405 Google Scholar
L. Zhao et al.,
“The integration of 3-D cell printing and mesoscopic fluorescence molecular tomography of vascular constructs within thick hydrogel scaffolds,”
Biomaterials, 33
(21), 5325
–5332
(2012). http://dx.doi.org/10.1016/j.biomaterials.2012.04.004 BIMADU 0142-9612 Google Scholar
F. S. Azar and X. Intes, Translational Multimodality Optical Imaging, 386 Artech House Publishing, Norwood
(2008). Google Scholar
F. Yang et al.,
“High-resolution mesoscopic fluorescence molecular tomography based on compressive sensing,”
IEEE Biomed. Eng., 62
(1), 248
–255
(2015). http://dx.doi.org/10.1109/TBME.2014.2347284 Google Scholar
D. Fried et al.,
“Nature of light scattering in dental enamel and dentin at visible and near-infrared wavelengths,”
Appl. Opt., 34 1278
–1285
(1995). http://dx.doi.org/10.1364/AO.34.001278 APOPAI 0003-6935 Google Scholar
J. R. Zijp,
“Optical properties of dental hard tissues,”
(2001). Google Scholar
C. A. Khatri et al.,
“Synthesis, characterization and evaluation of urethane derivatives of Bis-GMA,”
Dent. Mater., 19 584
–588
(2003). http://dx.doi.org/10.1016/S0109-5641(02)00108-2 Google Scholar
S. Hu et al.,
“Upconversion nanoparticles for size dependent cell imaging and concentration dependent detection of rhodamine B,”
J. Nanomater., 2015 1
–10
(2015). http://dx.doi.org/10.1155/2015/598734 Google Scholar
H. Sun et al.,
“Structural and up-conversion luminescence properties in -codoped heavy metal oxide-halide glasses,”
Spectrochim. Acta Part A: Mol. Biomol. Spectrosc., 63 149
–153
(2006). http://dx.doi.org/10.1016/j.saa.2005.04.043 Google Scholar
F. Pandozzi et al.,
“A spectroscopic analysis of blue and ultraviolet upconverted emissions from , nanocrystals,”
J. Phys. Chem. B, 109 17400
(2005). http://dx.doi.org/10.1021/jp052192w JPCBFK 1520-6106 Google Scholar
Q. Pian et al.,
“Hyperspectral time-resolved wide-field fluorescence molecular tomography based on structured light and single pixel-detection,”
Opt. Lett., 40
(3), 431
–434
(2015). http://dx.doi.org/10.1364/OL.40.000431 OPLEDP 0146-9592 Google Scholar
Q. Pian et al.,
“Compressive hyperspectral time-resolved wide-field fluorescence lifetime imaging,”
Nat. Photonics,
(2017). Google Scholar
J. Chen, V. Venugopal and X. Intes,
“Monte Carlo based method for fluorescence tomographic imaging with lifetime multiplexing using time gates,”
Biomed. Opt. Exp., 2 871
–886
(2011). http://dx.doi.org/10.1364/BOE.2.000871 BOEICL 2156-7085 Google Scholar
L. Zhao et al.,
“Lp regularization for early time-gate fluorescence molecular tomography,”
Opt. Lett., 39
(14), 4156
–4159
(2014). http://dx.doi.org/10.1364/OL.39.004156 OPLEDP 0146-9592 Google Scholar
Y. Chen et al.,
“Signal-to-noise analysis for detection sensitivity of small absorbing heterogeneity in turbid media with single-source and dual-interfering-source,”
Opt. Express, 9 212
–224
(2001). http://dx.doi.org/10.1364/OE.9.000212 OPEXFF 1094-4087 Google Scholar
Y. Chen et al.,
“Near-infrared phase cancellation instrument for fast and accurate localization of fluorescent heterogeneity,”
Rev. Sci. Instrum., 74 3466
–3473
(2003). http://dx.doi.org/10.1063/1.1583864 RSINAK 0034-6748 Google Scholar
X. Intes et al.,
“Interfering diffusive photon-density waves with an absorbing-fluorescent inhomogeneity,”
Opt. Express, 8 223
–231
(2001). http://dx.doi.org/10.1364/OE.8.000223 OPEXFF 1094-4087 Google Scholar
F. Long et al.,
“Imaging of smart dental composites using mesoscopic fluorescence molecular tomography: an ex vivo feasibility study,”
Adv. Comput. Sci. Inf. Technol., 2 43
–46
(2015). Google Scholar
S. D. Forssten, M. Björklund and A. C. Ouwehand,
“Streptococcus mutans, caries and simulation models,”
Nutrients, 2
(3), 290
–298
(2010). http://dx.doi.org/10.3390/nu2030290 Google Scholar
F. Long,
“Optical tomography and light irradiation to reduce bacterial loads in oral health application,”
(2016). Google Scholar
F. Wang et al.,
“Upconversion nanoparticles in biological labeling, imaging, and therapy,”
Analyst, 135
(8), 1839
–1854
(2010). http://dx.doi.org/10.1039/c0an00144a ANALAO 0003-2654 Google Scholar
K. Wang et al.,
“Toxicity assessments of near-infrared upconversion luminescent , Er in early development of Zebrafish embryos,”
Theranostics, 3
(4), 258
–266
(2013). http://dx.doi.org/10.7150/thno.5701 Google Scholar
A. Gnach et al.,
“Upconverting nanoparticles: assessing the toxicity,”
Chem. Soc. Rev., 44 1561
–1584
(2015). http://dx.doi.org/10.1039/c4cs00177j Google Scholar
L. Cheng et al.,
“In vivo pharmacokinetics, long-term biodistribution and toxicology study of functionalized upconversion nanoparticles in mice,”
Nanomedicine, 6
(8), 1327
–1340
(2011). http://dx.doi.org/10.2217/nnm.11.56 1743-5889 Google Scholar
BiographyFeixiao Long is a postdoctoral fellow at the University of Connecticut. He received his PhD from Rensselaer Polytechnic Institute in 2016, his BE degree in biomedical engineering from Beijing University of Technology in 2006, and his ME degree in biomedical engineering from Tsinghua University in 2009. Xavier Intes is a professor in the Department of Biomedical Engineering, codirector of the Biomedical Imaging Center at Rensselaer Polytechnic Institute, and an AIMBE. He obtained his PhD from the Université de Bretagne Occidentale and postdoctoral training at the University of Pennsylvania. He acted as the chief scientist of Advanced Research Technologies Inc. His research interests are on the application of diffuse functional and molecular optical techniques for biomedical imaging in preclinical and clinical settings. |
|||||||||||||||||||||||||||||||||||||||||||||||||||||||||||||||||||||||||||||||||||||||||||||||||||||||||||||||||||||||||||||||||||||||||||||||||||||||||||||||||||||||||||||||||||||||||||||||||||||||||||||||||||||||||||||||||||||||