|
|
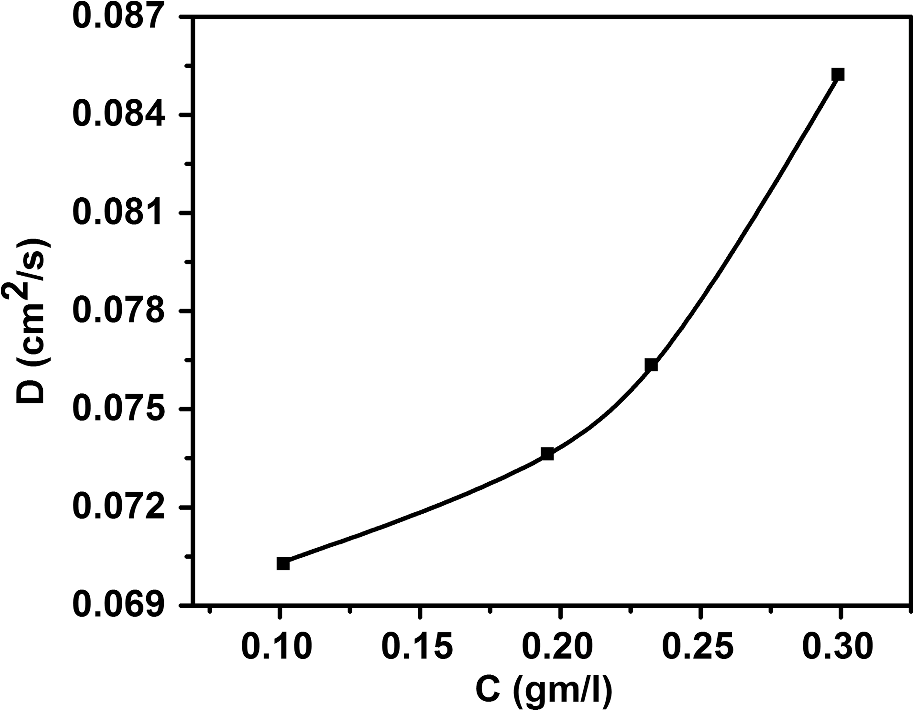
1.IntroductionWith the advent of lasers and data acquisition systems, optical techniques have emerged as potential tools for the measurement of physical properties of matter. Optical techniques are based on certain phenomena, such as refraction, interference, diffraction, polarization, etc.1 The use of low-power lasers has gained significant attention in the field of science and technology because of its nondestructive nature. It is this property that is being widely used in biomedical characterisations.2–5 There are several nondestructive optical methods6–10 for the evaluation of physical parameters, such as drug’s diffusion coefficient, tissue’s refractive index,11 and thermal conductivity,12 etc. Laser beam deflection (LBD) technique is a nondestructive evaluation method in which the refractive index gradient (RIG) produced in a medium is analyzed for the estimation of physical parameters.13 Variations in temperature, pressure, concentration, etc. can induce an RIG in a medium. When a beam of light passes through a medium of varying refractive index, it undergoes deflection.13–16 The refractive index of a liquid medium is found to increase with the concentration of solute particles in it.17–19 A study of beam deflection due to RIG can give information regarding the physical property of the medium. When one liquid diffuses into another, the refractive index of the medium changes continuously and, hence, the laser beam passing through it gets deflected. Diffusion is one such phenomenon that depends on the concentration, temperature, viscosity, and density of fluids. This is the basic phenomena of mass transport in biological systems and is governed by Fick’s law of diffusion.20 By Fick’s first law of diffusion, the rate of transfer () of the diffusing substance through the interface is proportional to the concentration () gradient measured normal to the interface and is given by For binary diffusion between two pure fluids, by Fick’s second law of diffusion, the rate of change of concentration is proportional to the curvature of the concentration gradient with respect to the distance from the interface and is given byThe diffusion phenomenon finds applications from the germination of seeds to the administration of the drug. Drug administration is an important problem in estimating the dose of drug required to achieve its adequate concentration in the blood. Drug accumulation in the blood stream depends on drug diffusion rate in the blood. With the development of new drugs and methods of drug delivery into tissues and blood, numerous studies are reported in this field.21–25 There are several techniques for the study of diffusion coefficient, such as collimated light transmittance method,22–25 interferometric method,26 isotropic methods,27 etc. All these methods are based on the study of the concentration of the diffusing liquid at a particular spatial point as a function of time. The LBD technique employed in the present study gives information about the diffusion process at various spatial points simultaneously. This can effectively improve the accuracy of the measurement of diffusion coefficient over other conventional techniques. The method also helps in understanding the spatial anisotropy of the liquid medium. In the present work, an attempt has been made to study the variation of diffusion coefficient with concentration, taking sodium chloride (NaCl) as an example. The result of diffusion of NaCl solution into water led to the study of drug diffusion. Drugs and chemicals can also diffuse into the blood stream. Human blood consists of 55% plasma in which 92% is water. The diffusion process greatly depends on the density and/or concentration of the diffusing liquid. As the density of water () is close to that of blood plasma (), the diffusion of the drug into blood plasma can be studied with water. Hence, the study of diffusion of the drug into water will give information regarding the nature of diffusion of the drug into blood plasma and its spreading into the cardiovascular systems. Phenylephrine hydrochloride and chlorpheniramine maleate syrup is a commonly used drug for common cold, flu, allergies, or other breathing illnesses.28 2.Experimental MethodThe schematic of the experimental setup for Wiener’s method29 for the determination of diffusion coefficient is shown in Fig. 1. A helium–neon laser with wavelength 632.8 nm and power 2 mW is used as the source. The beam is passed through a cylindrical lens to produce a fan of light. A glass rod of diameter 0.5 cm is used as the cylindrical lens. The fan of light on passing through the homogeneous liquid sample in the cuvette traces a straight line on the screen. The liquid, whose diffusion coefficient is to be determined, is slowly pipetted to the bottom of the cuvette. NaCl solutions of concentrations 0.10, 0.20, 0.24, and were prepared in distilled water at room temperature. These solutions were used for the determination of diffusion coefficient of NaCl solution into water. To study the diffusion of the drug, samples of various concentrations were prepared by adding 0.1, 0.2, 0.3, 0.4, …. ml of drug into 1 ml of distilled water. The experiment is carried out at normal temperature and pressure. Due to concentration difference between the solvent (water) and the solution, an interface is formed in the cuvette as shown in Fig. 2. The rays emerging from the cylindrical lens on passing through the binary solution get deflected at the interface and produce an image as shown in Fig. 3. The images of the dip at different time intervals after the formation of the interface are recorded. Let be the depth of the dip at time . By noting down the half width at the half maximum () and at different time intervals (), a graph is plotted with versus as shown in Fig. 4. A linear fit is given to the plot from which the slope can be calculated. The diffusion coefficient is given by30,31 3.Results and DiscussionTo study the variation of diffusion coefficient with concentration, NaCl solutions of various concentrations were prepared. Figure 5 shows the variation of diffusion coefficient with concentration. From Fig. 5, it can be seen that the diffusion coefficient increases with concentration. The graph is in agreement with the polynomial relation connecting the diffusion coefficient and concentration given by Eq. (4), where , and is shown in Fig. 6. In order to study the diffusion of drugs into blood plasma, a commonly used cough syrup (phenylephrine hydrochloride and chlorpheniramine maleate syrup) was selected. As 92% of plasma is water, the diffusion of the drug into the water can give information regarding the diffusion of the drug into the blood plasma.32–35 The variation of diffusion coefficient with the concentration of the drug is shown in Fig. 7. Drug samples of various concentrations were prepared by adding 0.1, 0.2, 0.3, 0.4, …. ml of drug into 1 ml of distilled water. In Fig. 7, we can see three regions of diffusion for concentrations (0 to 0.2, 0.2 to 0.3, and above). In the first region, the diffusion rate increases gradually with the dosage of the drug. In the second region, we can see a sharp increase in the diffusion coefficient with the drug dosage. In this region, a slighter change in the drug dosage produces greater variation on diffusion coefficient. In the third region, we can see saturation of diffusion coefficient with drug dosage. This indicates that the diffusion rate cannot be increased beyond a certain value () of drug dosage level. One has to be cautious while administering drugs with concentrations within region 2 as the effect of the drug will be reflected in a shorter period of time. Hence, an awareness of drug diffusion into plasma is essential while prescribing the drug dosage level. 4.ConclusionThe dynamics of molecular transport at the interface of two miscible liquids can be understood from the study of the diffusion coefficient. Several techniques for the determination of diffusion coefficient study the variations in the concentration of the diffusing liquid at a particular spatial point as a function of time. The present study based on LBD technique is simple and accurate and provides information about the diffusion process at various spatial points simultaneously. This helps in understanding the time evolution of the spatial anisotropy of the medium. This method is employed to study the variation of the diffusion coefficient with the concentration of NaCl solution and extended to understand the diffusion of the drug into water. As densities of blood plasma and water are nearly equal, it is assumed that the study of drug diffusion into water will give information about the diffusion of the drug into blood plasma and its spreading into the cardiovascular system. From this study, it can be seen that the diffusion coefficient increases gradually with the concentration of the drug in the region 1, rapidly in region 2, and saturates in region 3. Therefore, care should be taken while prescribing the drug dosage level within region 2 as the effect of the drug will be reflected in a shorter period of time. DisclosuresThe authors have no relevant financial interests in the paper and no other potential conflicts of interest to disclose. ReferencesS. Manjusha et al.,
“Fiber sensor based pulmonary function test,”
Int. J. Curr. Res. Rev., 9
(8), 41
(2017). Google Scholar
L. G. Legres et al.,
“The laser technology: new trends in biology and medicine,”
J. Mod. Phys., 5 267
–279
(2014). http://dx.doi.org/10.4236/jmp.2014.55037 Google Scholar
A. Katzir, Lasers and Optical Fibers in Medicine, Academic Press, Inc., California
(1993). Google Scholar
S. Chopra and H. M. Chawla, Lasers in Chemical and Biological Sciences, Wiley Eastern Limited, New Delhi
(1992). Google Scholar
R. W. Waynant, Lasers in Medicine, CRC Press, Florida
(2002). Google Scholar
M. V. Rao, R. Samuel and A. Ananthan,
“Applications of electronic speckle interferometry (ESI) techniques for spacecraft structural components,”
Opt. Lasers Eng., 40 563
–571
(2003). http://dx.doi.org/10.1016/S0143-8166(02)00079-9 OLENDN 0143-8166 Google Scholar
S. Sankararaman et al.,
“Photoacoustic study of the effect of degassing temperature on thermal diffusivity of hydroxyl loaded alumina,”
Appl. Phys. Lett., 67 2939
–2941
(1995). http://dx.doi.org/10.1063/1.114818 APPLAB 0003-6951 Google Scholar
S. Sankararaman et al.,
“Photoacoustic study of the effect of hydroxyl ion on thermal diffusivity of -alumina,”
J. Appl. Phys., 85
(2), 1987
–1988
(1999). http://dx.doi.org/10.1063/1.369193 JAPIAU 0021-8979 Google Scholar
S. Sankararaman,
“Effect of sample preparation route on the thermal diffusivity of ––a laser induced photoacoustic study,”
J. Mater. Sci. Nanotechnol., 4
(2), 204
(2016). http://dx.doi.org/10.15744/2348-9812.4.204 Google Scholar
I. Alexeenko et al.,
“Nondestructive testing by using long-wave infrared interferometric techniques with lasers and microbolometer arrays,”
Appl. Opt., 52
(1), A56
–67
(2013). http://dx.doi.org/10.1364/AO.52.000A56 APOPAI 0003-6935 Google Scholar
H. Ding et al.,
“Refractive indices of human skin tissues at eight wavelengths and estimated dispersion relations between 300 and 1600 nm,”
Phys. Med. Biol., 51 1479
–1489
(2006). http://dx.doi.org/10.1088/0031-9155/51/6/008 PHMBA7 0031-9155 Google Scholar
E. Ponder,
“The coefficient of thermal conductivity of blood and various tissues,”
J. Gen. Physiol., 45 545
–551
(1962). http://dx.doi.org/10.1085/jgp.45.3.545 JGPLAD 0022-1295 Google Scholar
S. Nemoto,
“Measurement of the refractive index of liquid using laser beam displacement,”
Appl. Opt., 31 6690
(1992). http://dx.doi.org/10.1364/AO.31.006690 APOPAI 0003-6935 Google Scholar
A. Kurian et al.,
“Application of laser beam deflection technique to study the diffusion process in electrolyte solutions,”
Pramana, 43 401
(1995). http://dx.doi.org/10.1007/BF02846707 PRAMCI 0304-4289 Google Scholar
H. C. Price, J. Mattsson and B. J. Murray,
“Sucrose diffusion in aqueous solution,”
Phys. Chem. Chem. Phys., 18 19207
–19216
(2016). http://dx.doi.org/10.1039/C6CP03238A PPCPFQ 1463-9076 Google Scholar
A. J. Barnard and B. Ahlborn,
“Measurement of refractive index gradients by deflection of a laser beam,”
Am. J. Phys., 43 573
–574
(1975). http://dx.doi.org/10.1119/1.9769 AJPIAS 0002-9505 Google Scholar
D. A. Krueger,
“Spatially varying index of refraction: an open ended undergraduate topic,”
Am. J. Phys., 48 183
–188
(1980). http://dx.doi.org/10.1119/1.12169 AJPIAS 0002-9505 Google Scholar
C. Gaffney and C. K. Chau,
“Using refractive index gradients to measure diffusivity between liquids,”
Am. J. Phys., 69 821
–825
(2001). http://dx.doi.org/10.1119/1.1328350 AJPIAS 0002-9505 Google Scholar
D. Ambrosini,
“Diffusion measurements by optical methods: recent advances and applications,”
Opt. Laser Eng., 46 849
–851
(2008). http://dx.doi.org/10.1016/j.optlaseng.2008.08.006 Google Scholar
R. B. Bird, W. E. Stewart and E. N. Lightfoot, Transport Phenomena, 558 John Wiley, New York
(1960). Google Scholar
D. K. Tuchina et al.,
“Study of glycerol diffusion in skin and myocardium ex vivo under the conditions of developing alloxan-induced diabetes,”
J. Biomed. Photonics Eng., 2
(1), 020302
(2017). http://dx.doi.org/10.18287/JBPE17.03.020302 Google Scholar
S. Carvalho et al.,
“Glucose diffusion in colorectal mucosa—a comparative study between normal and cancer tissues,”
J. Biomed. Opt., 22
(9), 091506
(2017). http://dx.doi.org/10.1117/1.JBO.22.9.091506 JBOPFO 1083-3668 Google Scholar
L. M. Oliveira et al.,
“The characteristic time of glucose diffusion measured for muscle tissue at optical clearing,”
Laser Phys., 23 075606
(2013). http://dx.doi.org/10.1088/1054-660X/23/7/075606 Google Scholar
V. R. Muzykantov,
“Drug delivery by red blood cells: vascular carriers designed by mother nature,”
Expert Opin. Drug Delivery, 7
(4), 403
–427
(2010). http://dx.doi.org/10.1517/17425241003610633 Google Scholar
V. D. Genin et al.,
“Ex vivo investigation of glycerol diffusion in skin tissue,”
J. Biomed. Photonics Eng., 2 2010303
(2016). http://dx.doi.org/10.18287/JBPE16.02.010303 Google Scholar
V. Vitagliano and D. A. Lyons,
“Diffusion coefficients for aqueous solutions of sodium chloride and barium chloride,”
J. Am. Chem. Soc., 78 1549
–1552
(1956). http://dx.doi.org/10.1021/ja01589a011 JACSAT 0002-7863 Google Scholar
J. H. Wang and J. W. Kennedy,
“Self-diffusion coefficients of sodium ion and iodide ion in aqueous sodium iodide solutions,”
J. Am. Chem. Soc, 72 2080
–2083
(1950). http://dx.doi.org/10.1021/ja01161a056 Google Scholar
“Drugs & medications: chlorpheniramine-phenylephrine elixir,”
(2017) http://www.webmd.com/drugs/2/drug-60-9012/chlorpheniramine-phenylephrine-elixir/details May ). 2017). Google Scholar
N. Rashidnia et al.,
“Measurement of the diffusion coefficient of miscible fluids using both interferometry and Wiener’s method,”
Int. J. Thermophys., 22 547
–555
(2001). http://dx.doi.org/10.1023/A:1010735117408 IJTHDY 0195-928X Google Scholar
S. Rehfeldt and J. Stichlmair,
“Measurement and calculation of multicomponent diffusion coefficients in liquids,”
Fluid Phase Equilib., 256 99
–104
(2007). http://dx.doi.org/10.1016/j.fluid.2006.10.008 FPEQDT 0378-3812 Google Scholar
W. Jost, Diffusion of Solids, Liquids, Gases, 3rdAcademic Press, New York
(1952). Google Scholar
A. Axelsson and M. Marucci,
“The use of holographic interferometry and electron speckle pattern interferometry for diffusion measurement in biochemical and pharmaceutical engineering applications,”
Opt. Laser Eng., 46 865
–876
(2008). http://dx.doi.org/10.1016/j.optlaseng.2008.03.017 Google Scholar
M. G. Ghosn et al.,
“Concentration effect on the diffusion of glucose in ocular tissues,”
Opt. Laser Eng., 46 911
–914
(2008). http://dx.doi.org/10.1016/j.optlaseng.2008.05.004 Google Scholar
A. Genina,
“Measurement of retinalamin diffusion coefficient in human sclera by optical spectroscopy,”
Opt. Laser Eng., 46 915
–920
(2008). http://dx.doi.org/10.1016/j.optlaseng.2008.07.006 Google Scholar
E. Ray and P. Bunton,
“Determination of diffusion coefficient between corn syrup and distilled water using a digital camera,”
Am. J. Phys., 75 903
–906
(2007). http://dx.doi.org/10.1119/1.2752819 AJPIAS 0002-9505 Google Scholar
BiographyMohanachandran Nair. S. Swapna received her MSc degree in physics from the Department of Physics, University of Kerala, India, in 2015. She joined the Department of Optoelectronics, University of Kerala, for her MPhil degree in photonics and is in pursuance of her research degree in biomedical applications of lasers. She has filed one patent application in nanoscience. Madhu J. Anitha received her MTech degree in optoelectronics and optical communication from the Department of Optoelectronics, University of Kerala, India, in 2014 and is currently working as guest faculty in the same department. Sankaranarayana Iyer Sankararaman received his PhD in photonics from Cochin University, Kerala, India. He has 22 years of teaching experience and is currently working as a reader in the Department of Optoelectronics, University of Kerala. He has authored five books and more than 20 articles and has filed two patent applications in nanoscience. He is the recipient of the National Award for innovative educator instituted by AIACHE in 2009. |