
|
|
1.IntroductionPlethysmography1 is a useful method with which to detect and, in some cases quantitatively measure, volume or volume change. It has been particularly useful for the measurement of blood volume changes in biological tissues. There are several underlying measurement principles upon which plethysmography can be based, such as electrical impedance2,3 and optical absorption and scattering.4,5 The use of light to implement noninvasive plethysmography in biological tissues has attracted considerable interest for almost a century, with the creation of so-called photoelectric plethysmography, now commonly termed photoplethysmography.6,7 This is a simple, easy-to-use, and low-cost optical technique that is based on the detection of changes in light intensity due to blood volume changes. A popular example application is to measure cardiac-related blood volume pulsations in a finger—finger-photoplethysmography—and this is usually achieved by placing a light source on the one side of the finger and a photodetector (PD) on the other side; this is transmittance-type finger-photoplethysmography. It is also possible to position the light source and the detector adjacent to each other on the same side of the finger, or indeed, other tissues; this is the side-by-side configuration or reflectance-type photoplethysmography. As described below, the technique of photoplethysmography can provide valuable physiological information that can be derived from the signal produced, the so-called photoplethysmogram (PPG). The PPG comprises a pulsatile component (the so-called AC component) attributed to cardiac synchronous changes in blood volume in each cardiac beat and a slowly varying baseline [the so-called direct-current (DC) component] with lower frequency components attributed, among other possible influences, to respiration and sympathetic activity, which influence the light attenuation by the tissue segment being interrogated. At present, there is interest in using photoplethysmography for the measurement of such physiological indices as pulse rate,8,9 blood pressure,10–14 pulse volume, normalized pulse volume as an indication of peripheral vascular tone,15–17 peripheral arterial stiffness,18 tissue and skin blood flow,19,20 blood oxygen saturation,21,22 and cardiac output based on pulse dye-densitometry.23 In these applications, a variety of wavelengths, from red (610 nm) through to near-infrared () have been chosen for the light source, although recent studies have demonstrated some benefits from the use of green light (about 530 nm) to achieve less motion artifact.9,24,25 It is generally agreed that the wavelength selections should attempt to avoid wavelength regions of water absorption (more than to 1000 nm). However, in the special case of attempting to measure blood constituents noninvasively, such as blood alcohol,26 glucose,27 and other circulating compounds,28 there is a challenge since the target molecules exhibit several spectral absorbance peaks in the wavelength regions of water absorption. We have recently searched the literature for a conventional transmittance- or reflectance-type photoplethysmography measurement using wavelengths greater than the first peak of water absorbance at 1450 nm and have found reports on lip-photoplethysmography to show spectral changes due to pulsatile blood volume changes within the near-infrared and overtone region.29,30 Also of relevance are our own studies using a high-speed spectrophotometry27 and on the use of an integrating sphere technique.31 Although photoplethysmography in the lip tissue using a special diffuse reflection accessory based on a rotational ellipsoid for collection of backscattered radiation is a promising technique, it is necessary to resolve the limitations imposed by the time resolution of the measurements, that is, to achieve spectrophotometry at a higher speed. In order to achieve very high-speed spectrophotometry, we developed an experimental system comprising of a spectrometer with an effective wavelength range from 900 to 1700 nm with a resolution of better than 8 nm, a linear, liquid nitrogen-cooled InGaAs photodiode-array (512-channel PD), and a personal computer. This system allows simultaneous transmittance PPG measurements at 100 selected wavelengths, deriving absorbance spectra related to blood constituents. A partial least squares model is used with the spectral data to predict levels of blood glucose (BGL), which we refer to as “pulse glucometry.”27 Although this system provides the necessary measurement sensitivity, precision, and accuracy with a high signal-to-noise ratio (), it is very expensive to construct and to maintain, and it is bulky and complex to operate. This system is very useful for research studies but is not suitable for routine clinical use, such as in diabetes self-monitoring. We have also reported the use of an integrating sphere to enhance the performance of finger-photoplethysmography.31 The enhanced photon collection possible with this technique has been shown to be effective when used for deriving the PPG from the highly scattering tissue of the finger. PPGs at 1600 nm were successfully collected using an integrating sphere of 150 mm diameter. The reported study31 is the first successful attempt to obtain the PPG in the wavelength region where there is strong water absorption. However, this approach is not free from practical difficulties, correct placement of the sphere on the finger being critical and slight movements of the finger inside the sphere resulting in unstable and unreliable PPGs. Furthermore, the sphere and the overall assembly is complex and costly to construct. The present study was performed with the aim of investigating the possibility of developing a simple, effective, and low cost method to address these disadvantages and, thereby, to facilitate the use of pulse glucometry for noninvasive BGL measurement. It is well known that photon propagation through biological tissue is complex in terms of multiple scattering, absorption, and reflection, and these optical phenomena are also influenced by the wavelength.32–34 Analysis of these fundamental phenomena can be pursued with the radiative transfer equation,35 although practical solutions are difficult to achieve, even though the scattering phase function may be useful when formulating our interpretations of photon propagation in and around the soft tissue–hard tissue interfaces that no doubt play critical roles in our present study due to the close positioning of source-detector to the digital bone. Also, in terms of spatial sensitivity, a very important influence is the geometrical arrangement of the radiation source and the PD.36 Our working hypothesis was that a specific geometrical arrangement of the radiation source(s) and the PD could yield an innovative but simple design for laser-based photoplethysmography suitable for wavelength regions particularly aimed at glucose absorption bands. To test this hypothesis, we have first performed PPG measurements in a fingertip with different positions of the incident laser beams relative to the PD position. For this part of the study, we used three specific wavelengths: 808 nm, an isosbestic wavelength for oxy- and deoxyhemoglobins used in pulse oximetry; 1160 nm, an absorption window of water and blood alcohol; and 1600 nm, a high absorption band of glucose. After determining an effective position of the laser beam with 1600 nm, we then carried out the second part of the study, in which we collected simultaneous PPGs using multiple wavelengths chosen specifically to identify and quantify BGL levels. 2.Materials and MethodsIn this study, we carried out two experimental protocols. First, (Experiment-1; Exp-1) we aimed to determine the optimal geometrical arrangement of the radiation source and the PD to produce PPGs at a wavelength for which there is a glucose absorption peak. Second, (Experiment-2; Exp-2), as a preliminary study toward BGL measurement based on pulse glucometry, we aimed to demonstrate the use of multiple wavelengths covering the glucose absorption bands but using the geometrical arrangement of source and detector determined by Exp-1. 2.1.Configuration of Incident Radiation and Photodetector for Exp-1Figure 1 shows an outline of the geometrical arrangement of a laser-based photoplethysmograph applied to a fingertip for Exp-1. Laser diodes (LDs) at three wavelengths () were used for this experiment: 808 nm (RLT808-10MG, Roithner Laser Technik Com., Vienna, Austria: spectral width, 12 nm), an isosbestic point of oxy- and deoxyhemoglobins, usually used for pulse oximetry; 1160 nm (APLD-1160-S20, Alfa Photonics Inc., Riga, Latvia: spectral width, 10 nm), a window through absorption spectra of water and blood alcohol; and 1600 nm (APLD-1600-S10, Alfa Photonics Inc., Riga, Latvia: spectral width, 10 nm) where water absorption is very high, but there is also an absorption peak of glucose. The three LDs were fired by a pulsed LD driving unit, as described below. The radiation emitted by each of the LDs was transported through a custom-made optical fiber (40-cm long, step-index fiber, core diameter, clad diameter, covered with nylon tube of 1.4-mm outer diameter). The distal ends of the three fibers were contained together to form a “flatpack” assembly on an acrylic plate [flatpacked optical fibers (FOF)] as shown in Fig. 1(c). The part number of this fiber is FC(8F)/S400-0.4m/Pigtail (8F), and this was made for us by Keystone International Co., Ltd., Chiba, Japan. Fig. 1Outline of geometrical arrangement of laser-based photoplethysmograph in a fingertip. (a) Lateral view, (b) front view, and (c) dimensions of FOF. 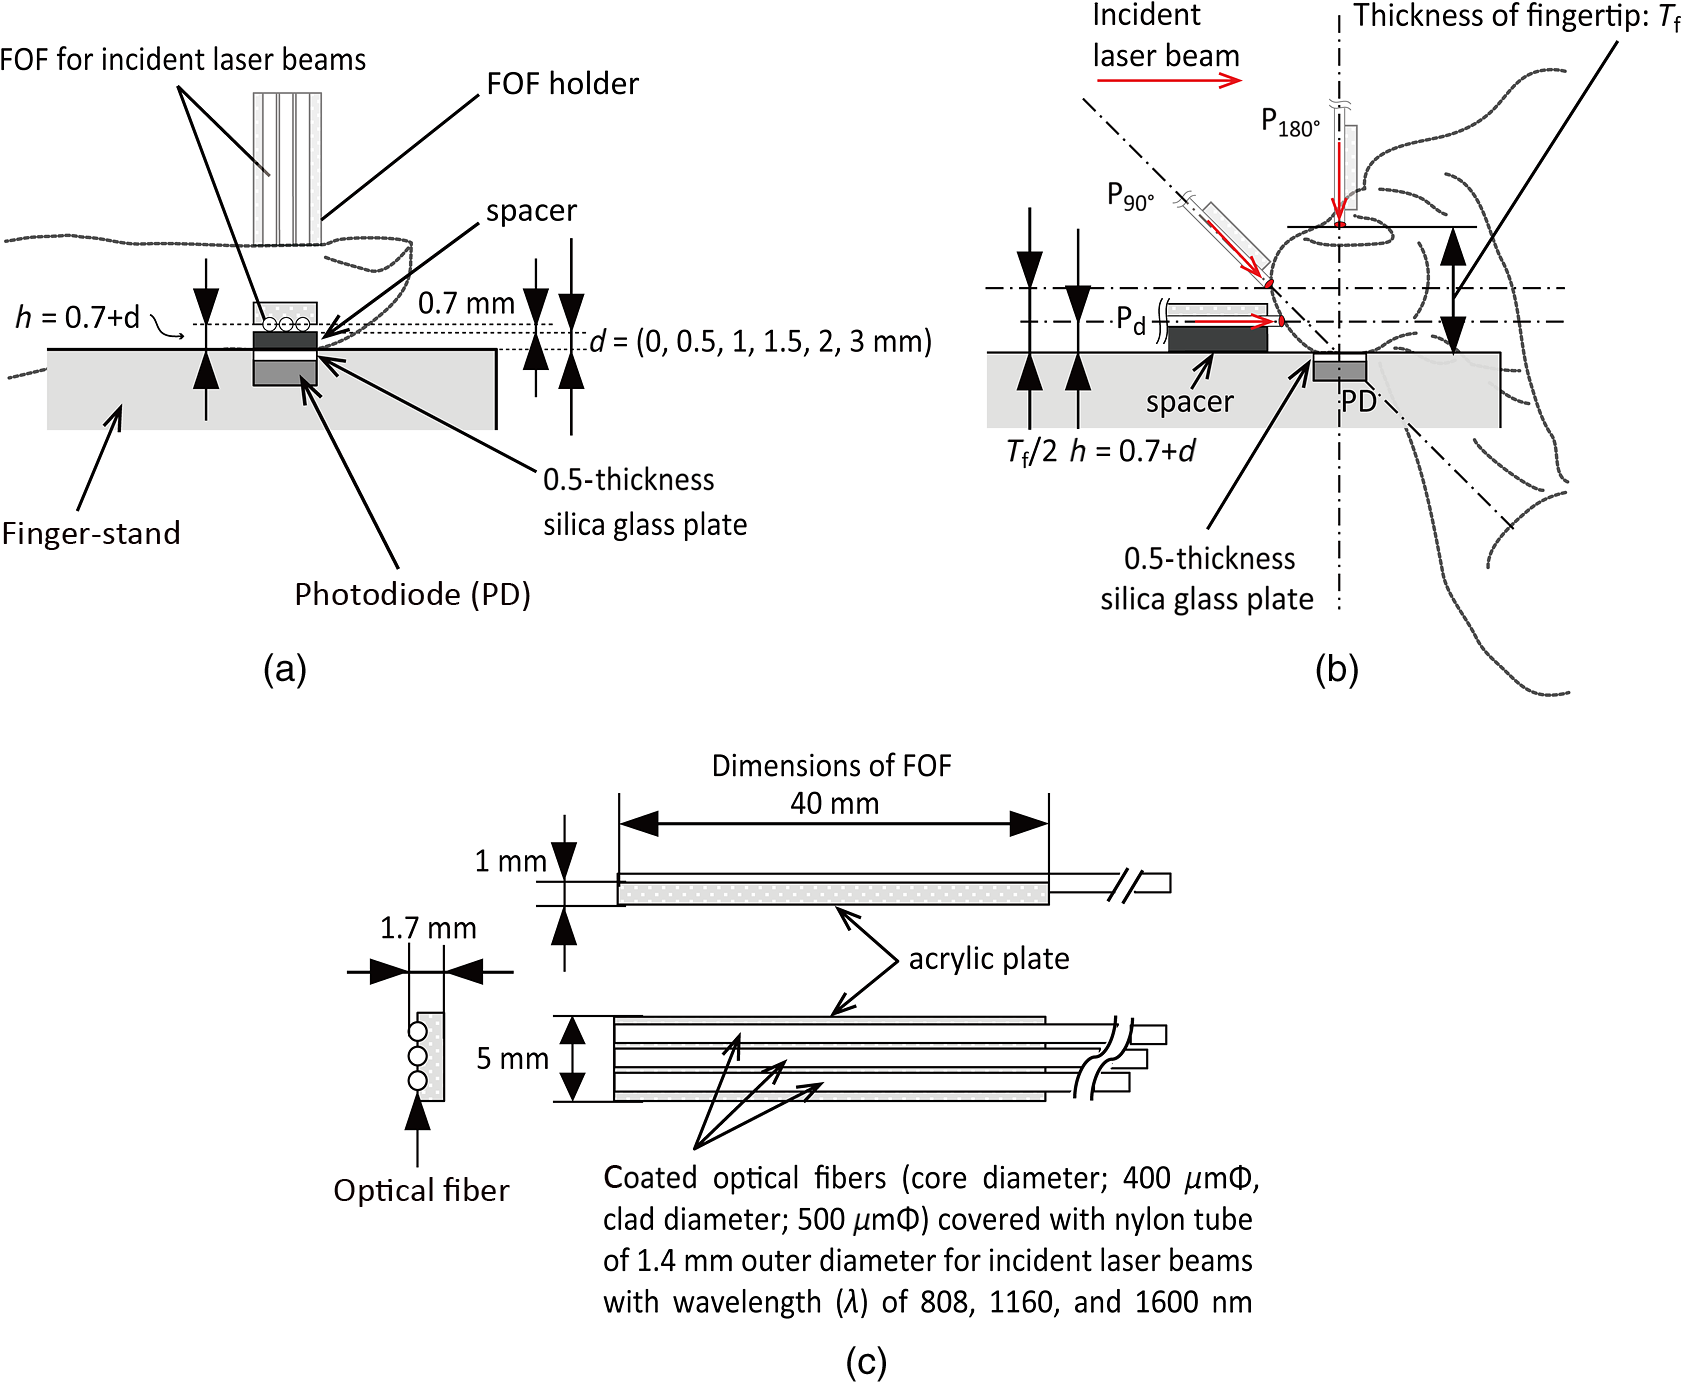 To make a measurement, a finger (usually an index finger) was placed on a finger-stand so that the ball of the fingertip was in gentle contact with a 0.5-mm-thick silica glass plate, which is, in turn, in contact with the front surface of a photodiode (PD: FDG1010, Thorlabs Inc., New Jersey: wavelength range, 800 to 1800 nm; peak wavelength, 1550 nm; and peak responsivity, ; active area, ; rise/fall time, ; dark current, ) [see Figs. 1(a) and 1(b)]. At this time, care was taken for the acceptance surface of the PD to be completely covered with the fingertip ball. Also, since the PD (FDG1010) does not have a flat spectral response, we have corrected the PPG signals by reference to the data provided in the FDG1010 specification sheet,37 in Exp-1 followed by Exp-2, described below. The FOF assembly producing the three radiation beams was applied to be in soft contact with the fingertip at specific positions around the circumference of the fingertip. The radiation beams were horizontally incident to the skin, and a height () of the incident position from the surface of the ball of the fingertip to the center of the fiber was precisely adjusted using spacers of thickness , 0.5, 1.0, 1.5, 2.0, and 3.0 mm. The construction of the FOF means that there is also a fixed displacement equal to half the diameter of the individual clad fiber, i.e., 0.7 mm. Thus, [see also Figs. 1(a) and 1(b)]. The positions are therefore defined as (, ); (); (); (); (); and (). In addition to these positions corresponding to the different spacer thicknesses, we used two more strategic placements defined by the finger size. First, we defined a “lateral position,” termed , for which the point of contact of the incident radiation beam was equal to one-half of the thickness of the fingertip (). Second, we defined an “opposite position,” , for which the incident beam contacts the finger at a point diametrically opposite to the PD and the ball of the fingertip. Therefore, PPG measurements were made at a total of eight positions circumferentially around the fingertip. 2.2.System DescriptionFigure 2 shows a schematic diagram of the six-channel LD-based experimental system for the measurement of fingertip photoplethysmograms () with different wavelengths (). In Exp-1 only three channels were used while in Exp-2 all six channels were needed. The system consists of five units: (1) a detection unit (upper right part), (2) a pulsed LD driving unit (middle left), (3) an analog circuit unit for signals (middle right), (4) an ECG measuring unit (lowest left), and (5) a conventional personal computer. By applying a time-sharing transmission arrangement and associated synchronous demodulation, the system can simultaneously produce 6 or 12 signals, three (for Exp-1; see Sec. 2.3.3) or six (for Exp-2; see Sec. 2.3.3) for each wavelength, each comprising of a mean direct-current (DC) component () and an alternating-current (AC) component (; pulsatile component superimposed on signal). Fig. 2Schematic diagram of the six-channel laser-based experimental system for the measurement of with different wavelengths (). The three of six channels was used for the measurements in various positions of incident laser beams (Exp-1), while in the Exp-2 the six-channel was used.  The detection unit for Exp-1 has been described in Sec. 2.1, and three LDs (, 1160, and 1600 nm) were used. To conduct Exp-2, six wavelengths were chosen: 1160 nm as a reference; 1550 nm (APLD-1550-S10, Alfa Photonics Inc., Riga, Latvia: spectral width, 60 nm); 1600 nm; 1650 nm (QLD-1650-50S, QPhotonics L.L.C., Michigan: spectral width, 29 nm); 1701 nm (1702-nm DFB laser, Nanosystems and Technologies GmbH, Gerbrunn, Germany: spectral width, 15 nm; typical wavelength 1701 nm); and 1749 nm (1749-nm DFB laser, Nanosystems and Technologies GmbH, Gerbrunn, Germany: spectral width, 27 nm). Another FOF probe with external dimensions of 40-mm long and 9-mm width [FOF-probe (2)] was prepared for Exp-2, in which six optical fibers were flatpacked. Based on the International Electrotechnical Commission: IEC/EN 60825-1(2014), the intensity (power) of the pulsed laser radiation at the exit of the FOF for each wavelength was measured by a laser power meter [PM100D/S132C (photodiode power sensor), Thorlabs Inc., New Jersey] in the continuous mode of the present six-channel laser system: 4 mW at 808 nm, 2.5 mW at 1160 nm, and 5 mW at 1550, 1600, 1650, 1701, and 1749 nm, being limited to a maximum of 5 mW. Therefore, the effective power was times of each value in the pulsed laser radiation mode, which was substantially within maximum permissible exposure and accessible emission limit prescribed in the IEC/EN 60825-1. The pulsed LD driving unit has been designed based on the previous study reported elsewhere.31 This is comprised of (1) an LD driver (TXP5016, Thorlabs Inc., New Jersey), (2) an LD driver interlock, and (3) an LD mounting base. The LD is triggered by the radiation timing signals from a microprocessor (MDSPIC2012, Marutsu Elec Co. Ltd., Tokyo, Japan) in the analog circuit unit. Each LD is successively driven with a pulse duration of (), and its corresponding transmitted radiation detected by the PD is passed to the analog circuit unit via a photoamplifier (Amp; C9329, Hamamatsu Photonics K. K., Hamamatsu, Japan). In the analog circuit unit, the three or six channels of analog signals are separately extracted through the sample-and-hold (S/H) circuits, which, again, are fed with timing signals from the microprocessor. The analog signals are amplified (with variable gain) and separated by filtering using a multiple feedback Butterworth filter, and then the DC and AC components of each are further separated. The DC amplifiers are low-pass with a cut-off frequency of (first order: , ) and the AC amplifiers have passbands of 0.3 to 30 Hz (third order: , ). The analog signals representing the three (for Exp-1) or six channels (for Exp-2) of and together with the ECG signal measured using disposable spot-electrodes connected to a standard bioamplifier are sent to an analog-to-digital convertor [A/D: sampling frequency () of 1 kHz with a resolution of 16 bits; USB-6218, National Instruments Japan Corp., Tokyo, Japan], which allows digital filtering to be performed as follows. Two digital filters with sharp cut-off characteristics at the selected frequencies are employed by use of the fast Fourier transform (FFT) and inverse fast Fourier transform algorithms. The lower cut-off frequency was set at 0.5 Hz. This was determined on the basis that the respiration-induced vascular volume frequency components are less than 0.3 Hz. While the higher cut-off frequency was set at 10 Hz in this study, this was determined on the grounds that the cardiac-related components of the PPG signal have negligible frequency components above 15 Hz38 and are mainly up to 10 Hz.6,39 Also, statistical observation of the frequency spectra of the AC component of the PPG in resting healthy adults indicated that 90% to 95% of the signal power is usually contained within a spectral region extending to three times the subject’s fundamental frequency equal to heart rate.39,40 For example, when the heart rate is around 1.2 Hz in a resting adult, it is appropriate to include the second and third harmonics at 2.4 and 3.6 Hz to fully represent the AC component. Thus, almost all of the energy related to the signal of interest is mainly found below 10 Hz,9,39,40 and it is assumed in Exp-1 that the spectral power summed from 0.5 to 5 Hz () is the “signal” of the PPG and that from 5 to 10 Hz is ascribed as “”9,39 (see Fig. 3). Each participant in this experiment was asked to relax in a resting state in the darkened test room, and the measuring site was covered with a black cloth for light shielding. Therefore, the movement artifacts and interference from natural or artificial light were almost entirely eliminated or at least minimized. Any remaining noise in the overall setup could have been instrument noise from the PD, the amplifiers, environmental electromagnetic noise, and, possibly, from laser switching that can be transmitted through the power supplies. Prior to the PPG measurement, therefore, the total noise level of the output signal was checked to be more or less 0.02 [a.u], under both the completely darkened experimental room and the light-shielded PPG detection unit covered with a black cloth. Fig. 3Example of power spectra calculated by the FFT using the pulsatile component of the photoplethysmogram () during the time window () (upper right record). A spectral peak of the fundamental frequency corresponds the mean ECG R-R interval, as shown in the lowest part. 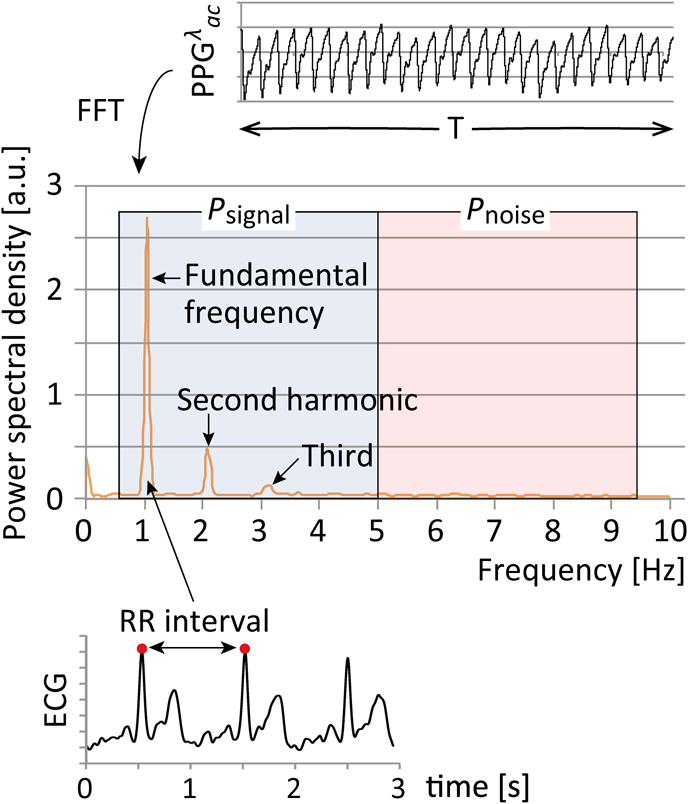 The digital data from the A/D were sent to the personal computer where real-time waveform monitoring and recording were conducted using LabVIEW 2009 software (National Instruments Japan Corp., Tokyo, Japan). 2.3.Experimental Methods2.3.1.Ethics statementThe safeguards and protocols of this study were approved by the ethics committee of Showa University School of Medicine (March 8, 2016, No. 2001), and the study was conducted in accordance with the principles expressed in the Declaration of Helsinki. Written informed consent was obtained from all of the participants after they had been provided with a complete description of the study. 2.3.2.ParticipantsWe recruited arbitrarily healthy volunteers without current cardiovascular disease to participate in the study, acquiring a total of 10 healthy male () and female () participants with a variety of ages from 24 to 75 years ( age of , thickness of fingertip of , and body mass index of ). They were requested to refrain from any medication for at least 1 day before the experiment and from smoking, intense physical activity, and taking any foods or drinks for at least 2 h before the study. 2.3.3.Procedure and experimental designThe experiment was performed in a quiet, darkened, and entry-restricted experimental room at an averaged room temperature and humidity of and 50%, respectively. The participant sat on a chair in a relaxed state with both hands placed on a desk about 20 cm below the level of their heart. The index fingertip of the left hand was used as the measuring site and was placed on the detection unit that was completely shielded from light using a black cloth. The spot electrodes were attached to the right and left wrist and the lower right abdomen as a reference to measure the lead II ECG. In order to shorten the test duration for the elderly participants, the measurement was performed only once in each experimental condition, regardless of whether or not the measurement had been completed satisfactorily. The stages of the experiment were made in the following order for the Exp-1 and -2 while the participants sat quietly. Exp-1: (a) adaptation for 2 min; (b) rest measurement for 20 s in each position of the incident radiation beams [ (, 0.5, 1, 1.5, 2, and 3), and ]. The measurement was stopped during the changing of each position, using the spacers, for , during which time the participants kept as still as possible. The changing of the spacer was handled as quickly as possible, from in ascending order to . The FOF-probe holder (see Fig. 1) was used when the measurements were made at the positions of and . The test was performed and completed within 10 min for each participant. Exp-2: 3 of the 10 participants were selected based on confirmation criteria that the measurements with 1600 nm at the (, 0.5, 1, and 1.5) were considered successful throughout the tests in Exp-1. In these selected participants, the stages of the experiment were in the following order, as (a) adaptation for 2 min and (b) rest measurement for 20 s using the radiation beam incident position, , deemed to have been the most suitable in Exp-1. The aim of this experiment was only to confirm the feasibility of collecting PPGs with multiple wavelengths as a preliminary stage before progressing toward the next major stage of the project, which would eventually involve performing glucose tolerance tests to predict BGL using the system based on pulse glucometry. 2.3.4.Evaluation of PPGλ signalIt is well known that an idealized contains the DC component and its superimposed AC component, and both of these, therefore, must be evaluated.31 In reality, the DC component itself also contains non-DC elements, an important example being the low-frequency signals at about 0.3 Hz due to respiration-induced vascular volume changes. This frequency component naturally depends on breathing and sympathetic nerve activity and is, therefore, subject to variation. As mentioned in Sec. 2.2, therefore, we used the digital filter with the low cut-off frequency of 0.5 Hz to eliminate these frequency elements,27 and the mean DC component of () was obtained as one of the evaluation measures in the Exp-1. As for the AC component, i.e., the pulsatile component of (), we particularly focused on the frequency band between 0.5 and 10 Hz, in accord with previous studies.6,9,38–40 In the present Exp-1, we specified that the spectral power summed from 0.5 to 5 Hz () is the “signal” of the and that from 5 to 10 Hz is considered as “”9,39 (see Fig. 3), as also mentioned in Sec. 2.2. Both spectral powers were obtained through the FFT (BIMUTUS II, Kissei Comtec Inc., Tokyo, Japan) using sampling points () [length of time window of recording; delete the first 2 s of the 20 s recording]. Then, the value was calculated using: With this value, we evaluated the quality of the waveforms.In addition, for Exp-1, we introduced another evaluation measure of “similarity” of waveforms measured at the wavelengths () of 1160 and 1600 nm compared to those at 808 nm as a reference. The “similarity” was evaluated on the basis of the correlation coefficients () between the successive values of the sampled every 1 ms for the time window () used in the spectral power analysis (i.e., ) measured at 808 nm and those at 1160 nm () and at 1600 nm (), which were derived from Fisher’s -transformation. 3.Results3.1.Exp-1: Evaluation of PPG Measurements in Various Positions3.1.1.Evaluation of measure of DC component of PPGFigure 4 is a summary graph showing the averaged DC components of the PPGs for the three wavelengths (; , 1160, and 1600 nm) during the time window () against the positions of the fingertip [ (, 0.5, 1, 1.5, 2, and 3 mm), , and ]. The vertical logarithmic axis denotes an arbitrary unit (a.u.) and each plot indicates the errors (SE) obtained in all participants. The values clearly show maxima at and then a gradual decrease, those with becoming very low at , , , and (from about 20 to 30 a.u.). This simply indicates that the maximal DC components at correspond to the minimal optical path length with the minimal distance between the incident laser beam point and the PD. Thus, the DC components at represent the photodetection of the backscattered radiation. The very low values of the DC components with at , , , and indicate that for these longer optical path lengths, the photons are considerably attenuated, although this is also influenced by the sensitivity of the PD and the following amplifiers. The results shown here for 1165 and 808 nm by comparison with those for 1600 nm are influenced by the strong water absorption peak at 1600 nm. 3.1.2.Evaluation measure of AC component of PPG: signal-to-noise ratioFigure 5 shows three typical simultaneous recordings of the AC components of the PPGs with three wavelengths ( (a.u.): 0.5 to 10 Hz digital band pass filtered) measured at three positions of the fingertip (, , and ), together with ECG signals for reference of cardiac contraction (lowest record). values in each position are indicated in the records. In the three charts, the pulsatile PPG waveforms (AC component) at () and at () are clearly shown for all three positions. However, the PPGs at () are only clearly shown in position . Fig. 5Three typical simultaneous recordings of the AC components of the PPGs with three wavelengths (: , 1160, and 1600 nm) measured at three positions of the fingertip shown in the middle lower part, together with ECG signals (lowest record).  Figure 6 is a summary graph showing the values in dB (ordinate) against the positions of , , and (abscissa). Each plot indicates the obtained in all participants. It is demonstrated that relatively higher values are obtained at 808 and 1160 nm in all positions. However, the values for the PPGs obtained at 1600 nm were very low in positions , , and , indicating that noise components of the waveforms were comparable with or larger than the signal components in these positions. 3.1.3.Evaluation measure of AC component of PPG: waveform similarityFigure 7 shows a summary graph of the correlation coefficients (ordinate: and ) derived from Fisher’s -transformation against the positions of , , and (abscissa). Each plot indicates the obtained in all participants. Although the mean values were over 0.9 in all positions, the mean values showed a peak of about 0.8 in the position of but less than about 0.3 in , , and . 3.2.Exp-2: Sample Recordings of Six-Channel Simultaneous PPG MeasurementThe six-channel simultaneous PPG measurements were successfully made in all of three subjects selected from 10 participants without any problems in the fingertip positions of , , or . The values were different among individuals and among wavelengths, ranging from 16.5 to 25 dB at 1160 nm, from 17.7 to 25.9 dB at 1550 nm, from 10.2 to 14.9 dB at 1600 nm, from 19.0 to 25.2 dB at 1650 nm, from 14.7 to 17.4 dB at 1701 nm, and from 19.0 to 24.5 dB at 1749 nm. Figure 8 shows an example of the simultaneous recordings of the AC components of the PPGs with six wavelengths [ (a.u.): , 1550, 1600, 1650, 1701, and 1749 nm] measured at the position of , together with the ECG signal. The values in each record are also indicated. It is demonstrated that the pulsatile PPG waveforms with all wavelengths are well recorded and are all synchronized with the ECG-R peaks. 4.DiscussionPhotoplethysmography attracts considerable interest as a simple, noninvasive, low cost method for the monitoring of physiological variables of value in research and routine clinical applications. In this study, we aimed to explore the possibility of enhancing the ability of photoplethysmography to measure BGL using our method of pulse glucometry. As its name suggests, pulse glucometry is based on the analysis of the cardiac-related pulsatile component, or AC component, of the photoplethysmogram, . We have conducted successful in vivo proof-of-principle studies of pulse glucometry and good results have been achieved when using large-scale, sophisticated, custom-built laboratory instrumentation.27 For the widespread use of pulse glucometry for BGL measurement it is essential to provide for reliable, easy to use instrumentation, with appropriate precision and accuracy, at an affordable cost. We hypothesised that this could be achieved with very simple instrumentation by establishing geometrical conditions for the optical source and detector under which PPGs could be reliably and accurately obtained at wavelengths appropriate for the BGL estimations. A major part of the technical challenge has been that of overcoming the influences of photon absorption by water while, at the same time, achieving specificity in the recovery of data from selected glucose absorption band. The basis of our experimental protocol was to compare PPGs obtained with three chosen wavelengths (, 1160, and 1600 nm) while the source-detector spacing was successively increased circumferentially around a fingertip (see Fig. 1). In the case of using the spacer of thickness , the range of the height () between the incident laser point and the surface of the fingertip ball was from 0.7 to 3.7 mm, giving source-detector spacing ranging from to 7 mm. The optical path lengths for each position of the source depend on the finger size, the scattering coefficient, the optical absorbance, and the anisotropy of the interrogated tissues, as is well known. The most significant and, initially, surprising results are seen in Fig. 5. First, although for the (opposite) and (lateral) positions, the 1600-nm source did not produce any recognizable AC component of the PPG, at the position a very clear AC component was produced. This is a very optimistic finding regarding potential BGL measurement with pulse glucometry. Second, the AC components of the PPGs obtained with the 808- and 1160-nm sources at the position were significantly increased as compared with those obtained at the and positions. By simply considering the progressive reduction in the optical path length from positions , through to , we would expect the optical attenuation for all three wavelengths to decrease correspondingly as the path length decreases. The higher signal at the position to detect the backscattered radiation due to decrease in path length is also seen very clearly in Fig. 4, that is, the DC components of the PPGs increase as path length is decreased. As expected, this indicates that the attenuation of the interrogating radiation beam diminishes as the spacing is reduced (see also Ref. 41), and so the rate of arrival of the photon stream at the detector increases and this then feeds through to produce a larger . It should be noted that in Fig. 5, the -axis scales are different for the three wavelengths, for the position the 1600-nm is 5 a.u. pk-to-pk, the 1160-nm is 20 a.u. pk-to-pk, and the 808-nm is 100 a.u. pk-to-pk (these a.u. are the same as the a.u. in Fig. 4). Clearly these differences reflect the different absorption and scattering coefficients of the interrogated tissues at the three wavelengths. It is well known that the source-detector placement on or around an interrogated tissue, in the present case the index finger, can be a major factor in defining the volume of tissues being interrogated. In this study, we have the two extreme situations. First, the configuration is essentially the same as conventional transmission photoplethysmography, which is most commonly used for pulse oximetry. Second, the configuration is effectively the backscatter or diffuse reflectance form of photoplethysmography. In the transmission case, photons arriving at the detector have mostly been propagated in the forward direction from the source and the volume of tissue interrogated, from which the PPGs arise, is almost cylindrical [see Fig. 9(a)]. The geometrical path length in this case is equal to the finger thickness formed by the source and the detector. The average optical path length is greater than the physical path length due to scatter, and this can be estimated by using a path length factor.35 The PPG produced in this transmission case will reflect, first, the semifixed attenuation as seen in the DC component and, second, the cardiac-related blood volume pulsations of the vascular elements interrogated within the cylindrically shaped volume, as seen in the AC component. The vascular components include the large digital arteries and veins as well as parts of the skin microcirculation, with its capillary bed, and parts of the arteriolar network. Fig. 9Schematic drawings of possible photon propagation paths in a fingertip in case of the incident radiation source with wavelength region of water absorption. (a) In the incident position of , randomly scattered radiation in the tissue is absorbed with few photons reaching the PD. (b) In the incident position , photons are highly absorbed but some are reaching the PD. (c) In the incident position , almost all photons in the tissue are absorbed, but some forward- and side-scatted radiation can be detected by the PD.  In the second case, where the configuration creates conditions for backscatter or diffuse reflectance, the vascular compartment of the tissues being interrogated is almost entirely that of the skin circulation in the superficial regions of the dermis, which includes the capillary loops that rise from the dermal vasculature and the arterioles [see Fig. 9(b)]. The optical path in this case is the familiar “banana-shape,”35 stretching from the point of contact of the interrogating beam with the skin surface, through the skin circulatory layers, to the contact area formed by the skin surface and the silica glass plate on the surface of the PD. The penetration depth of the interrogating beam, under the conditions of diffuse reflectance, is commonly known to be approximately half of the physical spacing between the source and detector. If the source-detector spacing is 5 mm, then the depth of penetration will be 2.5 mm, which would be sufficient to embrace the epidermis, the capillary bed, and the upper regions of the intradermal arterioles. As is increased, the physical path length increases and so too does the optical path length. The net effect is to increase the depth of penetration and with it the interrogated volume to include more of the arteriolar regions and even the more major arterial and venous vessels. Based on these theoretical considerations, we see the combination of several opposing phenomena. We have the adverse effect arising from the increased water absorption at 1600 nm as compared with that seen with both 808 and 1160 nm. Then, we see that reducing the source-detector spacing produces a concomitant reduction of the optical path length, which results in shallower penetration depth. The latter would tend to reduce the ability of the system to detect the pulsatile component of the PPG (). However, at the same time, the reduction in the optical path length reduces the attenuation of the interrogating beam, especially that due to water absorption, allowing more penetration, and yielding larger signals. Since the signals for 1600 nm are small relative to those obtained at 808 and 1160 nm, it is pertinent to consider the achieved for each wavelength as this will influence the precision and accuracy of BGL estimates derived by pulse glucometry. The values were calculated from the power spectra of the AC component (), and as can be seen in Fig. 6, although the for the 1600-nm wavelength is extremely low for the longest three source-detector positions it rises steadily as is reduced, reaching around 12.5 dB at . This is to be expected, since the optical path length and attenuation both fall as is reduced so there must be more signal. The results of the similarity analysis (see Fig. 7), again, are relatively poor for the longer positions, and are very good for , , and . Inevitably, as the signals increase in size they become clearer and the noise components will appear to diminish in relative terms. The results of Exp-2 provide encouraging evidence that simple instrumentation could be developed to approach the goal of implementing the principles of pulse glucometry for easy to use, affordable, and noninvasive measurement of BGL. Based on the findings from Exp-1 to determine an appropriate arrangement of the source and detector, Exp-2 successfully confirmed the possibility of reliable PPG measurement with multiple wavelengths having glucose optical absorption bands around the region of 1600 nm. Although there were only three subjects in this experiment from the 10 participants taking part in Exp-1, the results were convincing. The outputs of the six LDs were applied to the side of the fingertip using the FOF-probe (2) embedded with six optical fibers; one LD had a peak wavelength of 1160 nm (mentioned above) as a reference, and the other five LDs were 1550, 1600, 1650, 1701, and 1749 nm. The magnitude of the for the six wavelengths differ somewhat, as would be expected from the differences in the degree of attenuation by water and other species. Similarly, the values for the six wavelengths differ, ranging from 10.2 dB at 1600 nm to 19.0 dB for both 1650 and 1749 nm. Although we have previously reported the successful simultaneous multichannel measurement of PPGs with a relatively bulky high-speed spectrophotometer,27 the simple and convenient technique proposed here to collect similar PPGs is a significant advance. 5.ConclusionWe have described a geometrical arrangement of a radiation source (LD) and a PD for the measurement of PPGs, which we term “side-scattered finger-photoplethysmography,” particularly focusing on the wavelength regions where there exists very strong optical absorption by the water component in the tissue but where there is potential for BGL measurement. A six-channel experimental laser-based system was developed for the experimental investigations to search for an appropriate source-detector configuration around the fingertip using three wavelengths; 808 nm, an isosbestic point of oxy- and deoxyhemoglobins; 1160 nm, one of blood alcohol absorption peaks; and 1600 nm, an absorption peak of glucose. In 10 healthy adult subjects, we have been able to observe clear cardiac-related pulsatile changes in optical intensity at the wavelengths of 808 and 1160 nm in any incident positions, but reliable detection of the PPG was only possible at 1600 nm when the source-detector distance was less than around the finger circumference. We conclude through the present experiment that this orthogonal arrangement of the LD and the PD to detect forward- and side-scattered radiation through the tissue is the most appropriate for the PPG measurement especially in wavelength regions with very strong optical absorption by the tissue water. Based on this arrangement, we have also been able to measure successfully the simultaneous PPGs with six wavelengths; one was 1160 nm used as a reference and the other five included the optical absorption bands of glucose, suggesting that the technique could have potential for practical use in achieving noninvasive optical measurement of BGL using the “pulse glucometry” technique previously reported. Since the present study is an initial development to investigate the new technique, further work including, e.g., Monte Carlo simulation analysis, is required to optimize the geometrical arrangement for more practical and easier use. We also aim to further reduce the instrumentation noise, thereby improving the , for example, by utilizing a time averaging technique applied to PPG signals so as to improve the noninvasive BGL measurement. AcknowledgmentsThis work was supported in part by the Ministry of Education, Science, Sports and Culture, Grant-in-Aid for Scientific Research (A) (Award No. 26242044), and for Challenging Exploratory Research (Award No. 16K12884). ReferencesJ. P. Woodcock, Theory and Practice of Blood Flow Measurement, 166
–189 Butterworths, Massachusetts
(1975). Google Scholar
J. Nyboer, Electrical Impedance Plethysmography, 390 2nd ed.C. C. Thomas Publishing, Springfield, Illinois
(1970). Google Scholar
W. G. Kubicek et al.,
“Impedance cardiography as a noninvasive means to monitor cardiac function,”
J. Assoc. Adv. Med. Instrum., 4
(2), 79
–84
(1970). AMIJAH 0004-5446 Google Scholar
A. Roggan et al.,
“Optical properties of circulating human blood in the wavelength range 400–2500 nm,”
J. Biomed. Opt., 4
(1), 36
–46
(1999). http://dx.doi.org/10.1117/1.429919 JBOPFO 1083-3668 Google Scholar
V. V. Tuchin, Tissue Optics, Light Scattering Methods and Instruments for Medical Diagnosis, 143
–192 2nd ed.SPIE Press, Bellingham, Washington
(2007). Google Scholar
A. A. Kamal et al.,
“Skin photoplethysmography––a review,”
Comput. Methods Programs Biomed., 28
(4), 257
–269
(1989). http://dx.doi.org/10.1016/0169-2607(89)90159-4 CMPBEK 0169-2607 Google Scholar
J. Allen,
“Photoplethysmography and its application in clinical physiological measurement,”
Physiol. Meas., 28
(3), R1
–R39
(2007). http://dx.doi.org/10.1088/0967-3334/28/3/R01 PMEAE3 0967-3334 Google Scholar
K. Matsumura and T. Yamakoshi,
“iPhysioMeter: a new approach for measuring heart rate and normalized pulse volume using only a smartphone,”
Behav. Res. Methods, 45
(4), 1272
–1278
(2013). http://dx.doi.org/10.3758/s13428-012-0312-z Google Scholar
K. Matsumura et al.,
“iPhone 4s photoplethysmography: which light color yields the most accurate heart rate and normalized pulse volume using the iPhysioMeter application in the presence of motion artifact?,”
PLoS One, 9
(3), e91205
(2014). http://dx.doi.org/10.1371/journal.pone.0091205 POLNCL 1932-6203 Google Scholar
K. Yamakoshi et al.,
“New oscillometric method for indirect measurement of systolic and mean arterial pressure in the human finger. Part 1: model experiment,”
Med. Biol. Eng. Comput., 20
(3), 307
–313
(1982). http://dx.doi.org/10.1007/BF02442797 MBECDY 0140-0118 Google Scholar
K. Yamakoshi et al.,
“New oscillometric method for indirect measurement of systolic and mean arterial pressure in the human finger. Part 2: correlation study,”
Med. Biol. Eng. Comput., 20
(3), 314
–318
(1982). http://dx.doi.org/10.1007/BF02442798 MBECDY 0140-0118 Google Scholar
K. Yamakoshi,
“Non-invasive cardiovascular haemodynamic measurements,”
Sensors in Medicine and Health Care (Sensors Applications, Volume 3), 107
–160 Wiley-VCH Verlag, Weinheim
(2004). Google Scholar
K. Yamakoshi, H. Shimazu and T. Togawa,
“Indirect measurement of instantaneous arterial blood pressure in the human finger by the vascular unloading technique,”
IEEE Trans. Biomed. Eng., BME-27
(3), 150
–155
(1980). http://dx.doi.org/10.1109/TBME.1980.326616 IEBEAX 0018-9294 Google Scholar
T. Yamakoshi et al.,
“Potential for health screening using long-term cardiovascular parameters measured by finger volume-oscillometry: pilot comparative evaluation in regular and sleep-deprived activities,”
IEEE J. Biomed. Health Inf., 18
(1), 28
–35
(2014). http://dx.doi.org/10.1109/JBHI.2013.2274460 Google Scholar
Y. Sawada, G. Tanaka and K. Yamakoshi,
“Normalized pulse volume (NPV) derived photo-plethysmographically as a more valid measure of the finger vascular tone,”
Int. J. Psychophysiol., 41
(1), 1
–10
(2001). http://dx.doi.org/10.1016/S0167-8760(00)00162-8 IJPSEE 0167-8760 Google Scholar
S. C. Millasseau et al.,
“Contour analysis of the photoplethysmographic pulse measured at the finger,”
J. Hypertens., 24
(8), 1449
–1456
(2006). http://dx.doi.org/10.1097/01.hjh.0000239277.05068.87 JOHYD3 0263-6352 Google Scholar
J. Lee et al.,
“Validation of normalized pulse volume in the outer ear as a simple measure of sympathetic activity using warm and cold pressor tests: towards applications in ambulatory monitoring,”
Physiol. Meas., 34
(3), 359
–375
(2013). http://dx.doi.org/10.1088/0967-3334/34/3/359 PMEAE3 0967-3334 Google Scholar
G. Tanaka et al.,
“A novel photoplethysmography technique to derive normalized arterial stiffness as a blood pressure independent measure in the finger vascular bed,”
Physiol. Meas., 32
(11), 1869
–1883
(2011). http://dx.doi.org/10.1088/0967-3334/32/11/003 PMEAE3 0967-3334 Google Scholar
R. Bonner and R. Nossal,
“Model for laser Doppler measurements of blood flow in tissue,”
Appl. Opt., 20
(12), 2097
–2107
(1981). http://dx.doi.org/10.1364/AO.20.002097 APOPAI 0003-6935 Google Scholar
A. N. Obeid et al.,
“Depth discrimination in laser Doppler skin blood flow measurement using different lasers,”
Med. Biol. Eng. Comput., 26
(4), 415
–424
(1988). http://dx.doi.org/10.1007/BF02442302 MBECDY 0140-0118 Google Scholar
T. Aoyagi, M. Kishi and K. Yamaguchi,
“Improvement of the ear piece oximeter,”
in 13th Meeting of the Japanese Society for Medical Electronics and Biological Engineering,
90
–91
(1974). Google Scholar
S. M. Lopez Silva, M. L. Dotor Castilla and J. P. Silveira Martin,
“Near-infrared transmittance pulse oximetry with laser diodes,”
J. Biomed. Opt., 8
(3), 525
–533
(2003). http://dx.doi.org/10.1117/1.1578495 JBOPFO 1083-3668 Google Scholar
T. Iijima et al.,
“Cardiac output and circulating blood volume analysis by pulse dye-densitometry,”
J. Clin. Monit., 13
(2), 81
–89
(1997). http://dx.doi.org/10.1023/A:1007339924083 JCMOEH 0748-1977 Google Scholar
Y. Maeda, M. Sekine and T. Tamura,
“The advantages of wearable green reflected photoplethysmography,”
J. Med. Syst., 35
(5), 829
–834
(2011). http://dx.doi.org/10.1007/s10916-010-9506-z JMSYDA 0148-5598 Google Scholar
J. Lee et al.,
“Comparison between red, green and blue light reflection photoplethysmography for heart rate monitoring during motion,”
Conf. Proc. IEEE Eng. Med. Biol. Soc., 2013 1724
–1727
(2013). http://dx.doi.org/10.1109/EMBC.2013.6609852 Google Scholar
T. Yamakoshi et al.,
“[A preliminary study on development of a novel optical instrument for non-invasive blood alcohol measurement: proposal of Pulse Alcometry],”
Trans. Jpn. Soc. Med. Biol. Eng., 50
(2), 237
–247
(2012). Google Scholar
K. Yamakoshi and Y. Yamakoshi,
“Pulse glucometry: a new approach for noninvasive blood glucose measurement using instantaneous differential near-infrared spectrophotometry,”
J. Biomed. Opt., 11
(5), 054028
(2006). http://dx.doi.org/10.1117/1.2360919 JBOPFO 1083-3668 Google Scholar
G. J. Michalak et al.,
“Three-wavelength murine photoplethysmography for estimation of vascular gold nanorod concentration,”
Opt. Express., 18
(25), 26535
–26549
(2010). http://dx.doi.org/10.1364/OE.18.026535 OPEXFF 1094-4087 Google Scholar
H. M. Heise, A. Bittner and R. Marbach,
“Clinical chemistry and near-infrared spectroscopy: technology for non-invasive glucose monitoring,”
J. Near Infrared Spectrosc., 6 349
–359
(1998). http://dx.doi.org/10.1255/jnirs.156 Google Scholar
H. M. Heise and A. Bittner,
“Near infrared spectrometric investigation of pulsatile blood flow for non-invasive metabolite monitoring, Fourier transform spectroscopy,”
in 11th Int. Conf. AIP Conf. Proc.,
282
–285
(1998). http://dx.doi.org/10.1063/1.55781 Google Scholar
T. Yamakoshi et al.,
“Integrating sphere finger-photoplethysmography: preliminary investigation towards practical non-invasive measurement of blood constituents,”
PLoS One, 10
(12), e0143506
(2015). http://dx.doi.org/10.1371/journal.pone.0143506 POLNCL 1932-6203 Google Scholar
R. R. Anderson and J. A. Parrish,
“The optics of human skin,”
J. Invest. Dermatol., 77
(1), 13
–19
(1981). http://dx.doi.org/10.1111/1523-1747.ep12479191 JIDEAE 0022-202X Google Scholar
W. J. Cui, L. E. Ostrander and B. Y. Lee,
“In vivo reflectance of blood and tissue as a function of light wavelength,”
IEEE Trans. Biomed. Eng., 37
(6), 632
–639
(1990). http://dx.doi.org/10.1109/10.55667 IEBEAX 0018-9294 Google Scholar
Q. Cao et al.,
“Multispectral imaging in the extended near-infrared window based on endogenous chromophores,”
J. Biomed. Opt., 18
(10), 101318
(2013). http://dx.doi.org/10.1117/1.JBO.18.10.101318 JBOPFO 1083-3668 Google Scholar
P. Rolfe,
“In vivo near infrared spectroscopy,”
Annu. Rev. Biomed. Eng., 2 715
–754
(2000). http://dx.doi.org/10.1146/annurev.bioeng.2.1.715 ARBEF7 1523-9829 Google Scholar
T. J. Akl et al.,
“Intestinal perfusion monitoring using photoplethysmography,”
J. Biomed. Opt., 18
(8), 087005
(2013). http://dx.doi.org/10.1117/1.JBO.18.8.087005 JBOPFO 1083-3668 Google Scholar
Thorlabs, FDG1010 Spec Sheet,
(2017) https://www.thorlabs.co.jp/thorproduct.cfm?partnumber=FDG1010 June ). 2017). Google Scholar
J. A. C. Patterson, D. G. McIlwraith and G. Yang,
“A flexible, low noise reflective PPG sensor platform for ear-worn heart rate monitoring,”
in Body Sensor Networks,
286
–291
(2009). http://dx.doi.org/10.1109/BSN.2009.16 Google Scholar
M. J. Hayes and P. R. Smith,
“A new method for pulse oximetry possessing inherent insensitivity to artifact,”
IEEE Trans. Biomed. Eng., 48
(4), 452
–461
(2001). http://dx.doi.org/10.1109/10.915711 IEBEAX 0018-9294 Google Scholar
M. J. Hayes and P. R. Smith,
“Quantitative evaluation pf photoplethysmographic artifact reduction for pulse oximetry,”
Proc. SPIE, 3570 138
(1998). http://dx.doi.org/10.1117/12.336924 Google Scholar
A. J. Welch, M. J. C. van Gemert, W. M. Star,
“Definitions and overview of tissue optics,”
Optical-Thermal Response of Laser-Irradiated Tissue, 27
–64 2nd ed.Springer, Dordrecht
(2011). Google Scholar
BiographyYasuhiro Yamakoshi is currently a research fellow at the Graduate School of Information Science and Technology, Hokkaido University, Sapporo, Japan. He received his BS degree in ocean engineering from Hokkaido Tokai University, Sapporo, in 2000, and his PhD in biomedical engineering from Chiba University, Chiba, in 2010. His current research interests include noninvasive biomedical measurements, healthcare monitoring, and optoelectronic systems. Kenta Matsumura is currently a research fellow at the Graduate School of Information Science and Technology, Hokkaido University, Sapporo, Japan. He received his PhD in human sciences from Hokkaido University. His current research interests include cardiovascular psychophysiology, post-traumatic stress disorder, cognitive neuroscience, physiological measurement, mobile health, and soft computing. Takehiro Yamakoshi is currently an associate professor at the Information Systems and Engineering, Graduate School of Engineering, Fukuoka Institute of Technology, Fukuoka, Japan. He received his BS and MS degrees in engineering from Muroran Institute of Technology, Muroran, in 1998 and 2000, respectively, and his PhD in biomedical engineering from Fukui University, Fukui, in 2006. His current research interests include physiological measurement, biosignal analysis, biomedical optics, and physiological measurement for safer driving. Jihyoung Lee is currently an assistant professor at the Information and Systems Engineering, Graduate School of Engineering, Fukuoka Institute of Technology, Fukuoka, Japan. He received his MS degree from the Graduate School of Electronics and Electrical Engineering from Dankook University, Yongin-si, Korea, in 2011, and his PhD from the Graduate School of Natural Science and Technology, Kanazawa University, Kanazawa, Japan, 2014. His current research interests include physiological measurements, noninvasive biomedical measurement systems, and wearable healthcare systems. Peter Rolfe is a founder/director of at Oxford BioHorizons Ltd., United Kingdom, and is a visiting professor at Harbin Institute of Technology, China. His research includes invasive and noninvasive physiological measurement, cell/tissue engineering, near infrared spectroscopy and biomedical optics, micro- and nanosensors for environmental monitoring and food safety, and technologies for perinatal care in developing countries. He was editor-in-chief of two international biomedical journals, acted as consultant to WHO, and was founder professor of BME and Medical Physics at Keele, United Kingdom. Yuji Kato is currently an assistant professor at the Graduate School of Information Science and Technology, Hokkaido University. He received his BS, MS, and PhD degrees from Tohoku University, Sendai, in 1989, 1991, and 1994, respectively. His current research interests include biomedical optics, noninvasive biomedical measurements, and optical engineering. Koichi Shimizu received his MS and PhD degrees, from the University of Washington (UW), Seattle, USA, in 1976 and 1979, respectively. He was a research associate at UW 1974 to 1979 and an assistant, associate professor, and professor at Hokkaido University, Sapporo, Japan, in 1979 to 2016. He is currently a professor at Waseda University, Kitakyushu, Japan. He served as an associate editor of IEEE Trans. ITB in 1999 to 2007. He has been a fellow of the Electromagnetics Academy and an editorial board member of Scientific Reports. Ken-ichi Yamakoshi is currently an affiliate professor at Showa University School of Medicine, Tokyo, Japan, affiliate professor at Hokkaido University of Science, Sapporo, emeritus professor at Kanazawa University, Kanazawa, and head at the NPO Research Institute of Life Benefit, Sapporo. He received his DMed and DEng degrees from Tokyo Medical and Dental University, in 1979, and Waseda University, Tokyo, in 1982, respectively. His research interests include noninvasive physiological measurements and instrumentation, health care monitoring, cardiovascular biomechanics, and rehabilitation engineering. |


