
|
|
1.IntroductionSince the 1870s, when the first brain cell, the neuron, was isolated from its neighbors and identified by Golgi’s “black reaction” stain, scientists have been trying to characterize and understand the complexity of neuronal structure, network connectivity, and function.1 Today, neuroscientists work with cell cultures because the technique provides direct access to neurons for the experimental manipulation, observation, and imaging. Cell morphology and neurite (axonal and dendritic) growth (length), retraction (shrinking), and arborization (number and branch pattern) are well-studied properties of neurons that are used to assess the overall health of neurons, as well as the toxicity of potentially hazardous chemicals and environmental conditions2,3 Digital holographic microscopy and optical diffraction tomography have been used to quantitatively image and analyze neurons across a wide range of timescales (ms to h) in neuronal cultures.4–6 The current techniques used to quantify these characteristics depend on cell-permeant dyes, fluorescent probes, immunostaining, and advanced imaging technologies and, thus, are time consuming, costly, subjective, and error prone.7–10 Furthermore, there is a lack of adequate tools for rapid quantitative analysis of massive image files compatible with high-throughput analysis.11,12 In this report, we use spatial light interference microscopy (SLIM), a noncontact, label-free, specialized quantitative phase imaging technique, and NeuronJ, a semiautomated tracing program, to image and quantify neurite outgrowth.7,12,13 For a brief review of the various biomedical studies using SLIM, see Refs. 1415.16.17.18.19.20.21.22.23.24.25.–26. This methodology is unique because it provides the means to image many living neurons over time. We analyzed neurons and more than 1000 neurites in a 60-mm glass-bottomed dish over 28.4 h, across a range of low, medium, and high cell confluence conditions. SLIM provides the means to collect large data sets of single-cell analysis, cell-to-cell interactions, and network dynamics of living neurons over time via a nondestructive (i.e., no lysis or fixation required) and unbiased quantitative method. 2.Materials and Method2.1.Cell Culture PreparationCortical neurons obtained from the referenced source were cultured, maintained, and processed from postnatal (P0 to P1) C57BL/6 mice as previously described.27 Frozen neurons were thawed rapidly at 37°C and plated on poly-d-lysine-coated 60-mm glass-bottomed petri dishes. Cultures () were initially incubated with a plating media containing 86.55% MEM Eagle’s with Earle’s BSS (Lonza), 10% fetal bovine serum (refiltered, heat inactivated; ThermoFisher), 0.45% of 20% (wt/vol) glucose, 100-mM sodium pyruvate (; Sigma), 200-mM glutamine (; Sigma), and penicillin/streptomycin (; Sigma) for 4 h at 37°C and 5% . The cells were then grown in standard maintenance media containing neurobasal growth medium supplemented with B-27 (Invitrogen), 1% 200-mM glutamine (Invitrogen), and 1% penicillin/streptomycin (Invitrogen) at 37°C, in the presence of 5% . Half the media was aspirated twice a week and replaced with fresh maintenance media warmed to 37°C. Live imaging studies took place on days in vitro 3. 2.2.Spatial Light Interference Microscopy of Cell CulturesImages were acquired with an SLIM system. The system is composed of the SLIM attachment module (Cell Vista SLIM Pro, Phi Optics, Inc.) attached to a commercial phase contrast microscope (Axio Observer Z1, Zeiss). The SLIM module contains a lens system and a spatial light modulator (SLM). As the scattered and reference beam integrate at the image plane, SLIM provides four phase shifts to the reference beam at increments of (90 deg, 180 deg, 270 deg, and 360 deg). As a result, four images corresponding to each phase shift are recorded sequentially by the complementary metal–oxide–semiconductor camera (sCMOS) camera (Fig. 1). The recorded intensity images are then combined to produce one image that yields quantitative phase maps of the sample [Figs. 2(a)–2(d)]. With these phase maps, information about the sample’s thickness, density, and refractive index can be extracted in a label-free, unbiased, and nondestructive mode.12,28,29 For a review on QPI, see Ref. 30. Kandel et al.31 provided more information about the SLIM operation. Fig. 1SLIM schematic setup. The SLIM module denoted by the blue box (Cell Vista SLIM Pro, Phi Optics, Inc.) is attached to an existing phase contrast microscope and is composed of lenses L1 to L4, a polarizer (P), and the SLM [Meadowlark XY series ()]. The SLM is a liquid crystal phase mask externally matched to the conjugate plane of the objective that provides additional phase shifts between the incident and scattered lights in increments of (90 deg). Images are recorded by a camera (Andor Zyla 5.5 sCMOS). The computer compiles the final image.  Fig. 2Representative quantitative phase images of three different confluence levels: (a) low confluence (LC), with fewer than 20 neurons per field of view; (b) medium confluence (MC), with 30 to 50 neurons per field of view; (c) high confluence (HC), with more than 50 neurons per field of view. (d) Colorbar indicates phase shift in radians; (e–g) sample images of neurites traced by NeuronJ. Neurites are labeled as follows: axon, red; secondary, yellow; tertiary, cyan; dendrite, blue; type 06, green; and default, pink.  2.3.Neuron JNeurites emerging from soma were individually traced and measured using the semiautomated tracing NeuronJ program. NeuronJ is a free image analysis software distributed by the National Institutes of Health as a plugin for ImageJ.32 Morphometric data were collected on a cell-by-cell basis. After tracing each neurite and assigning the type of neurite (primary axon, primary dendrite, and secondary and tertiary neurites for example), the tracings appeared color coded; see Figs. 2(e)–2(g). The neurite data were assigned to clusters according to neurite type and batch processed by NeuronJ; a text file containing neurite length measurements was generated for each neuron traced, and a snapshot of tracings overlaid on the neuron was saved as a TIFF file [Figs. 2(e)–2(g)]. Measurements were then averaged to obtain the average number of neurites per neuron, the mean neurite length per neuron, and the mean neurite length per neurite. Neurites with ambiguous origin, i.e., those that appeared to emerge or contact multiple cell bodies, were not included in the analysis. 3.ResultsAt the time of plating, the cells appeared to be spherical in shape with no apparent neurites. Following the exchange of plating media to maintenance media, thin neurites emerged from a portion of the cell bodies. By 24 h, most of the cells were multipolar and had between one and three long neurites (Fig. 2). The neurons resembled those described in previous studies; they typically had small round cell bodies (20 to in diameter).27 Plating density increased along a radial gradient. In the low- and medium-confluence regions, the morphological properties of individual cells could easily be distinguished and acquired. In the high-confluence regions, the complexity of shingling, a phenomenon whereby neurites overlap substantially,33 and clustering of cell bodies prevented accurate neurite length measurements. Additionally, neurites with ambiguous origin, i.e., those that appeared to emerge or contact multiple cell bodies, were not included in the analysis. Figures 2(a)–2(c) show representative SLIM images of single fields of view at low, medium, and high confluences. The corresponding ImageJ tracings are shown in Figs. 2(d)–2(g). The neurites were color coded such that axons are red, secondary neurites coming off the primary axon are yellow, tertiary neurites are cyan, dendrites are blue, and secondary branches projecting from the dendrites are green. We designated the longest neurite of a constant diameter as the axon. Dendrites are thicker (up to at their base) and tapered over their entire length. Quantitative analysis of neurite length in microns, averaged per neuron and per neurite, over 28.4 h is shown in Fig. 3. In Fig. 3(a), average neurite length, per neuron in low- (black circles) and medium- (red squares) confluence conditions is measured. We found that there is a steady increase in neurite length over time both in low- and medium-confluence areas. However, the growth rate is higher in the low-confluence areas. This result indicates that neurons, which are far away from neighboring neurons, are extending their neurites more to find and connect to the adjacent neurons. The high-confluence data were omitted in Fig. 3(a) because the clustering and overlapping of soma margins, as well as shingling, made it difficult to measure neurite length accurately and identify neurite origin. The average neurite length, over time, in various confluence regions is shown in Fig. 3(b). There is a steady increase in neurite length in both low- and medium-confluence areas, but the high-confluence regions indicate essentially no growth. The average neurite length at low confluence shows a faster growth rate. In high-confluence areas, the length of neurites shows no overall length growth. This is most likely because neurons in this region already have stable and committed connections with other cells. Fig. 3Measurement of neurite outgrowth from primary cortical neurons over time. (a) Average neurite length per neuron at different confluence levels. The average was computed on cells in the LC groups and cells in the MC group. (b) Average neurite length at different confluence levels. The average was computed over neurites (LC), neurites (MC), and neurites (HC). The dash lines indicate linear fits and parameter is the slope, in units of microns per hour.  Figure 4 shows separately the average axonal and dendritic neurite outgrowth length from the primary cortical neurons over time. In Fig. 4(a), average axon length in low- and medium-confluence conditions is shown. We find that there is a steady increase in average axon length in both low- and medium confluences. However, the average axon growth rate is higher in the low-confluence regions. This result indicates that neurons that are far away from their neighboring neurons extend their axons farther and grow at an increased rate to find and connect to more distantly located neurons. In Fig. 4(b), the average dendrite length in low- and medium-confluence conditions is shown. We find that there is a steady increase in dendrite length in low but not in medium-confluence cells. This result indicates that dendrites show more dynamic changes. They sometimes grow and shrink (i.e., they appear and disappear more readily over time). This is consistent with what we observe. In addition to neurite outgrowth, we also observe retraction of neurites. At low confluence, the number of dendrites varied from 118 to 160 over the 28.4 h of imaging, while in the areas of medium confluence, the number of dendrites ranged from 196 to 227 over the 28.4 h. Again, high-confluence regions were not analyzed because the overcrowding of cell bodies and shingling of neurites made it impossible to determine neurite origin or length (growth path). Fig. 4Measurement of axonal and dendritic outgrowth from primary cortical neurons over time. (a) Average axon length in different confluence levels. The average was computed on axons (LC) and (MC). (b) Average dendrite length in different confluence conditions. The average was computed over dendrites (LC) and dendrites (MC). The dash lines represent linear fits with as slope, in units of micrometer per hour.  Figure 5 shows the probability distribution for the change in neurite length in low- [Figs. 5(a), 5(d), and 5(f)], medium- [Figs. 5(b), 5(e), and 5(g)], and high-[Fig. 5(c)] confluence conditions. This is reported as frequency across 22 different time frames, for which the histograms of neurite length change are shown in Fig. 5. In low-confluence areas, each neurite increased its length on average by [Fig. 5(a)], its axon length by [Fig. 5(d)], and its dendrite length by [Fig. 5(f)]. In medium-confluence conditions, each neurite increased its length on average by [Fig. 5(b)], its axon length by [Fig. 5(e)], and its dendrite by [Fig. 5(g)]. Figure 5(c) shows that on average neurite length in the high-confluence regions decreased by over time. These results indicate that over time, all types of neurites increase in length in low- and medium-confluence areas. All neurites in low-confluence areas increase at a faster rate than in the medium-confluence conditions. Thus, as expected, proximity of neuron neighbors influences neurite length and neurite outgrowth rate. Fig. 5Histograms of change in neurite length as a function of confluence conditions. (a–c) Histograms of neurite length change across the LC, MC, and HC groups, as indicated. (d, e) Histograms of axonal length change for the LC and MC groups, as indicated. (f, g) Histograms of dendrite length change for the LC and MC groups, as indicated. 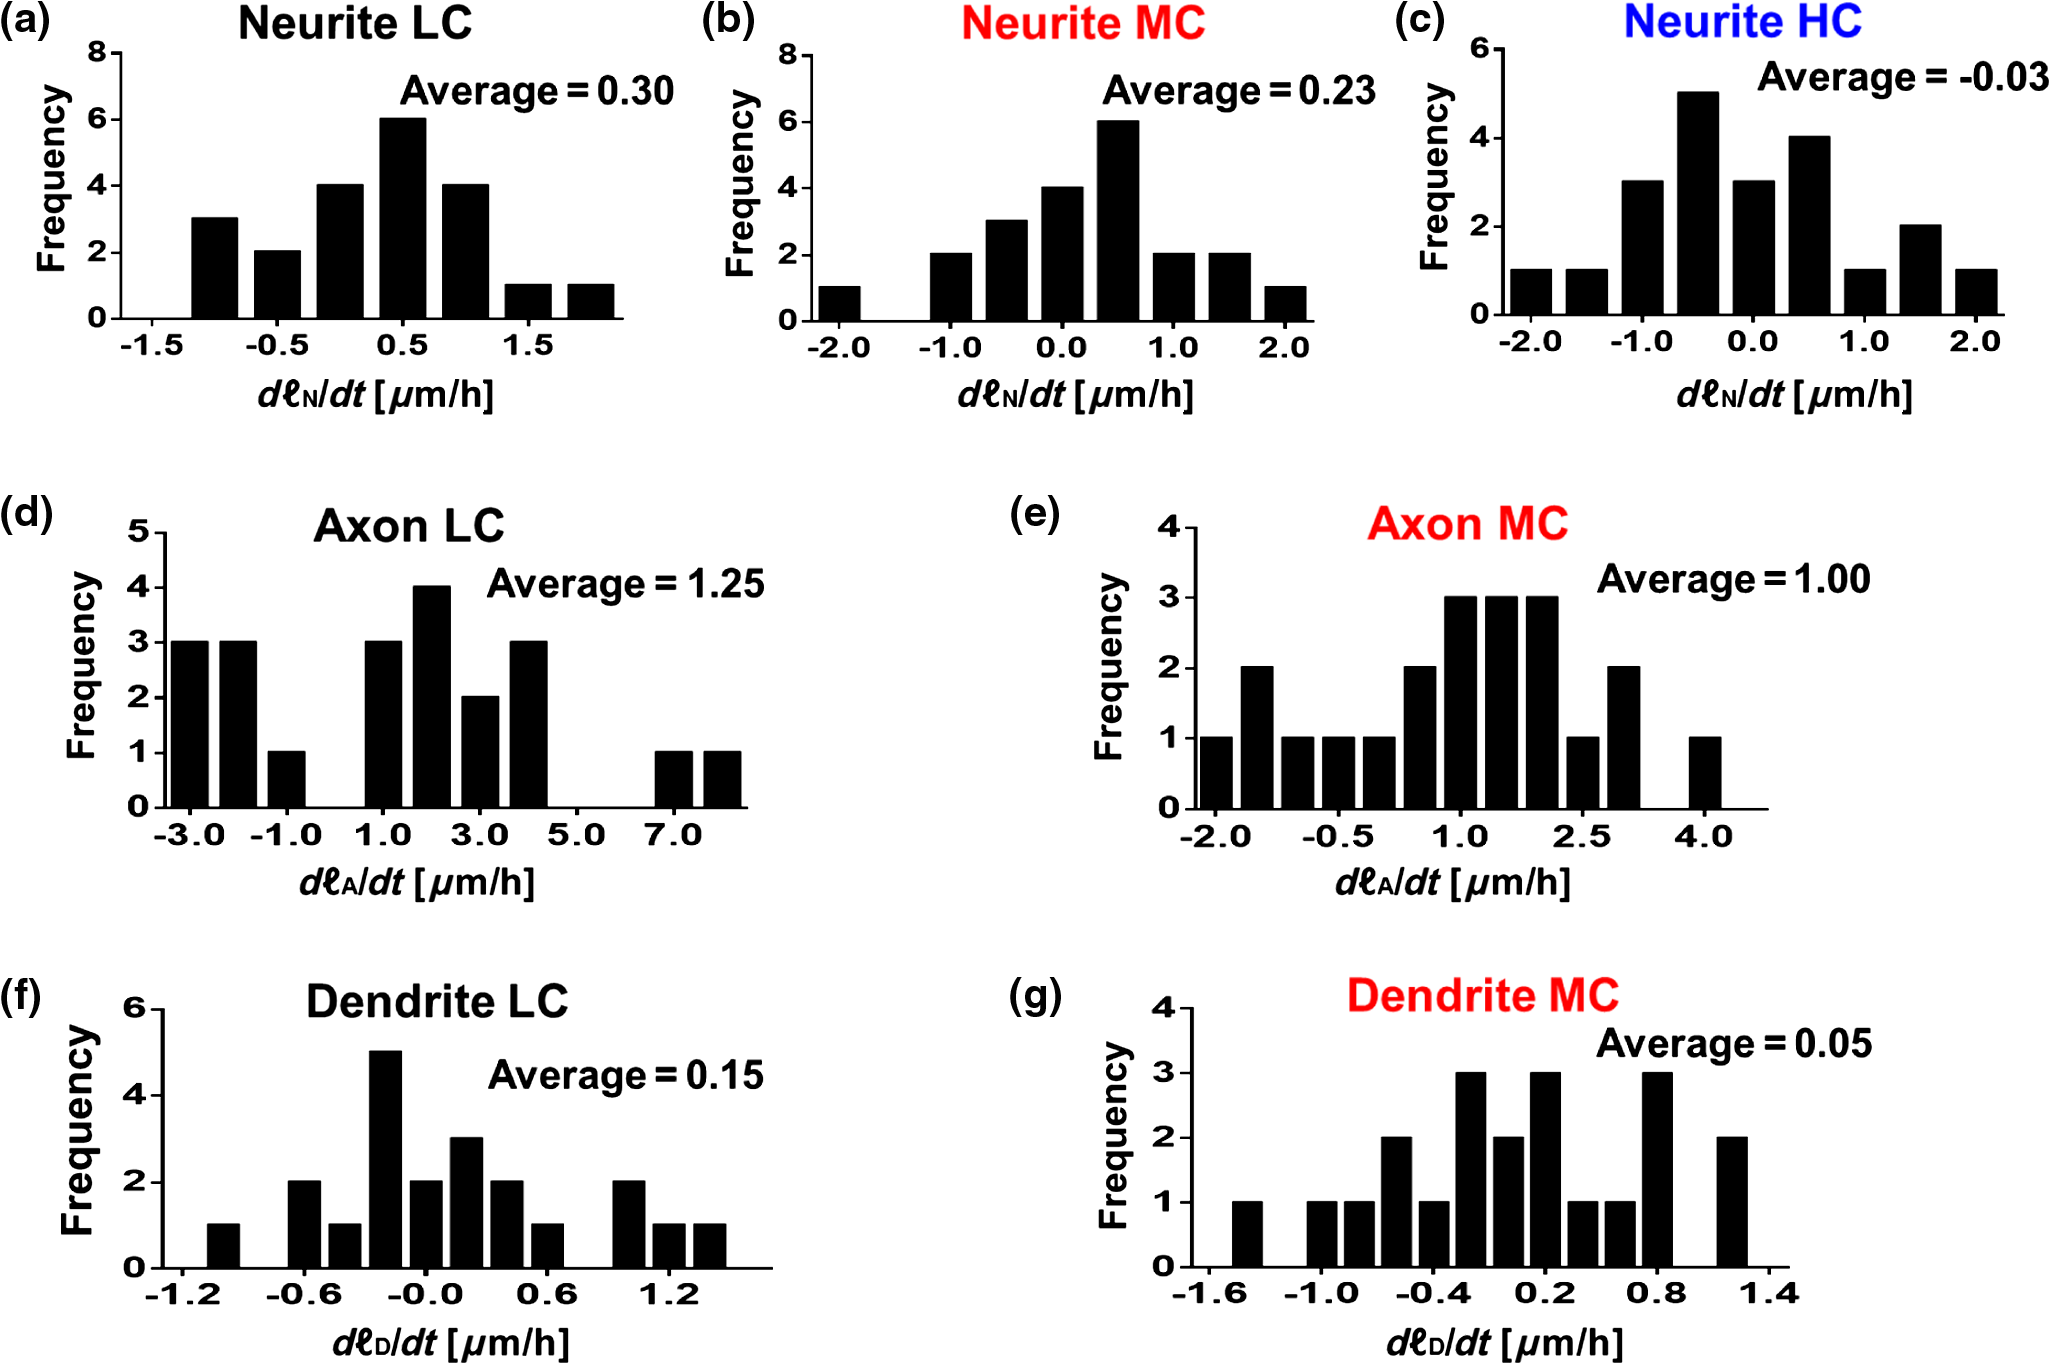 4.Summary and DiscussionNeurite outgrowth is an important morphological phenotype that correlates with neuron cell function and cell health.34 The field of axonal and dendritic process development is rapidly expanding, and we are just starting to elucidate the dynamic molecular underpinnings of synapse formation.35 Additionally, the molecular modes of neurite degeneration are being studied rigorously.36 Thus, we need imaging technologies and computational methods capable of analyzing the data in an unbiased and nondestructive way. However, the available approaches rely largely on destructive and tedious sample preparation methodologies including multiple sample washing, fixing, and permeabilization steps and subjective imaging techniques (e.g., calcein AM fluorescence and beta-III tubulin immunostaining).7,8,11,13,34 We used SLIM to measure neurite outgrowth as a function of cell confluence, over time, in living neurons. SLIM provides a nondestructive, unbiased, full field of view, and multiparametric assessment tool of the neuronal neurite outgrowth. Thus, SLIM is tailored to measure cell-specific features, such as neurite outgrowth, and provides a high-throughput functionality to measure neurite dynamics. Both high irradiation and fluorescence microscopy cause elevated levels of phototoxicity that permanently damage cells and neurons.9,10 The SLIM system, on the other hand, does not cause significant phototoxicity to cells. This is indicated by the fact that we can image neurons for periods of over a week without notable cell damage or cell death. We believe that this methodology will aid investigators in performing unbiased and sophisticated analysis of morphometric neuronal parameters. This is especially important because monitoring neurite outgrowth changes due to culture conditions and drug treatments is among the most widely performed phenotypic assays used today.37 Previous studies reveal promising research for live neuronal patterning upon designer substrates. Researchers are now unraveling the effects of various biomaterials on neuronal cell behavior. For example, the surface charges influence cell morphology and migration. In the future, we plan to utilize pyroelectrification techniques for micro-object patterning as well as and lithium niobate as a neuron substrate to quantify and measure biomaterial-induced changes in cell behavior.38–40 These platform technologies can be combined with SLIM for probing neuronal behaviors, such as neurite outgrowth and branching, at the subcellular level in topographically and chemically controlled environments. Using SLIM to quantitatively measure neurite outgrowth dynamics in a broader context has the potential to help elucidate the complex environmental and intrinsic signals that regulate and modulate neuritic outgrowth, pruning, and arborization-the substrate for neuronal function. DisclosuresG.P. and C.B.P. have financial interest in Phi Optics, Inc., a company that commercializes quantitative phase imaging systems. AcknowledgmentsWe would like to thank Martha Sweeny for all her help with Neuron J training and for all of her insightful comments and suggestions. This work was supported by the National Science Foundation, CBET-0939511 STC, DBI 14-50962 EAGER, IIP-1353368, and the National Institutes of Health, NIH GM108578. J.A. research supported by grants from NIH COBRE (5P20GM103471), Alzheimer’s Association, and Brain and Behavior Research Foundation. ReferencesR. Wingate and M. Kwint,
“Imagining the brain cell: the neuron in visual culture,”
Nat. Rev. Neurosci., 7
(9), 745
–752
(2006). http://dx.doi.org/10.1038/nrn1973 NRNAAN 1471-003X Google Scholar
N. M. Radio et al.,
“Assessment of chemical effects on neurite outgrowth in PC12 cells using high content screening,”
Toxicol. Sci., 105
(1), 106
–118
(2008). http://dx.doi.org/10.1093/toxsci/kfn114 Google Scholar
J. A. Harrill et al.,
“Quantitative assessment of neurite outgrowth in human embryonic stem cell-derived hN2TM cells using automated high-content image analysis,”
Neurotoxicology, 31
(3), 277
–290
(2010). http://dx.doi.org/10.1016/j.neuro.2010.02.003 NRTXDN 0161-813X Google Scholar
P. Jourdain et al.,
“Determination of transmembrane water fluxes in neurons elicited by glutamate ionotropic receptors and by the cotransporters KCC2 and NKCC1: a digital holographic microscopy study,”
J. Neurosci, 31
(33), 11846
–11854
(2011). http://dx.doi.org/10.1523/JNEUROSCI.0286-11.2011 Google Scholar
P. Jourdain et al.,
“Simultaneous optical recording in multiple cells by digital holographic microscopy of chloride current associated to activation of the ligand-gated chloride channel GABA(A) receptor,”
PLoS One, 7
(12), e51041
(2012). http://dx.doi.org/10.1371/journal.pone.0051041 POLNCL 1932-6203 Google Scholar
S.-A. Yang et al.,
“Measurements of morphological and biochemical alterations in individual neuron cells associated with early neurotoxic effects in Parkinson’s disease,”
bioRxiv,
(2016). https://doi.org/10.1101/080937 Google Scholar
E. Meijering,
“Neuron tracing in perspective,”
Cytometry A, 77
(7), 693
–704
(2010). http://dx.doi.org/10.1002/cyto.a.v77a:7 Google Scholar
S. T. Yeyeodu et al.,
“A rapid, inexpensive high throughput screen method for neurite outgrowth,”
Curr. Chem. Genomics, 4 74
–83
(2010). http://dx.doi.org/10.2174/1875397301004010074 Google Scholar
A. Calabuig et al.,
“Investigating fibroblast cells under “safe” and “injurious” blue-light exposure by holographic microscopy,”
J. Biophotonics,
(2016). http://dx.doi.org/10.1002/jbio.201500340 Google Scholar
V. Magidson and A. Khodjakov,
“Circumventing photodamage in live-cell microscopy,”
Methods Cell Biol., 114 545
–560
(2013). http://dx.doi.org/10.1016/B978-0-12-407761-4.00023-3 Google Scholar
J. A. Harrill, W. R. Mundy,
“Quantitative assessment of neurite outgrowth in PC12 cells,”
In Vitro Neurotoxicology: Methods and Protocols, 331
–348 Humana Press, Totowa, New Jersey
(2011). Google Scholar
Z. Wang et al.,
“Spatial light interference microscopy (SLIM),”
Opt. Express, 19
(2), 1016
–1026
(2011). http://dx.doi.org/10.1364/OE.19.001016 OPEXFF 1094-4087 Google Scholar
E. Meijering et al.,
“Design and validation of a tool for neurite tracing and analysis in fluorescence microscopy images,”
Cytometry A, 58
(2), 167
–176
(2004). http://dx.doi.org/10.1002/(ISSN)1097-0320 Google Scholar
M. E. Kandel et al.,
“Three-dimensional intracellular transport in neuron bodies and neurites investigated by label-free dispersion-relation phase spectroscopy,”
Cytometry A, 91
(5), 519
–526
(2017). http://dx.doi.org/10.1002/cyto.a.23081 Google Scholar
S. Sridharan et al.,
“Prediction of prostate cancer recurrence using quantitative phase imaging: validation on a general population,”
Sci. Rep., 6 33818
(2016). http://dx.doi.org/10.1038/srep33818 SRCEC3 2045-2322 Google Scholar
E. Min et al.,
“Label-free, multi-scale imaging of ex-vivo mouse brain using spatial light interference microscopy,”
Sci. Rep., 6 39667
(2016). http://dx.doi.org/10.1038/srep39667 SRCEC3 2045-2322 Google Scholar
L. Ma et al.,
“Phase correlation imaging of unlabeled cell dynamics,”
Sci. Rep., 6 32702
(2016). http://dx.doi.org/10.1038/srep32702 SRCEC3 2045-2322 Google Scholar
T. Kim et al.,
“Solving inverse scattering problems in biological samples by quantitative phase imaging,”
Laser Photonics Rev., 10
(1), 13
–39
(2016). http://dx.doi.org/10.1002/lpor.201400467 Google Scholar
R. Raman et al.,
“High-resolution projection microstereolithography for patterning of neovasculature,”
Adv. Healthc. Mater., 5
(5), 610
–619
(2016). http://dx.doi.org/10.1002/adhm.v5.5 Google Scholar
M. Mir et al.,
“Label-free characterization of emerging human neuronal networks,”
Sci. Rep., 4 4434
(2014). http://dx.doi.org/10.1038/srep04434 SRCEC3 2045-2322 Google Scholar
T. Kim et al.,
“White-light diffraction tomography of unlabelled live cells,”
Nat. Photonics, 8
(3), 256
–263
(2014). http://dx.doi.org/10.1038/nphoton.2013.350 NPAHBY 1749-4885 Google Scholar
S. W. Hwang et al.,
“Dissolution chemistry and biocompatibility of single-crystalline silicon nanomembranes and associated materials for transient electronics,”
ACS Nano, 8
(6), 5843
–5851
(2014). http://dx.doi.org/10.1021/nn500847g ANCAC3 1936-0851 Google Scholar
M. Mir et al.,
“Visualizing Escherichia coli sub-cellular structure using sparse deconvolution spatial light interference tomography,”
PLoS One, 7
(6), e39816
(2012). http://dx.doi.org/10.1371/journal.pone.0039816 POLNCL 1932-6203 Google Scholar
Z. Wang et al.,
“Spatial light interference tomography (SLIT),”
Opt. Express, 19
(21), 19907
(2011). http://dx.doi.org/10.1364/OE.19.019907 OPEXFF 1094-4087 Google Scholar
Z. Wang, H. Ding and G. Popescu,
“Scattering-phase theorem,”
Opt. Lett., 36
(7), 1215
–1217
(2011). http://dx.doi.org/10.1364/OL.36.001215 OPLEDP 0146-9592 Google Scholar
M. Mir et al.,
“Optical measurement of cycle-dependent cell growth,”
Proc. Natl. Acad. Sci. U. S. A., 108
(32), 13124
(2011). http://dx.doi.org/10.1073/pnas.1100506108 Google Scholar
III G. M. Beaudoin et al.,
“Culturing pyramidal neurons from the early postnatal mouse hippocampus and cortex,”
Nat. Protoc., 7
(9), 1741
–1754
(2012). http://dx.doi.org/10.1038/nprot.2012.099 1754-2189 Google Scholar
R. Wang et al.,
“Dispersion-relation phase spectroscopy of intracellular transport,”
Opt. Express, 19
(21), 20571
(2011). http://dx.doi.org/10.1364/OE.19.020571 OPEXFF 1094-4087 Google Scholar
Z. Wang et al.,
“Label-free intracellular transport measured by spatial light interference microscopy,”
J. Biomed. Opt., 16
(2), 026019
(2011). http://dx.doi.org/10.1117/1.3549204 JBOPFO 1083-3668 Google Scholar
G. Popescu, Quantitative Phase Imaging of Cells and Tissues, McGraw-Hill, New York
(2011). Google Scholar
M. E. Kandel et al.,
“Label-free imaging of single microtubule dynamics using spatial light interference microscopy,”
ACS Nano, 11
(1), 647
–655
(2017). http://dx.doi.org/10.1021/acsnano.6b06945 ANCAC3 1936-0851 Google Scholar
J. Popko et al.,
“Automated analysis of NeuronJ tracing data,”
Cytometry A, 75
(4), 371
–376
(2009). http://dx.doi.org/10.1002/cyto.a.v75a:4 Google Scholar
P. G. Fuerst and R. W. Burgess,
“Adhesion molecules in establishing retinal circuitry,”
Curr. Opin. Neurobiol., 19
(4), 389
–394
(2009). http://dx.doi.org/10.1016/j.conb.2009.07.013 COPUEN 0959-4388 Google Scholar
M. K. Hancock et al.,
“A facile method for simultaneously measuring neuronal cell viability and neurite outgrowth,”
Curr. Chem. Genom. Transl. Med., 9 6
–16
(2015). http://dx.doi.org/10.2174/2213988501509010006 Google Scholar
A. K. McAllister,
“Cellular and molecular mechanisms of dendrite growth,”
Cereb Cortex, 10
(10), 963
–973
(2000). http://dx.doi.org/10.1093/cercor/10.10.963 53OPAV 1047-3211 Google Scholar
L. J. Neukomm and M. R. Freeman,
“Diverse cellular and molecular modes of axon degeneration,”
Trends Cell Biol., 24
(9), 515
–523
(2014). http://dx.doi.org/10.1016/j.tcb.2014.04.003 Google Scholar
J. A. Harrill et al.,
“Use of high content image analyses to detect chemical-mediated effects on neurite sub-populations in primary rat cortical neurons,”
Neurotoxicology, 34 61
–73
(2013). http://dx.doi.org/10.1016/j.neuro.2012.10.013 NRTXDN 0161-813X Google Scholar
R. Rega et al.,
“Bipolar patterning of polymer membranes by pyroelectrification,”
Adv. Mater., 28
(3), 454
–459
(2016). http://dx.doi.org/10.1002/adma.v28.3 ADVMEW 0935-9648 Google Scholar
V. Marchesano et al.,
“Effects of lithium niobate polarization on cell adhesion and morphology,”
ACS Appl. Mater. Interfaces, 7
(32), 18113
(2015). http://dx.doi.org/10.1021/acsami.5b05340 AAMICK 1944-8244 Google Scholar
D. Kilinc et al.,
“Charge and topography patterned lithium niobate provides physical cues to fluidically isolated cortical axons,”
Appl. Phys. Lett., 110
(5), 053702
(2017). http://dx.doi.org/10.1063/1.4975304 APPLAB 0003-6951 Google Scholar
BiographyYoung Jae Lee is a PhD candidate in the neuroscience program at the University of Illinois at Urbana-Champaign (UIUC). He is working in the Cellular Neuroscience and Imaging (CNI) Lab; his research is focused on using quantitative phase imaging for studying neural changes, and potential therapeutic intervention assessment in mouse and cell models of traumatic brain injury. Pati Cintora is a PhD candidate in the neuroscience program at UIUC. She is working in CNI Lab; her research interests are in the areas of clinical and translational neuroscience. Currently, she is researching noninvasive treatments for traumatic brain injury at the cellular level. Jyothi Arikkath is an assistant professor of developmental neuroscience in the Munroe-Meyer Institute for Genetics and Rehabilitation at the University of Nebraska Medical Center. She studies the genetic and molecular regulation of neuronal formation and maintenance of synaptic connections. She investigates how changes at the level of synapses contribute to the ability to learn and retain memory, and how alterations in synaptic structure and function contribute to the pathology of autism and developmental disorders. Olaoluwa Akinsola studies mechanical engineering at University of Maryland, Baltimore County (UMBC) and is a Meyerhoff Scholar (M27). His current research interest lies in the field of prosthetics, with an emphasis on sensory and fine-motor functionality design. The goal of his work is to develop affordable state-of-the-art prosthetics for world-wide utilization. Mikhail Kandel is a PhD candidate in the electrical and computer engineering at UIUC. He is working in the Quantitative Light Imaging (QLI) Lab at the Beckman Institute of Advanced Science and Technology; he develops computational tools and instrumentation for phase-shifting interferometers. His research interests include studying image formation to improve tomography, time-lapse microscopy to monitor cell populations, and developing new markers to remove observer bias in pathology. Gabriel Popescu is an associate professor in electrical and computer engineering at UIUC. His research is focused on biomedical optics and interferometric label-free imaging. He has published a book on QPI, authored 130 journal publications and 1850 conference presentations, obtained 32 patents, and given 150 invited/keynote/plenary talks. He founded Phi Optics, Inc., a startup company that commercializes quantitative phase imaging technology. He is a fellow of OSA and SPIE. Catherine Best-Popescu is a research assistant professor in bioengineering at UIUC. Her research interests are at the intersection of neuroscience and biomedical sciences. She directs an interdisciplinary lab, CNI Lab, that focuses on investigating traumatic brain injury with special interests in brain quantitative imaging methods and the therapeutic application of narrow wave ultraviolet light (nbUVB, 298-307nm). |


