|
|
|
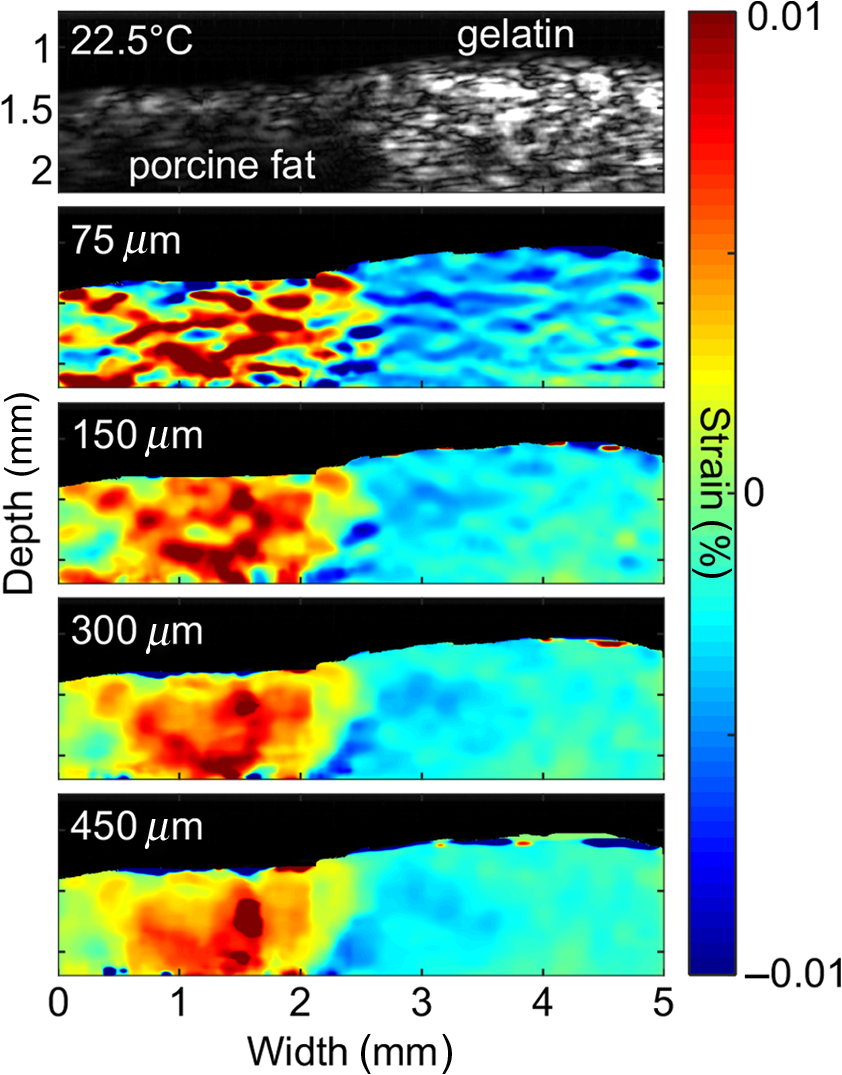
Cardiovascular disease (CVD), the largest cause of death in the world, accounts for nearly a third of human deaths.1 Within the realm of CVD, vulnerable plaques are one of the most important causes of thrombosis in the narrow aorta and are a major cause of sudden deaths such as from myocardial infarction.2,3 Three main characteristics are distinguished between vulnerable plaques and normal ones: lipid-rich necrotic cores, thin fibrous caps of thick, and inflammation.4–6 Vulnerable plaques can easily rupture due to this structure. Lipids of the plaques released by rupture flow through the bloodstream and can cause sudden thrombus formation in the blood vessels. The lipid composition of plaques is related to the degree of inflammation and the fibrous cap thickness.6 It also affects the formation of cholesterol crystals, which can damage the fibrous cap.7 Detection and monitoring of lipids in plaques are, therefore, important to investigate the vulnerability of plaques and related diseases. Unfortunately, conventional medical imaging techniques, such as intravascular ultrasound (IVUS), intravascular optical coherent tomography (IV-OCT), near-infrared spectroscopy (NIRS), near-infrared fluorescence (NIRF), near-infrared autofluorescence imaging (NIRAF), and intravascular photoacoustic (IVPA) imaging, have limitations in detecting lipids in plaques. IVUS provides the entire structure of the blood vessels but lacks the resolution to measure the fibrous cap thickness and lacks the chemical specificity needed for lipid detection.8 IV-OCT can provide a high-resolution image that can measure the thickness of the fiber cap but is limited by its chemical specificity for lipid detection and by its shallow penetration depth where the entire arterial structure is not visible.9 NIRS provides high specificity for the presence of lipid in the radial direction but cannot delineate lipid in the axial direction because the imaging depth cannot be quantified.10 Thus, three-dimensional (3-D) mapping of lipids is not possible in NIRS. NIRF provides a high degree of specificity for lipid detection but is limited by its lack of depth sensitivity and the use of external chemicals that can stress the patient.11 NIRAF, based on autofluorescence, can be used for lipid detection without the use of chemical agents but lacks depth sensitivity.12 IVPA can image lipid presence in 3-D using pulsed laser sources. However, commercial laser sources of specific optical wavelengths that are sensitive to lipids (i.e., near 1200 or 1700 nm) are not widely available,13–17 and they are expensive, bulky, and unstable, despite the ongoing efforts of many groups to develop laser sources for this purpose.15,16 Thermal strain imaging (TSI) is an imaging technique based on ultrasound (US) wave propagation speed, which varies with the medium temperature.18 The change in temperature causes a change in US speed in the medium. The changes in US speed result in shifts of scattered echoes within the US image. Note that the scatterer itself does not move. Because these echo shifts are related to the tissue type, TSI can be used to differentiate between tissue types.19 To detect lipids in vulnerable plaques, TSI exploits the fact that when the temperature rises, adipose tissue and water-bearing tissue exhibit opposite US speed changes.20 Previous studies have described the application of TSI for detecting lipids in plaque using US heating21 or microwave heating.22 However, conventional TSI methods are not suitable for intravascular imaging because the heat sources are located outside the body, which causes inefficient and nonuniform heat transfer. In addition, conventional heating methods are nonselective, which can result in unwanted temperature increases in irrelevant tissues.21,22 In this article, for the first time to our knowledge, we demonstrate photothermal strain imaging (pTSI) based on an IVUS catheter. We used a small () and readily movable commercial 1210-nm continuous-wave (CW) laser as a heating source for TSI. Because the 1210-nm CW laser beam is preferentially absorbed by lipids,23 adipose tissue is selectively heated and experiences stronger strain than other tissues. To demonstrate this phenomenon, we used pTSI to image a phantom made of porcine fat and gelatin. While the phantom temperature was rising, we obtained US B-mode images from the phantom using IVUS. A speckle-tracking algorithm was applied to the images for strain calculation. The porcine fat was clearly differentiated from the gelatin by the strain difference, which suggests the potential of pTSI for lipid detection in vulnerable plaques. Figure 1 is a schematic of the pTSI system. The system consisted of a commercial 1210-nm CW laser (ALC-1210-04000-CB100-LDTC, AKELA), a single element IVUS catheter (Opticross™, Boston Scientific), a pulser-receiver (5072PR, Olympus, Japan), a data acquisition system (DAQ) with 14-bit digitization, a 200-MS/s sampling rate (Razor 1422, Gage), a motor controller (TDC001, Thorlabs) with a single axis pull-back device (PT1-Z8, Thorlabs), and a thermocouple DAQ (OM-DAQ-USB-2401, Omega, USA) with two thermocouples (HYP0-33-1-T-G-60-SMP-M, Omega). The 1210-nm CW laser was the heating source for pTSI. In all experiments, we strictly adhered to laser safety limits, taking care not to exceed the maximum permissible exposure (MPE) for human skin (, ANSI Z136.1). The laser beam transmitted through a multimode fiber to a collimator and illuminated vertically the area of 9-mm diameter. The IVUS transducer has a center frequency of 41.7 MHz, a bandwidth of 36.2%, and the diameter is 0.59 mm. The resolutions measured using a carbon fiber are in the axial direction and at the 2-mm depth in the lateral direction. The IVUS catheter was attached to the pull-back device so that it could be withdrawn in a controlled manner. The IVUS catheter tip was placed in a water tank, and the transducer of the catheter tip was positioned facing the imaging target. The pulser-receiver triggered the IVUS transducer to generate US pulses and received the returned US radio-frequency (RF) signal. The collected US RF signal was amplified by the pulser-receiver, sent to the DAQ, and finally stored in the PC. The motor controller was connected to the PC to control the pull-back device’s operation during pTSI. Fig. 1Schematic of the photothermal imaging (pTSI) experiment. IVUS, intravascular ultrasound and DAQ, data acquisition system.  In the pTSI experiments, we used two types of components to create a phantom: porcine subcutaneous abdominal fat to mimic adipose tissue and gelatin as water-bearing tissue. The gelatin was made from 10% gelatin solution containing 20% cornstarch powder for US scattering.24,25 The porcine fat was inserted into the gelatin solution during solidification. The solidified phantom was cut to an appropriate size so that the boundary between the porcine fat and the gelatin was visually distinguished. The thermocouples were inserted at a depth of about 1 mm from each surface to measure the temperature of the porcine fat and gelatin. The thermocouple DAQ collected temperature data via the thermocouples and monitored the temperature change during the experiment. The pTSI experiment was performed using US B-mode image acquisition with laser heating and temperature monitoring, followed by computation of strain through the algorithms [Fig. 2(a)]. First, we used the thermocouples to monitor the phantom temperature changes during the experiment. The laser was initially set to maintain power below MPE for human tissue and began to illuminate the phantom until the last imaging procedure was completed. We obtained a US B-mode image whenever the constant amount of laser energy was delivered to the phantom. Note that images were acquired manually because the laser did not have a trigger function. While the phantom temperature rose, the IVUS transducer collected US A-line signals at intervals from the phantom. To obtain a 5-mm single US B-mode image, the IVUS transducer acquired total 2,500 US A-line signals at a repetition rate of 500 Hz. After one US B-mode image was acquired, the IVUS catheter was returned to its original position and waited for the next execution. Figure 2(b) shows a timing diagram of the experiment procedure. Image acquisition continued until the phantom temperature was no longer rising from laser heating. Finally, we obtained a set of the US B-mode images with average temperature information and postprocessed these images using MATLAB® (MathWorks) for strain calculations. Fig. 2(a) Block diagram showing the pTSI experiment and the strain calculation procedure. (b) Timing diagram of laser operation, DAQ, motor control, and manual trigger for the image acquisition, in seconds. US, ultrasound; RF, radio-frequency; pTSI, photothermal strain imaging; and DAQ, data acquisition system.  A speckle-tracking algorithm based on a complex cross correlation and a zero-phase crossing algorithm was applied between US B-mode images to estimate strain.26 Strain varies between adipose and normal tissues. First, Hilbert transformation was applied to the US A-line RF signals. A normalized complex cross correlation was then applied to the transformed signals. To reduce peak-hopping errors that reduce the accuracy of strain image due to erroneous peak detection in the correlation function, the correlation results were filtered into a Hanning window. Finally, the filtered results were modulated by the zero-phase crossing algorithm and used for strain calculation. The distinction of tissue through strain was based on the temperature dependence of the US propagation speed. Thermal strain at a depth in tissue can be defined as where is the round-trip time delay of the US signal from the scatterers at , is the linear coefficient of thermal expansion, is the linear coefficient, which governs the change of US speed by temperature, and is the temperature change of the tissue.18 Adipose tissue and water-bearing tissue have the linear coefficient of opposite sign; water-bearing tissue has a positive sign of , which causes negative strain during the temperature increase, whereas adipose tissue has a negative sign of , which causes positive strain during the temperature increase.27 Therefore, the strain that occurs when the temperature rises from adipose tissue and water-bearing tissue could be used to distinguish between the two. In the case of pTSI, the adipose tissue could be selectively heated by the 1210-nm laser, minimizing unnecessary temperature change in other tissue.To observe the trend of US speed change in adipose tissue and gelatin with temperature change, US speed change as a result of laser heating was measured beforehand in each tissue. Figures 3(a) and 3(b) show the US speed change of the porcine fat and gelatin heated by the 1210-nm laser with the average power of 280 mW and laser intensity of , respectively. As the temperature increased, the US speed decreased in the porcine fat and increased in the gelatin. Next, pTSI was performed while measuring the temperature change caused by irradiating the phantom with the laser. Temperature data of the porcine fat and the gelatin were collected by each thermocouple during pTSI [Fig. 3(c)]. At room temperature (21.5°C), the phantom began to heat up by the 1210-nm laser with the average power of 93 mW and laser intensity of . The phantom was heated until the temperature stabilized at 22.9°C. US B-mode images were obtained, and the strain was calculated and superimposed on the US B-mode images to obtain photothermal strain (pTS) images (Fig. 4). Note that the strain on the nonphantom area was masked and removed during pTS image overlay. In the US B-mode images, the porcine fat (left side) and the gelatin (right side) were distinguished by their different amplitudes in the US echo signal. During laser heating, displacements of the speckle pattern were not prominent in the US B-mode image. On the other hand, strain changes in pTS images became evident as the temperature increased. In the strain calculation, the correlation kernel size was , which was determined by considering the speckle size and US pulse autocorrelation.26,28 The positive strain in the porcine fat increased sharply during the temperature increase by laser heating. When the temperature reached 22.5°C, the porcine fat in the image was covered with the positive strain. To the contrary, the negative strain was observed in the gelatin. However, the negative strain from the gelatin was not as strong as the positive stain from the porcine fat. Above 22.5°C, some artifacts began to appear in the middle of positive strain. We believe that the artifacts are peak-hopping errors due to deformation caused by temperature rise in the phantom. In general, the artifacts can be reduced by increasing kernel size, but it will sacrifice resolution. Alternatively, programmatic methods such as the Viterbi algorithm can be applied to reduce peak-hopping errors.29 Note that the pTS image was filtered with a median filter to eliminate remaining peak-hopping errors and with a Gaussian filter for image smoothing. Fig. 3Change in US speed versus average temperature in (a) porcine fat and (b) gelatin. (c) Time–temperature graph of the phantom in pTSI. In (c), the laser began to operate from time dotted line was located. The laser output was in (a) and (b), and in (c). US, ultrasound and pTSI, photothermal strain imaging.  Fig. 4(a) US B-mode images and (b) the pTS images overlaid on the US image during temperature change. The porcine fat (red) and the gelatin (blue) were clearly distinguished in the pTS image. The temperature in the US B-mode images represents the porcine fat’s temperature. US, ultrasound and pTS, photothermal strain.  There is a trade-off between the variance and resolution of the pTS image, depending on the kernel sizes.26 Small kernel sizes can improve resolution, but large variance in time delay will cause peak-hopping errors. These errors can be partially reduced through correlation filtering, but they cannot be completely resolved by the filter. Conversely, large kernel sizes reduce the variance of the time delay, increasing the accuracy of the strain but reduce the resolution. Therefore, finding the optimal kernel size is very important in pTSI. To demonstrate the effect of kernel size, pTS images with different kernel sizes were processed at 22.5°C for same US B-mode image (Fig. 5). If the kernel size was , the pTS image had a more detailed strain distribution than with a larger kernel size. However, peak-hopping errors that cannot be completely removed by the correlation filter appeared in the form of a sudden strain inversion in the pTS image. Peak-hopping errors disappeared with increasing kernel size, but the strain distribution was progressively simplified due to reduced resolution. We have demonstrated the validity of pTSI through experiments with a phantom made of porcine fat and gelatin. The porcine fat was clearly distinguishable from gelatin because it strongly absorbed the 1210-nm laser illumination and exhibited a correspondingly significant amount of positive thermal strain. Negative strain also occurred in the gelatin, but it was not as strong as the positive strain in the porcine fat. This phenomenon has two possible causes. First, the laser may have heated the porcine fat and gelatin to different degrees. Second, the change in the US speed of porcine fat over temperature was greater than that of gelatin. We also acquired pTS images with different correlation kernel sizes, showing the trade-off between image precision and resolution. If the kernel size was not significantly different from the optimal value, we found that the strain distributions between US B-mode images with different kernel sizes were similar. In future studies, imaging with real lipid-rich plaques will be needed to more reliably verify pTSI. Despite the successful differentiation of adipose tissue, challenges remain in applying pTSI in clinical situations. Most obviously, motion artifacts due to the system vibration and physiologic motions will make an effect on the signals. The motion artifacts that occur within a couple of seconds can distort the US signals and make it difficult to obtain correct pTS images. Therefore, the motion artifacts due to motor vibration or cardiac pulsation are expected to be the major obstacles to pTSI. To solve this problem, the IVUS with an array transducer could be a solution that minimizes the effect of motion artifacts in that it has a fast signal acquisition mechanism to get several B-mode images within a single cardiac cycle. It also has the advantage of less vibration due to no rotation required. Furthermore, the electrocardiogram gating could be used to synchronize the images and reduce the signal distortions by cardiac pulsation.30 Long heating time is another issue that makes pTSI difficult to apply in clinical applications. Currently, the used 1210-nm laser power is of the safety limit, and it takes about 30 s for a temperature rise of 1°C. If we could use the laser power close to the safety limit, it takes about 3 s for a temperature rise of 1°C. Then, we are able to obtain the significant change in strain with this temperature rise. In addition, water flushing commonly used in IV-OCT could be applied to pTSI, which may be possible to minimize the effect of blood flow. Guiding the laser through the catheter and illuminating the target could also be problematic. However, we believe that this problem could be solved by laser delivery methods developed in previous IVPA systems, which can illuminate the target in various ways, such as one direction13–17 or radial.31 In this pTSI study, we set a criterion not to cause a temperature rise of more than 2°C within the phantom, based on the previous study of biological side effects of tissue.32 However, since there is no clear study of the phenomenon by plaque heating, it is necessary to study the relationship between plaque and temperature to prevent plaque rupture during pTSI. pTSI has several advantages over other conventional intravascular devices or TSI methods. pTSI can provide specificity for lipids not provided by IVUS or IV-OCT and has the depth resolution to quantify the location and size of lipids that are difficult to obtain by NIRS, NIRF, or NIRAF. In addition, pTSI does not require water flushing or external chemicals, so it can reduce the burden on patients. From a system point of view, pTSI has the advantage of using relatively inexpensive and widely available commercial lasers compared to IVPA. Compared to conventional TSI methods, pTSI can perform lipid-selective heating and minimize unwanted tissue temperature rise. It can also heat plaque in the body via a catheter using optical fibers, which can lead to efficient heat transfer. However, the following issues need to be addressed before clinical translation. Unlike IVUS or IV-OCT, pTSI is difficult to use alone because it does not provide an image of the actual vascular structure. Therefore, the best solution should be a combined pTSI/IVUS catheter. Based on the results, our future works will be developing IVUS with integrated optical components to perform high-speed pTS/IVUS imaging in coronary arteries. With further improvements, pTSI is expected to help detect lipids in coronary artery. In conclusion, we demonstrated the feasibility of pTSI using a 1210-nm CW laser and IVUS catheter for differentiating adipose tissue. The US speed change tendency was confirmed by heating the adipose tissue and gelatin using the 1210-nm laser. Then, we obtained US B-mode images using a phantom made of the porcine fat and gelatin. A speckle-tracking algorithm based on complex cross correlation and the zero-phase crossing algorithm was applied to the US B-mode images to obtain the pTS images. During a 1.4°C increase by the laser heating, the pTS images showed a significant amount of positive strain in the porcine fat, enough to distinguish it from the negative strain produced in the gelatin. We also showed the trade-off between the variance of estimated time delay and resolution for kernel size by obtaining different pTS images of different kernel sizes. These results demonstrated that pTSI could distinguish adipose tissue, suggesting that it could be a way of sensing lipid in coronary artery to detect vulnerable plaques. Through this developed technique, we expect to further advance the intravascular imaging technology. DisclosuresThere is no relevant financial interest or conflicts of interest to be disclosed by the authors. AcknowledgmentsThis research was supported by the Ministry of Science, ICT and Future Planning, Korea, under the ICT Consilience Creative Program (IITP-R0346-16-1007), supervised by the Institute for Information and Communications Technology Promotion. It was further supported by the Korea Health Technology R&D Project (HI15C1817) of the Ministry of Health and Welfare. ReferencesB. Cannon,
“Cardiovascular disease: biochemistry to behaviour,”
Nature, 493
(7434), S2
–S3
(2013). http://dx.doi.org/10.1038/493S2a Google Scholar
J. E. Muller, G. H. Tofler and P. H. Stone,
“Circadian variation and triggers of onset of acute cardiovascular disease,”
Circulation, 79
(4), 733
–743
(1989). http://dx.doi.org/10.1161/01.CIR.79.4.733 CIRCAZ 0009-7322 Google Scholar
E. Falk, P. K. Shah and V. Fuster,
“Coronary plaque disruption,”
Circulation, 92
(3), 657
–671
(1995). http://dx.doi.org/10.1161/01.CIR.92.3.657 CIRCAZ 0009-7322 Google Scholar
H. C. Stary et al.,
“A definition of advanced types of atherosclerotic lesions and a histological classification of atherosclerosis. A report from the Committee on Vascular Lesions of the Council on Arteriosclerosis, American Heart Association,”
Arterioscler. Thromb. Vasc. Biol., 15
(9), 1512
–1531
(1995). http://dx.doi.org/10.1161/01.ATV.15.9.1512 Google Scholar
A. P. Burke et al.,
“Coronary risk factors and plaque morphology in men with coronary disease who died suddenly,”
N. Engl. J. Med., 336
(18), 1276
–1282
(1997). http://dx.doi.org/10.1056/NEJM199705013361802 Google Scholar
C. V. Felton et al.,
“Relation of plaque lipid composition and morphology to the stability of human aortic plaques,”
Arterioscler. Thromb. Vasc. Biol., 17
(7), 1337
–1345
(1997). http://dx.doi.org/10.1161/01.ATV.17.7.1337 Google Scholar
A. Janoudi et al.,
“Cholesterol crystal induced arterial inflammation and destabilization of atherosclerotic plaque,”
Eur. Heart J., 37
(25), 1959
–1967
(2016). http://dx.doi.org/10.1093/eurheartj/ehv653 Google Scholar
C. L. de Korte et al.,
“Identification of atherosclerotic plaque components with intravascular ultrasound elastography in vivo: a Yucatan pig study,”
Circulation, 105
(14), 1627
–1630
(2002). http://dx.doi.org/10.1161/01.CIR.0000014988.66572.2E CIRCAZ 0009-7322 Google Scholar
I. K. Jang et al.,
“Visualization of coronary atherosclerotic plaques in patients using optical coherence tomography: comparison with intravascular ultrasound,”
J. Am. Coll. Cardiol., 39
(4), 604
–609
(2002). http://dx.doi.org/10.1016/S0735-1097(01)01799-5 Google Scholar
C. M. Gardner et al.,
“Detection of lipid core coronary plaques in autopsy specimens with a novel catheter-based near-infrared spectroscopy system,”
JACC: Cardiovasc. Imaging, 1
(5), 638
–648
(2008). http://dx.doi.org/10.1016/j.jcmg.2008.06.001 Google Scholar
S. Lee et al.,
“Fully integrated high-speed intravascular optical coherence tomography/near-infrared fluorescence structural/molecular imaging in vivo using a clinically available near-infrared fluorescence-emitting indocyanine green to detect inflamed lipid-rich atheromata in coronary-sized vessels,”
Circ.: Cardiovasc. Interventions, 7
(4), 560
–569
(2014). http://dx.doi.org/10.1161/CIRCINTERVENTIONS.114.001498 Google Scholar
H. Wang et al.,
“Ex vivo catheter-based imaging of coronary atherosclerosis using multimodality OCT and NIRAF excited at 633 nm,”
Biomed. Opt. Express, 6
(4), 1363
–1375
(2015). http://dx.doi.org/10.1364/BOE.6.001363 BOEICL 2156-7085 Google Scholar
X. Bai et al.,
“Intravascular optical-resolution photoacoustic tomography with a 1.1 mm diameter catheter,”
PLoS One, 9
(3), e92463
(2014). http://dx.doi.org/10.1371/journal.pone.0092463 POLNCL 1932-6203 Google Scholar
J. Hui et al.,
“High-speed intravascular photoacoustic imaging at 1.7 mum with a KTP-based OPO,”
Biomed. Opt. Express, 6
(11), 4557
–4566
(2015). http://dx.doi.org/10.1364/BOE.6.004557 Google Scholar
P. Wang et al.,
“High-speed intravascular photoacoustic imaging of lipid-laden atherosclerotic plaque enabled by a 2-kHz barium nitrite Raman laser,”
Sci. Rep., 4 6889
(2014). http://dx.doi.org/10.1038/srep06889 Google Scholar
Z. L. Piao et al.,
“High speed intravascular photoacoustic imaging with fast optical parametric oscillator laser at 1.7 mu m,”
Appl. Phys. Lett., 107
(8), 083701
(2015). http://dx.doi.org/10.1063/1.4929584 Google Scholar
C. Choi et al.,
“Fast integrated intravascular photoacoustic/ultrasound catheter,”
Proc. SPIE, 9708 970854
(2016). http://dx.doi.org/10.1117/12.2210790 PSISDG 0277-786X Google Scholar
C. H. Seo et al.,
“Thermal strain imaging: a review,”
Interface Focus, 1
(4), 649
–664
(2011). http://dx.doi.org/10.1098/rsfs.2011.0010 Google Scholar
R. Seip and E. S. Ebbini,
“Noninvasive estimation of tissue temperature response to heating fields using diagnostic ultrasound,”
IEEE Trans. Biomed. Eng., 42
(8), 828
–839
(1995). http://dx.doi.org/10.1109/10.398644 Google Scholar
J. C. Bamber and C. R. Hill,
“Ultrasonic attenuation and propagation speed in mammalian tissues as a function of temperature,”
Ultrasound Med. Biol., 5
(2), 149
–157
(1979). http://dx.doi.org/10.1016/0301-5629(79)90083-8 Google Scholar
K. Kim et al.,
“Arterial vulnerable plaque characterization using ultrasound-induced thermal strain imaging (TSI),”
IEEE Trans. Biomed. Eng., 55
(1), 171
–180
(2008). http://dx.doi.org/10.1109/TBME.2007.900565 Google Scholar
Y. Shi, R. S. Witte and M. O’Donnell,
“Identification of vulnerable atherosclerotic plaque using IVUS-based thermal strain imaging,”
IEEE Trans. Ultrason. Ferroelectr. Freq. Control, 52
(5), 844
–850
(2005). http://dx.doi.org/10.1109/TUFFC.2005.1503971 Google Scholar
R. R. Anderson et al.,
“Selective photothermolysis of lipid-rich tissues: a free electron laser study,”
Lasers Surg. Med., 38
(10), 913
–919
(2006). http://dx.doi.org/10.1002/(ISSN)1096-9101 Google Scholar
C. Kim et al.,
“Optical phantoms for ultrasound-modulated optical tomography,”
Proc. SPIE, 6870 68700M
(2008). http://dx.doi.org/10.1117/12.766773 PSISDG 0277-786X Google Scholar
R. N. Gibson and K. I. Gibson,
“A home-made phantom for learning ultrasound-guided invasive techniques,”
Australas. Radiol., 39
(4), 356
–357
(1995). http://dx.doi.org/10.1111/j.1440-1673.1995.tb00311.x Google Scholar
M. A. Lubinski, S. Y. Emelianov and M. O’Donnell,
“Speckle tracking methods for ultrasonic elasticity imaging using short-time correlation,”
IEEE Trans. Ultrason. Ferroelectr. Freq. Control, 46
(1), 82
–96
(1999). http://dx.doi.org/10.1109/58.741427 Google Scholar
F. A. Duck, Physical Properties of Tissue: A Comprehensive Reference Book, Academic Press, London
(1990). Google Scholar
R. S. C. Cobbold, Foundations of Biomedical Ultrasound, Oxford University Press, New York
(2007). Google Scholar
Y. Petrank, L. Y. Huang and M. O’Donnell,
“Reduced peak-hopping artifacts in ultrasonic strain estimation using the Viterbi algorithm,”
IEEE Trans. Ultrason. Ferroelectr. Freq. Control, 22
(7), 1359
–1367
(2009). http://dx.doi.org/10.1109/TUFFC.2009.1192 Google Scholar
M. ODonnell et al.,
“Synthetic phased arrays for intraluminal imaging of coronary arteries,”
IEEE Trans. Ultrason. Ferroelectr. Freq. Control, 44
(3), 714
–721
(1997). http://dx.doi.org/10.1109/58.658335 Google Scholar
B. Y. Hsieh et al.,
“Integrated intravascular ultrasound and photoacoustic imaging scan head,”
Opt. Lett., 35
(17), 2892
–2894
(2010). http://dx.doi.org/10.1364/OL.35.002892 Google Scholar
Jr. W. D. O'Brien et al.,
“The risk of exposure to diagnostic ultrasound in postnatal subjects: thermal effects,”
J. Ultrasound Med., 27
(4), 517
–535
(2008). http://dx.doi.org/10.7863/jum.2008.27.4.517 Google Scholar
BiographyChanghoon Choi received his BS degree in electrical engineering from Pohang University of Science and Technology (POSTECH) in 2012, and now he is a PhD candidate in the Department of Creative IT Engineering, POSTECH. His research fields are photoacoustic imaging and development of intravascular catheters for detecting vulnerable plaque, such as the intravascular photoacoustic catheter. Joongho Ahn completed his BS degree in electronic engineering at Kyungbook National University. Currently, he is a graduate student in the Department of Creative IT Engineering at POSTECH. His research interest is electronic components in ultrasound imaging systems. Seungwan Jeon completed his BS degree in biomedical engineering at Yonsei University and currently, he is a graduate student in the Department of Creative IT Engineering. His research interests are optical-resolution photoacoustic microscopes and ultrasound beam formation. Chulhong Kim is currently an associate professor of Creative IT Engineering at Pohang University of Science and Technology, Republic of Korea. Before he joined the department, he was an assistant professor of biomedical engineering at the University at Buffalo, the State University of New York, from 2010 to 2013. He studied for his PhD and postdoctoral training at Washington University in St. Louis, Missouri, USA. |