|
|
1.IntroductionPhotoacoustic imaging (PAI) is a promising structural, functional, and molecular imaging technique for a wide range of biomedical applications. PAI combines the technological advances of both optical and acoustic imaging, i.e., the high intrinsic contrast of optical imaging and the spatial resolution of ultrasound imaging.1 Every material, including bodily substances, has a specific optical absorption coefficient unique to endogenous chromophores in cells or tissue. The substance to be imaged is illuminated by a nanosecond pulsed laser of a specific wavelength, at which the absorption coefficient of the sample is the highest. Physical characteristics of phantoms and biological tissues and the time scale of energy dissipation within the sample determine the required time scale and the thermal and stress relaxation times over which the light must be delivered. PAI is a scalable imaging technique, from photoacoustic microscopy (PAM) to photoacoustic computed tomography (PACT). With PAM, a focused light is utilized2 to image the vasculature and function of biological tissue3,4 in more detail;5 in PACT, a full-field illumination of diffused light is used and deep tissue imaging is possible. Reflection and transmission modes are two detection schemes used in PAM.2,6 In reflection mode, the excitation and detection occur on the same side of the sample, while in transmission mode they are on opposite sides. Transmission mode offers a better signal-to-noise ratio (SNR), although the technique is limited to imaging thin tissues,7–9 as opposed to reflection mode that can be used for imaging thicker tissues.9–13 PAI usually uses solid-state and dye lasers because of their short pulse width and large pulse energy. These lasers are usually bulky and expensive and require high maintenance. On the other hand, diode lasers are compact and inexpensive and can perform with a high repetition rate. Diode lasers are semiconductor P-N junction diodes that employ current as the pump source. In this study, we use pulsed laser diodes (PLD). PLDs have lower energy per pulse compared to solid-state lasers, e.g., or nJ versus mJ or J.3,14–16 PLDs are available in a wide spectrum of wavelengths, which makes them suitable for photoacoustic (PA) spectroscopy.17 They are used in a variety of clinical applications, such as oximetry,18 transillumination imaging,19 and ophthalmology.20,21 PLDs do not require an additional cooling system, which makes them low-maintenance light sources. Because PLDs have low energy, the obtained PA signal from these sources needs to be averaged multiple times to reach to an acceptable SNR. Averaging is a time-consuming procedure, which affects the temporal resolution of the imaging system and prevents them from being used in the applications where a faster imaging system is desired, e.g., hemodynamic monitoring and circulating tumor cell imaging. Here, we demonstrate the results of low-cost (LC) PAI systems in which a very low-energy PLD with the central wavelength of 905 nm and output peak power of 6 W is used. We explain and present the experimental results of three different PAI configurations: transmission mode PAM, reflection mode PAM, and PACT. The images obtained from tissue-mimicking phantoms and biological samples determined the feasibility of using a very low-energy laser diode in these configurations. 2.Material and MethodA PLD with the central wavelength of 905 nm (905D1S03X, Laser Component Co., Bedford, New Hampshire), a peak power of 6 W, and pulse width of 55 ns operating at maximum repetition rate of 20 KHz is used in the configuration of our PAI systems. The PLD beam is diverging. The large divergent beam is an undesired characteristic of the PLD. To convert the PLD linear pattern to a tightly focused pattern, several methods have been tested in the literature. The most popular method is to use a single aspheric lens to collimate the PLD.22 To focus the PLD beam, a two-lens system is utilized: one lens collimates the highly divergent beam and the second lens focuses the collimated light. Another method for collimating while simultaneously circularizing the beam emitted by a PLD is to use two orthogonally positioned cylindrical lenses. One lens is placed to collimate the beam in the fast axis direction and another in slow axis direction.23 A pair of anamorphic prisms is used in addition to an aspheric lens for PLD beam circularization. In this way, a collimated elliptical beam can be circularized by either expanding in the slow axis of the ellipsis or compressing in the fast axis direction.24 In Table 1, a comparison between size, cost, ellipticity, beam quality, and beam focusability of different collimation methods of PLD is given. Table 1Comparison of different collimation methods for PLDs.
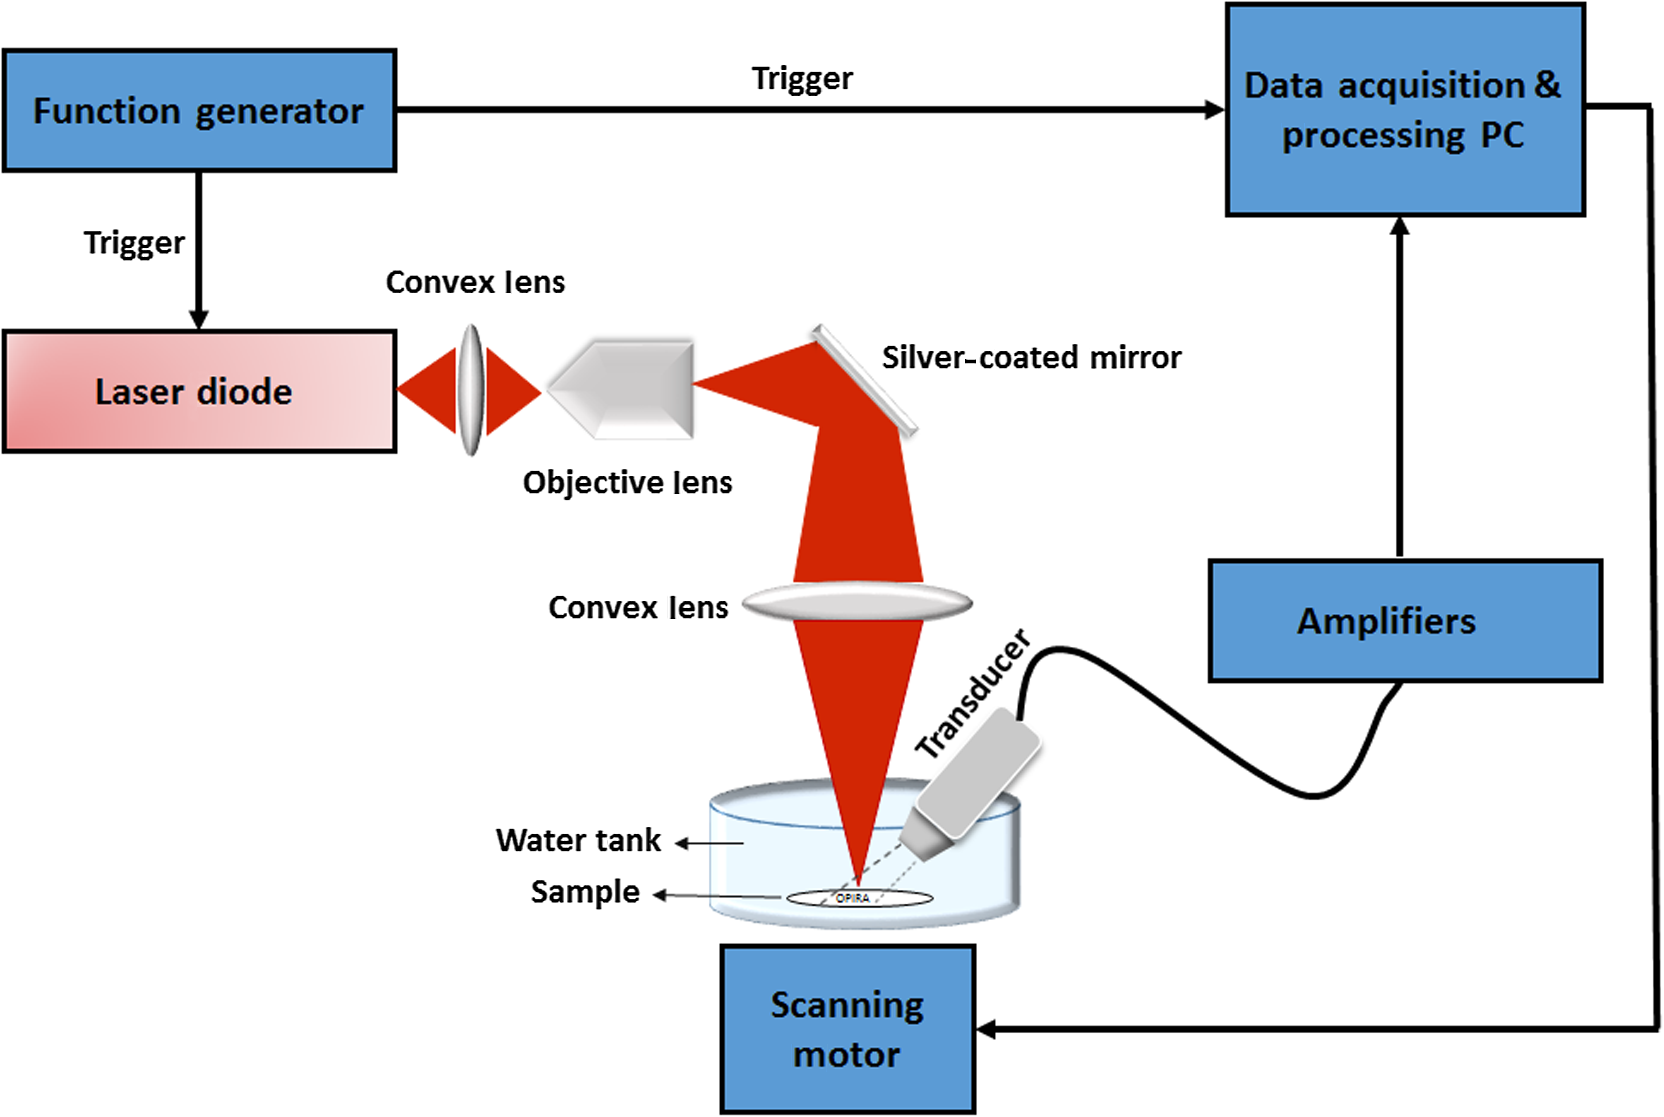
Because of the large divergence in the fast axis direction, the lens used to collimate or focus a laser diode beam is a combination of at least one aspheric surface to correct the spherical aberration and a numerical aperture (NA) of at least 0.3 to avoid severe beam truncation. Here, we proposed using an objective lens that includes aspheric lenses with NA equal to 0.6 (, Newport Cooperation, California) to focus the beam of the PLD on the sample. The scheme for the focusing optics has been evaluated using ZEMAX 13 with the goal of reaching a focal point on the sample and efficiently conserving the energy (see Fig. 1). Uniform intensity distribution is considered in this design for a laser beam. Using this optical configuration, a spot size of [Fig. 1(b)] is reached and can be considered the spatial resolution of the PAM system. The working distance of the objective lens is about , and the overall depth of focus is about . Fig. 1ZEMAX simulation of the focusing elements: (a) optical components of the focusing scheme, (b) point spread function of the beam on the sample, (c) cross-sectional view of the fluence map (logarithmic scale) for the biological tissue, (d) logarithmic fluence map on the surface, (e) at the depth of 1 mm, (f) at the depth of 2 mm, and (g) at the depth of 5 mm.  We also showed how 905-nm light is propagated through a tissue. The tissue is considered a single layer () cube with optical properties of and , corresponding to that of biological tissue for 905-nm wavelength.25 A light source illuminates the surface of the tissue with a spot size of in diameter [Fig. 1(c)]. Normalized fluence is calculated by Monte Carlo simulation. photons are simulated using MCX software.26 The size of voxels is . Figure 1(c) shows a fluence map (logarithmic scale) at a vertical cross section with , which is where the source is located. Figures 1(d)–1(g) show the fluence map at the plane on the surface, at the depths of 1, 2, and 5 mm below the surface, respectively. In the following, three LC PAI configurations are presented. 2.1.Transmission Mode Low-Cost Photoacoustic MicroscopyIn transmission mode, the transducer is placed at a 180-deg angle with the incident light perpendicular to the sample (see Fig. 2). 2.2.Reflection Mode Low-Cost Photoacoustic MicroscopyIn reflection mode PAM, a transducer is held at a 40-deg angle27 with the incident light focused on the sample as shown in Fig. 3. In both configurations, the diverging beam passes through a convex lens (AC254-100-A1, Thorlabs) with a 100-mm focal length and 50-mm diameter to focus the laser beam on the objective lens. An objective lens (, Newport Corporation, California) with the NA of 0.65 and a magnification of 40 is used to spherically shape the beam. The beam is then refracted perpendicularly by a mirror and focused onto the imaging target through another convex lens (AC254-060-A1, Thorlabs) with 60-mm focal length and 50-mm diameter. An stage (ASI LX-4000, Applied Scientific Instrumentation, Inc., Eugene, Oregon) is used for transversal scanning of the sample. The acoustic signal generated at each spot is collected by a stationery cylindrical unfocussed ultrasonic transducer (V312-SU immersion transducers, Olympus). The active element diameter of the transducer is 6 mm and its central frequency is 10 MHz with 71% bandwidth. The signal is amplified by passing it through a cascade of three low-noise amplifiers (ZFL-500 Mini Circuits RF/Microwave Components, Brooklyn), therefore, providing a gain of 69.54 dB. The data acquisition is performed using an field-programmable gate array-based National Instrument (NI) system. NI LabVIEW software is used as a platform to acquire signal, analyze it, and generate an image. The sampling frequency in the DAQ card is set to . 2.3.Low-Cost Photoacoustic Computed TomographyThe optical setup is slightly modified for the computed tomography configuration (see Fig. 4). The same PLD is used in the setup. The PLD is placed 3 cm away from the top of the sample, where the illuminated area on the imaging target is sufficiently large to cover the imaging target. A diffuser (DG10-120—Ø1 in. Unmounted N-BK7 Ground Glass Diffuser, 120 Grit, Thorlabs) is placed 5 mm away from the light source. A , thin rectangular piece of black tape is placed in a gel phantom comprising of 3% agar powder in water. We have explained the phantom reconstruction procedure previously.28 A cylindrically focused ultrasonic transducer (V326-SU immersion transducers, Olympus) is placed on a cylinder. The transducer is positioned horizontally in the same plane as the black tape. The diameter over which the tomography scanning is performed is 75 mm. The cylinder is rotated using a stepper motor (Applied Motion Products Inc.), the driver of which (ST5-Si-NN, Applied Motion Products Inc.) is controlled by NI LabVIEW software. The transducer is rotated in 120 steps circularly around the phantom, and, at each step, 1000 signals are acquired and averaged. We use a filtered back projection image reconstruction algorithm to generate an image. For all three configurations, the laser repetition rate is controlled by a function generator (ATTEN ATF20B, OscilloWave Inc.). The function generator is also used to synchronize the data acquisition card and the laser illumination by providing a standard transistor–transistor logic signal. 3.Results3.1.Transmission Mode Low-Cost Photoacoustic MicroscopyTransmission mode optical resolution-PAM was developed with the setup given in Fig. 2. We imaged a star pattern, constructed of several crossed strips of black tape, for evaluation of the system performance. Two hundred times averaging was used in this experiment. The SNR of the resultant PA signal was measured as 9.5 dB. The sample was scanned by a motorized scanner with and a step size of . Figure 5(a) shows a photograph of the imaging target in a gel phantom. Figure 5(b) shows the PA image of the phantom. In Fig. 5(c), an intensity profile across the PA image, along the dotted line indicated in Fig. 4(b), is shown. 3.2.Reflection Mode Low-Cost Photoacoustic MicroscopyThe performance of reflection mode LC-PAM is evaluated using several phantoms. The results of two of them are demonstrated in Fig. 6. The phantoms were imaged. One of them was a cross made of black tape (horizontal width and vertical width ), and another one was the word “OPIRA” (the name of our lab) also made of black tape (). In this experiment, the SNR of the PA signal was measured as 6.5 dB. We used 500 times averaging of the PA signals to form a meaningful PA image. Figures 6(a) and 6(b) show photographs of the phantoms. Figure 6(a) shows the PA images of the phantoms. In Fig. 6(b), an intensity profile across the PA image, along the dotted line indicated in Fig. 6(a), is shown. The samples are scanned by a motorized scanner with and a step size of . In Fig. 6(c), we cropped half of the image that did not contain any absorber. Fig. 6Reflection mode LC-PAM results: (a) photograph of a cross phantom made with black tape, (b) intensity profile along the dotted line across the PA image in (a), and (c) PA image of the word “OPIRA” made of black tape.  We also imaged a mouse skin ex-vivo, using reflection mode LC-PAM. The sample was placed on a white nonabsorbing material in a water tank. The SNR of the PA signal obtained from the sample after 5000 times averaging was 2 dB. Figure 7(a) is a photograph of the mouse skin with the region that was imaged by reflection mode LC-PAM. Figure 7(b) shows the PA image of the vasculature in the mouse skin. The number of scanning points used in this experiment was with a step size of . Acquisition time was about 12 min. Wayne State University Animal Care and Use Committee approved the animal tissue imaging study. 3.3.Low-Cost Photoacoustic Computed TomographyThe imaging target here was a thin strip of black tape. The PA image was constructed when each acquisition was repeated 1000 times and averaged. The SNR of the resultant PA signals for LC-PACT configuration was measured as 5.4 dB. The image is generated from 120 view angles; each view was taken at 7.2-deg increments. Figure 8 shows the reconstructed PACT image using a filtered back projection algorithm. Acquisition time, including the reconstruction processes, was about 30 s for 120 view angles. 4.DiscussionWe demonstrated the results of using a very low-energy PLD in PAI systems. Pulse width and pulse energy are the two main limitations of most low-energy light sources.28–30 The large pulse width limits the stress confinement and affects the acoustic wave generated from small vessels.16 Low pulse energy light sources generate low SNR PA signals with limited penetration depth. To enhance the SNR, a large number of averaging is used. This, however, affects the temporal resolution of the system. We devised some signal enhancement algorithms similar to averaging but more efficient, i.e., achieving the same SNR with a much smaller number of averaging. Therefore, the very LC of the low-energy laser source is advantageous; the spatial and temporal resolutions of the images produced may not be satisfactory for some applications. In this paper, we showed the performance of three configurations of LC PAI using LC PLDs: transmission mode LC-PAM, reflection mode LC-PAM, and LC-PACT. The PA images of several tissue-mimicking phantoms and biological samples were shown. Several challenges were tackled in this study. The main challenge of the microscopy configurations was to focus the diverging linear beam to a tightly spherical shape (Fig. 1). Several configurations were suggested in the literature16 to solve this problem. We chose an optical setup in which the laser energy on the sample is maximum (tightest focus and highest energy per pulse). This configuration was simulated in ZEMAX. Although we reported both transmission mode and reflection modes, the SNR of the PA signal in transmission mode was much higher. Transmission mode configuration, however, has limited applications, e.g., imaging of a very thin tissues ex-vivo. To the best of our knowledge, this study demonstrated, for the first time, the development of a reflection mode LC-PAM with a very low-energy PLD for imaging biological phantoms (Fig. 7). In reflection mode LC-PAM configuration, the transducer was tilted 40 deg, which yielded a lower SNR. We believe that the results will improve if the location of the transducer to the sample is iteratively tested. There are several factors that affect the quality of the resultant images. The pulse width of the PLD was about 55 ns, which limits the stress confinement and affects the acoustic wave generated from small vessels. In-vivo imaging using LC-PACT is the future plan for this study. The low excitation energy is another major restriction of using low-energy PLDs. By averaging numerous PA signals at each position, the SNR can be increased. We are developing signal processing algorithms to reduce the number of averaging.31 This will make the implementation of such systems faster and hence more practical. 4.1.Image Formation TimeImage formation time highly depends on the PLD repetition rate and the number of averaging we consider at each pixel location. Since the number of averaging is different for different configurations, it is calculated for each setup separately.
4.2.Spatial ResolutionIn PAM configurations (both transmission and reflection modes), the beam size determines the spatial resolution. Based on our ZEMAX simulation results demonstrated in Fig. 1 and confirmed in the experiments, the spatial resolution was measured to be about [Fig. 1(b)]. We also measured the lateral resolution of both PAMs experimentally by imaging the edge of a sharp blade and a carbon fiber with a step size of . The edge spread function was fitted using the maximum amplitude projection data across a line. The first derivative of the edge spread function creates a line spread function, and the full width at half maximum of that was considered the lateral resolution. The measured lateral resolution was for the transmission mode LC-PAM and for reflection mode LC-PAM. For PACT, the spatial resolution depends on the number of view angles and the reconstruction algorithm. In our study with 120 view angles and the back projection reconstruction algorithm, the spatial resolution measured . 5.ConclusionIn this study, we have presented the feasibility of using a very low-energy PLD () in the configuration of PAI systems. We have demonstrated the use of such LC laser sources with three PA systems: transmission mode LC-PAM, reflection mode LC-PAM, and LC-PACT. The results of imaging several tissue-mimicking phantoms and mouse skin vasculature showed that, using such very low-energy lasers, we will be able to build compact PAI systems. The current drawback of such systems is their coarse temporal resolution. We are developing signal processing techniques that decrease the number of repetitions to 100 times or lower, which significantly improves the temporal resolution of such LC PAI systems. DisclosuresThe authors have no relevant financial interests in the paper and no other potential conflicts of interest to disclose. AcknowledgmentsThe authors thank engineers from Laser Components Co. for their helpful discussion. The authors acknowledge the Wayne State University Startup Fund. ReferencesS. Hu, K. Maslov and L. V. Wang,
“Three-dimensional optical-resolution photoacoustic microscopy,”
J. Visualized Exp., 51 e2729
(2011). http://dx.doi.org/10.3791/2729 Google Scholar
K. Maslov et al.,
“Optical-resolution photoacoustic microscopy for in vivo imaging of single capillaries,”
Opt. Lett., 33
(9), 929
–931
(2008). http://dx.doi.org/10.1364/OL.33.000929 OPLEDP 0146-9592 Google Scholar
T. J. Allen and P. C. Beard,
“Pulsed near-infrared laser diode excitation system for biomedical photoacoustic imaging,”
Opt. Lett., 31
(23), 3462
–3464
(2006). http://dx.doi.org/10.1364/OL.31.003462 OPLEDP 0146-9592 Google Scholar
R. G. Kolkman, W. Steenbergen and T. G. van Leeuwen,
“In vivo photoacoustic imaging of blood vessels with a pulsed laser diode,”
Lasers Med. Sci., 21
(3), 134
–139
(2006). http://dx.doi.org/10.1007/s10103-006-0384-z LMSCEZ 1435-604X Google Scholar
L. V. Wang and S. Hu,
“Photoacoustic tomography: in vivo imaging from organelles to organs,”
Science, 335
(6075), 1458
–1462
(2012). http://dx.doi.org/10.1126/science.1216210 SCIEAS 0036-8075 Google Scholar
S. Hu and L. V. Wang,
“Optical-resolution photoacoustic microscopy: auscultation of biological systems at the cellular level,”
Biophys. J., 105
(4), 841
–847
(2013). http://dx.doi.org/10.1016/j.bpj.2013.07.017 BIOJAU 0006-3495 Google Scholar
C. Zhang, K. Maslov and L. V. Wang,
“Subwavelength-resolution label-free photoacoustic microscopy of optical absorption in vivo,”
Opt. Lett., 35
(19), 3195
–3197
(2010). http://dx.doi.org/10.1364/OL.35.003195 OPLEDP 0146-9592 Google Scholar
Y. Yuan, S. Yang and D. Xing,
“Optical-resolution photoacoustic microscopy based on two-dimensional scanning galvanometer,”
Appl. Phys. Lett., 100
(2), 023702
(2012). http://dx.doi.org/10.1063/1.3675907 APPLAB 0003-6951 Google Scholar
W. Song et al.,
“Reflection-mode in vivo photoacoustic microscopy with subwavelength lateral resolution,”
Biomed. Opt. Express, 5
(12), 4235
–4241
(2014). http://dx.doi.org/10.1364/BOE.5.004235 BOEICL 2156-7085 Google Scholar
J. Chen et al.,
“Blind-deconvolution optical-resolution photoacoustic microscopy in vivo,”
Opt. Express, 21
(6), 7316
–7327
(2013). http://dx.doi.org/10.1364/OE.21.007316 OPEXFF 1094-4087 Google Scholar
C. Zhang et al.,
“Reflection-mode submicron-resolution in vivo photoacoustic microscopy,”
J. Biomed. Opt., 17
(2), 020501
(2012). http://dx.doi.org/10.1117/1.JBO.17.2.020501 JBOPFO 1083-3668 Google Scholar
K. H. Song and L. V. Wang,
“Deep reflection-mode photoacoustic imaging of biological tissue,”
J. Biomed. Opt., 12
(6), 060503
(2007). http://dx.doi.org/10.1117/1.2818045 JBOPFO 1083-3668 Google Scholar
R. G. Kolkman, W. Steenbergen and T. G. van Leeuwen,
“Reflection mode photoacoustic measurement of speed of sound,”
Opt. Express, 15
(6), 3291
–3300
(2007). http://dx.doi.org/10.1364/OE.15.003291 OPEXFF 1094-4087 Google Scholar
L. Zeng et al.,
“3D-visual laser-diode-based photoacoustic imaging,”
Opt. Express, 20
(2), 1237
–1246
(2012). http://dx.doi.org/10.1364/OE.20.001237 OPEXFF 1094-4087 Google Scholar
P. LeBoulluec, H. Liu and B. Yuan,
“A cost-efficient frequency-domain photoacoustic imaging system,”
Am. J. Phys., 81
(9), 712
–717
(2013). http://dx.doi.org/10.1119/1.4816242 AJPIAS 0002-9505 Google Scholar
T. Wang et al.,
“A low-cost photoacoustic microscopy system with a laser diode excitation,”
Biomed. Opt. Express, 5
(9), 3053
–3058
(2014). http://dx.doi.org/10.1364/BOE.5.003053 BOEICL 2156-7085 Google Scholar
T. J. Allen and P. C. Beard,
“High power visible light emitting diodes as pulsed excitation sources for biomedical photoacoustics,”
Biomed. Opt. Express, 7
(4), 1260
–1270
(2016). http://dx.doi.org/10.1364/BOE.7.001260 BOEICL 2156-7085 Google Scholar
R. Berg, O. Jarlman and S. Svanberg,
“Medical transillumination imaging using short-pulse diode lasers,”
Appl. Opt., 32
(4), 574
–579
(1993). http://dx.doi.org/10.1364/AO.32.000574 APOPAI 0003-6935 Google Scholar
C. Moorman and A. Hamilton,
“Clinical applications of the MicroPulse diode laser,”
Eye, 13
(2), 145
–150
(1999). http://dx.doi.org/10.1038/eye.1999.41 12ZYAS 0950-222X Google Scholar
P. K. Upputuri and M. Pramanik,
“Pulsed laser diode based optoacoustic imaging of biological tissues,”
Biomed. Phys. Eng. Express, 1
(4), 045010
(2015). http://dx.doi.org/10.1088/2057-1976/1/4/045010 Google Scholar
K. Roth et al.,
“Imaging of a linear diode bar for an optical cell stretcher,”
Biomed. Opt. Express, 6
(3), 807
–814
(2015). http://dx.doi.org/10.1364/BOE.6.000807 BOEICL 2156-7085 Google Scholar
T. Kasuya, T. Suzuki and K. Shimoda,
“A prism anamorphic system for Gaussian beam expander,”
Appl. Phys., 17
(2), 131
–136
(1978). http://dx.doi.org/10.1007/BF00885244 Google Scholar
A. Bashkatov et al.,
“Optical properties of human skin, subcutaneous and mucous tissues in the wavelength range from 400 to 2000 nm,”
J. Phys. D: Appl. Phys., 38
(15), 2543
–2555
(2005). http://dx.doi.org/10.1088/0022-3727/38/15/004 JPAPBE 0022-3727 Google Scholar
Q. Fang and D. A. Boas,
“Monte Carlo simulation of photon migration in 3D turbid media accelerated by graphics processing units,”
Opt. Express, 17
(22), 20178
–20190
(2009). http://dx.doi.org/10.1364/OE.17.020178 OPEXFF 1094-4087 Google Scholar
Z. Xie et al.,
“Laser-scanning optical-resolution photoacoustic microscopy,”
Opt. Lett., 34
(12), 1771
–1773
(2009). http://dx.doi.org/10.1364/OL.34.001771 OPLEDP 0146-9592 Google Scholar
A. Hariri et al.,
“Low cost photoacoustic spectroscopy system for evaluation of skin health,”
Proc. SPIE, 9976 99760X
(2016). http://dx.doi.org/10.1117/12.2238423 PSISDG 0277-786X Google Scholar
P. K. Upputuri and M. Pramanik,
“Performance characterization of low-cost, high- speed, portable pulsed laser diode photoacoustic tomography (PLD-PAT) system,”
Biomed. Opt. Express, 6
(10), 4118
–4129
(2015). http://dx.doi.org/10.1364/BOE.6.004118 BOEICL 2156-7085 Google Scholar
A. Hariri, A. Fatima and M. Nasiriavanaki,
“A cost-effective functional connectivity photoacoustic tomography (fcPAT) of the mouse brain,”
Proc. SPIE, 10064 1006439
(2017). http://dx.doi.org/10.1117/12.2254345 PSISDG 0277-786X Google Scholar
A. Hariri et al.,
“Photoacoustic signal enhancement: towards utilization of very low-cost laser diodes in photoacoustic imaging,”
Proc. SPIE, 10064 100645L
(2017). http://dx.doi.org/10.1117/12.2253043 PSISDG 0277-786X Google Scholar
BiographyAli Hariri is a PhD student in Nanoengineering Department at the University of California-San Diego. He started his PhD in Biomedical Engineering Department at Wayne State University in 2015 as a graduate research assistant in OPIRA lab. He received his master’s degree and bachelor’s degree in Biomedical Engineering from Sharif University of Technology and Amirkabir University of Technology in Iran. He worked on developing different configurations of photoacoustic imaging technique including computed tomography and microscopy (both acoustic and optical resolution). Afreen Fatima is a graduate student in Biomedical Engineering at Wayne State University and holds a bachelor’s degree in electronics and communication engineering from Osmania University. She has been working as a student research assistant in OPIRA lab since September 2015, with research specialization in instrumentation. Her research so far has been mainly on the design and development of low cost, efficient, portable and point of care photoacoustic imaging systems. Currently, she is a researcher in the Biomedical Engineering Department. Her focus is in electronics, programming, optics and acoustic technology. Nafiseh Mohammadian received her BSc degree in physics from the University of Isfahan and her MSc degree in electro-optical engineering from the University of Technology in Iran. In 2015, she joined OPIRA lab as a research scholar at Wayne State University. She worked on increasing the imaging depth in optical imaging methods by suppressing the turbidity that exists in biological tissues using spatial light modulator. Currently, she is a PhD student in CREOL working on complex coherence measurement for imaging in Ayman Abouraddy’s research group. Sadreddin Mahmoodkalayeh received his MSc degree in physics from Sharif University of Technology, Tehran, Iran, in 2013. Since then, he has been a PhD student of physics at Shahid Beheshti University, Tehran, Iran. Currently, his research is in the field of bioimaging including diffuse optical tomography and photoacoustic imaging. Mohammad Ali Ansari received his MSc and PhD degrees in photonics from Shahid Beheshti Univertity, Tehran, Iran, in 2006 and 2010, respectively. Since then, he had been a faculty member of Laser and Plasma Research Institute (LAPRI), at Shahid Beheshti University. He is the head of Optical Bio-imaging Lab with main research areas including functional near-infrared spectroscopy and diffuse optical tomography. Nicholas Bely is undergraduate student in OPIRA lab at Wayne State University. His focus is mainly on developing Labview programs for different photoacoustic imaging configurations (tomography and microscopy). Mohammad R. N. Avanaki received a PhD with outstanding achievement in medical optical imaging and computing from the University of Kent, United Kingdom, in 2012. His bachelor's and master's degrees with honors are in electronics engineering. In 2014, he completed a three-year postdoctoral fellowship at Washington University in St. Louis, in the OILab. He is currently an assistant professor in the Biomedical Engineering, Dermatology and Neurology Departments of Wayne State University and Scientific member of Karmanos Cancer Institute. He is also serving as the chair of bioinstrumentation track. |