

|
|
1.IntroductionBreast cancer is one of the most common forms of cancer in females, and the number of patients has been continuously rising. According to a statistical survey of cancer in 2015, it is expected that 29% of the world’s female population will suffer from breast cancer.1 Neoadjuvant chemotherapy is performed before a surgery to reduce the tumor volume, which can produce a better outcome from the surgery. After three cycles of chemotherapy, which take weeks, the tumor volume is monitored to see the response from chemotherapy. The results will determine the next set of procedures. However, if the tumor response can be predicted after only one cycle of chemotherapy, we can avoid up to two more unnecessary cycles of chemotherapy, which in turn reduces the side effects and costs of chemotherapy. Currently, x-ray mammography (or computed tomography, CT),2–4 ultrasound imaging,5,6 and magnetic resonance imaging (MRI)7–9 are common tools used to monitor tumor response during neoadjuvant chemotherapy. Among these modalities, mammography is the most widely used tool for monitoring the efficacy of the treatment. However, exposure to x-rays in mammography limits the frequency of monitoring and can show only morphological information. Moreover, the use of mammography is limited to postmenopausal women since breast cancer in young patients cannot be clearly visualized due to high breast density.2–4 MRI has the advantages of being harmless and having a good contrast in soft tissue such as breast, but it is rarely used because of its high cost.7–9 Ultrasound imaging is another option for monitoring breast cancer chemotherapeutic efficacy. It is portable and gives no radiation exposure to patients, but it still only provides morphological information of tumor and is highly dependent on the operator’s expertise.5,6 Diffuse optical spectroscopy, also called as near-infrared spectroscopy (NIRS) due to the light source being in the range of near-infrared (NIR) wavelengths (650 to 1000 nm), has been popular in breast cancer study because of its relatively deep penetration of light in breast tissue and no radiation exposure.10–15 Oxyhemoglobin (OHb), deoxyhemoglobin (RHb), lipid, and water are the major chromophores in the NIR range, and they have low absorption, which enables light to penetrate into deep tissues. Utilizing multiple wavelengths of NIR light, the concentrations of OHb and RHb can be estimated. These hemodynamic changes can be associated with tumor growth and response to the treatment. A number of techniques have been extensively applied to diagnose breast cancer and to observe the chemotherapeutic efficacy through hemodynamic changes.16–30 Imaging studies that perform a mammographic compression on the breast report significant discrepancies in total hemoglobin concentration, blood oxygenation, and blood flow between tumor and nontumor tissue.23–25 This hemodynamic sensitivity to compression can be utilized as an effective contrast mechanism for imaging diseased breast tissue.26–29 However, breast compression is limited by the varying stiffness of breast tissue between patients, making it difficult to correlate hemodynamic changes with pressure.25 In addition, the contrast mechanism may be uncomfortable or painful for some patients. Mechanisms that utilize respiration-derived contrasts such as breath holding22 and the use of vasoactive inhalational gases30 are less invasive and more appealing for patients. Dynamic hemodynamic features in the breast tumor tissue were found to be markedly different from normal healthy tissue during a breath-holding task.22 During breath holding, in a tumor, the complex network of blood vessels induces hemodynamic changes different from normal tissue. The technique may be applied to tumor tissue before and after treatment by comparing the change in OHb and RHb concentrations during breath holding. The problem with this method is that breath holding may be unsuitable for patients who have lung disease, such as asthma patients.22 In addition, breath holding is not applicable for preclinical animal studies. Thus, we determined that a contrast mechanism that does not rely on subject compliance would be more suitable to diagnose and predict the efficacy of chemotherapy for breast cancer in a preclinical animal study. In this study, we hypothesize that the vascular reactivity during respiratory challenges will be different between healthy blood vessels and tumor blood vessels and that the change of vascular reactivity will occur before the structural change in tumor after chemotherapy, which can be measured using NIRS. To confirm our hypothesis, we performed small animal experiments with inhalational gas modulation, and the changes of OHb and RHb during these respiratory challenges were monitored daily before tumor cell inoculation, during tumor growth, and postchemotherapy. 2.Materials and Methods2.1.Experimental SetupThe NIRS system consists of two broadband light sources (tungsten halogen, HL-2000-HP, Ocean Optics) and two NIR spectrometers (600 to 1100 nm, USB 4000, Ocean Optics) as detectors. The source and detector probes are placed in contact with the tissue using bundled multimode optical fibers with 2-mm diameter. Each source–detector pair was placed 5 mm apart (Fig. 1). The protocol ensures that a fixed light pressure is applied on the breast by the probes. The point of contact is fixed to eliminate the effects of changes in contact conditions. Respiratory challenges were performed using a gas mixer with an isoflurane vaporizer. The anesthesia state of the animal was maintained at 1.5% to 2% isoflurane. A warm water pad was used to maintain the body temperature and to prevent hypothermia due to anesthesia during the experiment. 2.2.Animal ModelThe 13762 MAT B-III (CRL-1666, ATCC, Manassas, Virginia) rat breast cancer cell line was cultured in vitro using combined McCoy’s 5A (ATCC, Manassas, Virginia) with 10% fetal bovine serum and 1% penicillin/streptomycin (P/S) under 5% in the incubator. Before cell inoculation to the animal, we checked cell viability using trypan blue and counted lived cells using a hemacytometer. One million viable tumor cells were inoculated in the right caudal mammary fat pad of female Fischer 344 rats (180 to 200 g). The 13762 MAT B-III cell line has a very rapid growth rate compared to other cancer cell lines,31 so tumor growth could be observed only a few days after inoculation. Tumor size was measured daily using a caliper, and ellipsoid volume calculation was used to estimate the volume.32 Chemotherapy was initiated using a single high dose of cyclophosphamide ( body weight) administered via intraperitoneal (i.p.) injection. On the other hand, for the control group, animals had the same amount of saline administration and did not receive any treatment. The procedures in this study were approved by the Institutional Animal Care and Use Committee of the Gwangju Institute of Science and Technology. 2.3.Experimental ProcedureRespiratory challenges to cause a vascular reaction were performed automatically by a gas mixer system using a software (LabVIEW 2011, National Instruments). The overall gas intervention protocol is shown in Fig. 2. The broadband spectra were monitored throughout the intervention. Spectra for the first 20 min with air () were taken as a baseline. After the first 20 min of air supply, a hypoxic gas () was supplied to animals for 10 min followed by a 10 min of hyperoxic gas (100% oxygen) inhalation. As a final step, air was supplied for 15 min to induce tissue oxygenation back to the baseline level. Pulmonary oxygen saturation () values and heart rate (HR) were monitored by a pulse oximeter (Mouse Ox, Starr Inc.) fastened to the hind foot during the experiment (Fig. 4). The experiment was performed for a total of 22 days [4 days before cell inoculation (baseline), 7 days after cell inoculation, and 11 days postchemotherapy]. 2.4.Data AnalysisTo quantify the change of hemoglobin concentrations, we acquired reflectance intensities at 5 wavelengths (730, 750, 800, 830, and 850 nm) and applied the modified Beer–Lambert’s law (MBLL).33 The MBLL assumes that the absorbance of OHb and RHb dominates the attenuation of the NIR range and that scattering is constant for the range of wavelengths used. The change of OHb and RHb concentrations, and , can be obtained by where is the change of optical density and and are the extinction coefficients of RHb and OHb at wavelength , respectively. The path length () is determined by , where is the separation distance between the source and detector and DPF is the differential path length factor.34The spectrometer used for this study collects reflectance intensity from 600 to 1000 nm, but it does not have a good quantum efficiency over 900-nm wavelength (), which contains information of lipid and water. Therefore, we only focused on estimating relative changes of OHb and RHb concentrations, which can be done utilizing a minimum of two wavelengths. However, we found that utilizing a few more wavelengths below and beyond 805 nm provides less noise compared to taking reflectance intensity from two wavelengths, which was confirmed by performing a blood phantom experiment. The blood phantom experiment also proved that and from Eq. (1) during oxygen modulation are not different from those using broadband fitting with a photon diffuse equation (data not shown).35 Figure 3 shows a representative plot of changes in OHb and RHb concentrations from tumor breast during a respiratory challenge. Both OHb and RHb concentrations were maintained for the initial 20 min of air (baseline) breathing, and OHb concentration was decreased while RHb concentration was increased when the gas was switched from air to hypoxic gas for 10 min. Switching from hypoxic to hyperoxic gas induced a rapid increase in OHb with a drop in RHb. Finally, OHb and RHb concentrations slowly returned to baseline level when hyperoxic gas was switched back to air. The level followed the trend of changes in OHb, but the HR gradually decreased with a sudden drop during hyperoxic gas inhalation. The maximum concentration changes during the transition from 16% to 100% oxygen for both OHb and RHb were taken as the vascular reactivity and analyzed alongside the changes in tumor volume. 3.Results3.1.Hemodynamic Response of Chemotherapy GroupFigure 4(a) shows the averaged vascular reactivity and tumor volume change from the treated group () from both the contralateral breast [OHb(C) and RHb(C)] and tumor breast (OHb and RHb). Hemodynamic changes in the normal and tumor breast were measured 2 days before inoculation as baseline. Chemotherapy was conducted 7 days after cell inoculation when the tumor had grown to in diameter. In the case of vascular reactivity for OHb and RHb, the maximum values of and throughout the whole experiment were selected as references for the normalization. In the contralateral normal breast, vascular reactivity [OHb(C) and RHb(C)] remained relatively constant throughout the whole experiment. On the other hand, vascular reactivity (OHb and RHb) in the tumor breast increased as the tumor grew and decreased shortly after chemotherapy. Fig. 4The averaged vascular reactivity of OHb, RHb, and tumor volume change for the chemotherapy-treated group [(a), ] and control group [(b), ] in the contralateral breast and tumor breast. Thick straight lines with filled markers represent OHb (red) and RHb (blue) in the tumor breast. Dashed line with hollow symbol represents OHb(C) (red) and RHb(C) (blue) in the contralateral breast.  3.2.Hemodynamic Response of Control Group (Nonchemotherapy)Figure 4(b) shows the averaged vascular reactivity and tumor volume change from the control group () from the both the contralateral normal [OHb(C) and RHb(C)] and tumor breast (OHb and RHb). Hemodynamic changes in the normal and tumor breast were measured 2 days before inoculation as baseline. Vascular reactivity of OHb and RHb was normalized by maximum values of and at day 12. Saline was administered instead of cyclophosphamide for the control group, and hemodynamic changes were measured until tumor size grew to an averaged tumor volume of , at which point the animal was sacrificed. In the normal breast, the vascular reactivity remained constant, consistent with results from the normal breast of the treated group. Furthermore, the increase in vascular reactivity with tumor growth was also consistent with that of the treated group before chemotherapy. Vascular reactivity increased continuously until day 12 but decreased slightly on day 13. 3.3.Hemodynamic Response of Early Chemotherapy GroupFrom the above results, however, we were not able to affirm that there is a difference in terms of vascular reactivity between the control and chemotherapy-treated groups after either saline or cyclophosphamide administration since the period of comparison between them is quite short. In the treated group, chemotherapy was performed 7 days after breast cancer cell inoculation and an additional 11 days of data were acquired. On the other hand, as we can see in Fig. 4(b), vascular reactivity of the control group was measured for only 3 days more after saline administration. Therefore, there was a need to start chemotherapy earlier (5 days after cell inoculation), so we have enough days to compare the change of vascular reactivity between the treated group and the control group postchemotherapy. Figure 5 shows averaged vascular reactivity together with tumor volume change for the early chemotherapy group. For the OHb and RHb vascular reactivity, the maximum change was observed on day 9 (1-day postchemotherapy) and was selected as a reference. In doing so, we obtained results similar to the first chemotherapy-treated group in Fig. 4(a). In the contralateral normal breast, the OHb and RHb vascular reactivity remained relatively constant throughout the whole experiment (not shown). On the other hand, the changes of OHb and RHb vascular reactivity in tumor breast increased as the tumor grew (Fig. 5). Fig. 5The averaged vascular reactivity for OHb, RHb, and tumor volume change for the early chemotherapy group () in the contralateral breast and tumor breast. Thick straight lines with filled markers represent OHb (red) and RHb (blue) in the tumor breast. Dashed line with hollow symbol represents OHb(C) (red) and RHb(C) (blue) in the contralateral breast. 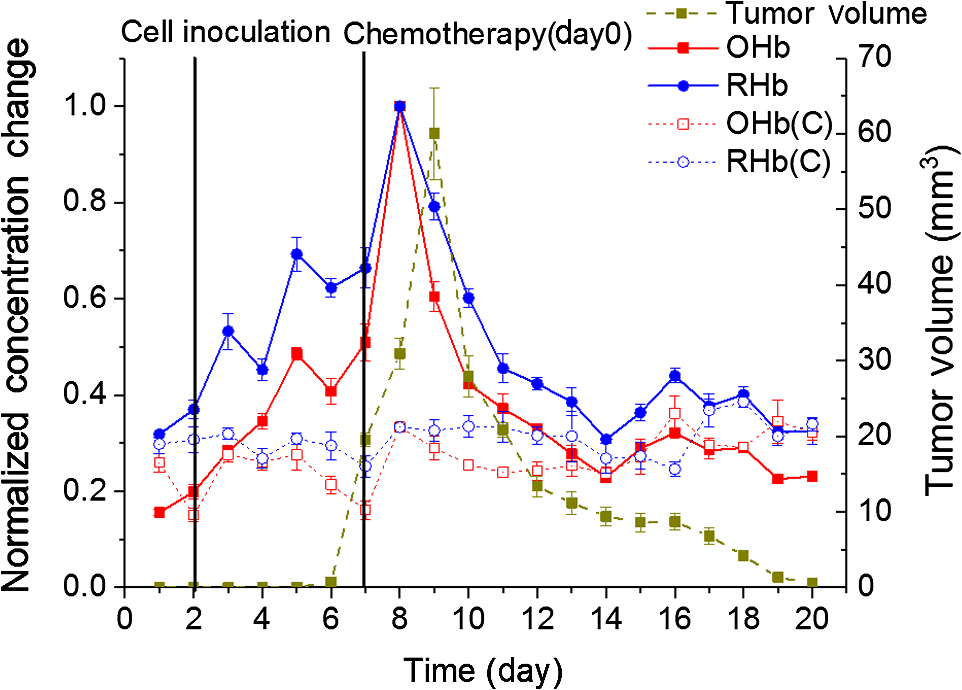 3.4.Individual Hemodynamic Response of Chemotherapy-Treated GroupWe demonstrated the normalized hemodynamic response from each group at previous sections. In this section, the individual hemodynamic responses of the subjects in the chemotherapy-treated group are shown and examined against the tumor volume. In most cases, both OHb and RHb vascular reactivity increases continuously during tumor growth before chemotherapy (Fig. 6, black). RHb vascular reactivity was similar to that from OHb; therefore, the data are not shown. An exception is made for two subjects (subjects b and f in Fig. 6) where the vascular reactivity dropped before chemotherapy. Measurements made after chemotherapy (red) show a general decrease in vascular reactivity for both OHb and RHb along with a decrease in tumor volume (tumor regression). From Fig. 6, in most of the subjects, the decrease in vascular reactivity preceded the decrease in tumor volume by 1 day (a, d, e) while two subjects (b, c) showed that vascular reactivity dropped 2 days prior to tumor volume regression. Fig. 6Individual OHb vascular reactivity results from the tumor breast of the chemotherapy-treated group. (CTX represents chemotherapy). Black straight lines with filled markers represent changes of OHb concentration value before CTX and red dashed lines with filled markers represent changes of OHb concentration value after CTX. Blue dashed horizontal lines represent imaginary lines of 70% value of the maximum concentration change.  We can also analyze the effects of the treatment by comparing the volume at the same level of OHb and RHb concentration changes. At 70% of the maximum concentration change (dashed horizontal line in Fig. 6), the tumor volume is smaller during tumor growth compared to tumor regression after chemotherapy. This implies that blood vessel density was higher in tumors before initiating chemotherapy. During tumor growth, blood vessels are rapidly generated (tumor angiogenesis) forming a complex jumbled network resulting in a lower vascular reactivity. 3.5.Individual Hemodynamic Response of Early Chemotherapy GroupIn this section, we present the individual hemodynamic responses of the subjects in the early chemotherapy group using the same procedure used for the chemotherapy-treated group. As shown in Fig. 7, OHb vascular reactivity increased continuously during tumor growth before chemotherapy (black). Measurements made after chemotherapy (red) show a general decrease in vascular reactivity for both OHb and RHb along with a tumor regression (RHb vascular reactivity data are not shown but are very similar to OHb). All the subjects showed that the decrease in vascular reactivity preceded the decrease in tumor volume by 1 day prior to tumor volume regression. The consistent response for the early chemotherapy-treated group verifies that the results from the treated group [Fig. 4(a)] are indeed valid and resulted from the effects of chemotherapy not from the continued tumor growth. Fig. 7Individual OHb vascular reactivity results from the tumor breast of the early chemotherapy group. (CTX represents chemotherapy). Black straight lines with filled markers represent changes of OHb concentration value before CTX and red dashed lines with filled markers represent changes of OHb concentration value after CTX. Blue dashed horizontal lines represent imaginary lines of 70% value of the maximum concentration change.  4.DiscussionIn this study, vascular reactivity, defined as the concentration change of either OHb or RHb from 16% to 100% oxygen inhalation, was monitored during tumor growth and after chemotherapy. The reason for using hypoxic gas followed by hyperoxic gas is to apply the same protocol for clinical study in the future. Since the arterial oxygen saturation value of a normal subject during air breathing is around 99%, a supply of 100% oxygen will not cause a substantial change in tissue oxygenation. Therefore, 16% oxygen gas was given to animals prior to 100% oxygen gas to have a substantial change of oxygenation in tumors. Another reason for using respiratory challenges is due to the system used in this study. Unlike time and frequency domain NIRS, the continuous wave NIRS (CWNIRS) system employed in this study does not provide absolute values of hemoglobin concentration. Therefore, inhalational gas modulation was applied to cause a physiological change (in this case, vascular reactivity), which can be observed by CWNIRS as the tumor grows and after administration of cyclophosphamide. This vascular reactivity was compared before and after chemotherapy to see if it can be a potential biomarker for monitoring the response of chemotherapy. The administration of cyclophosphamide induced a regression of tumor size, and it is important to note that vascular reactivity started to decrease 1 day before the tumor started to regress its volume. On average, the tumors started to regress two days after chemotherapy for both sets of treated groups [Figs. 4(a) and 5]. The observation of tumor regression confirms the efficacy of cyclophosphamide. The decrease of OHb and RHb vascular reactivity 1 or 2 days before the regression of tumor volume is a key piece of evidence demonstrating that monitoring vascular reactivity during inhalational gas intervention may serve as an earlier indicator of chemotherapeutic efficacy over observation of tumor volume change, which is the conventional method for monitoring the treatment response. However, the control group also showed a decrease of vascular reactivity on day 13 when tumor size reached over 12 mm in diameter [Fig. 4(b)]. We surmised that this occurred as a consequence of necrosis in the breast tumor. As the tumor grows, it acquires irregular characteristics, including leaky vessel walls due to the abnormally rapid cell proliferation. The tumor blood vessel networks become disorganized and highly permeable with sluggish blood flow and lacking essential functions such as vasodilation and vasoconstriction.36 Thus, the necrotic region may occur at the center of the tumor where there is insufficient blood supply due to the growing complex blood vessel network. To confirm this, breast tumor tissue with varying sizes was stained. Figure 8 shows the H&E staining result for varying sizes of tumor tissue showing the increase of necrotic region with tumor volume. As can be seen from the staining, most of tumor cells are viable (blue/purple) until the tumor diameter is around 5 mm, but the hypoxic (pale pink) and empty space due to necrotic tissue becomes dominant when the tumor size reaches (bottom in Fig. 8, tumor volume ). The distribution of viable well-perfused region and necrotic poorly perfused region is heterogeneous in large tumor. These observations explain the continued increase of vascular reactivity before reaching around , but then vascular reactivity starts to decrease once the tumor volume is greater than in the control group. This result brought up a question of whether the decrease of vascular reactivity at day 13 in Fig. 4(a) is due to the chemotherapy effect or the occurrence of necrosis as the tumor grows since the tumor continued to grow at day 13. Therefore, additional experiments shown in Fig. 5 have been performed at smaller tumor volumes with chemotherapy, so we expect that the vascular reactivity will continue to increase if there is no chemotherapeutic effect. The vascular reactivity again decreased after chemotherapy prior to tumor volume regression, which proves that the decrease of vascular reactivity after cyclophosphamide treatment is due to the chemotherapy effect and not a consequence of tumor growth. The reason why vascular reactivity shows an earlier response to chemotherapy than tumor volume change is not clear at this moment, but it may be answered by understanding the metabolic change of tumor cells during chemotherapy. The chemotherapeutic agent is delivered to tumor cells via the blood vessel network, and the metabolic rate of the tumor will slow down as the tumor responds to the chemotherapeutic agent. As the tumor metabolic rate decreases due to chemotherapy, the oxygen consumption of the tumor will also lower, which will result in less response to the change of oxygen concentration in inhaled gas. Tumor metabolism change should occur before tumor cells undergo necrosis or apoptosis; therefore, the change of vascular reactivity will precede the change of tumor volume postchemotherapy. There were delays from the time of the gas switch until OHb/RHb started to change (). The majority of this delay is from the time of the switched gas reaching the nose cone due to a relatively long gas tube from a gas mixer (). An additional delay will come from the time of inhaled gas to affect tissue oxygenation. In general, tissue keeps constant oxygenation by autoregulation of blood vessels. However, tumor blood vessels lack smooth muscle cells due to its rapid growth, so autoregulation does not function properly in tumor tissue during respiratory challenges. Therefore, it is expected that tumor breast will have less delay of and than that from normal breast when there is an inhalational gas switch. However, our data did not show any conclusive results. Two thirds of data showed that and of tumor tissue changed earlier than those from normal breast when inhalational gas was switched from hypoxic to hyperoxic gas. The other one-third of data showed opposite results. We also checked delay time between normal and tumor breast after chemotherapy. Although and of tumor breast changed 6 s earlier than normal breast, we need additional experiments and detailed analysis due to a large variations of delay time. In this study, we did not consider the blood volume and geometric changes during tumor growth and its regression after chemotherapy. When the tumor is small ( diameter), our probe, having 5-mm source detector separation, will detect the whole tumor averaged vascular reactivity while it will detect only a partial region of tumor vascular reactivity when the tumor is getting bigger than 5-mm diameter. It is our current limitation and can be the reason for showing heterogeneity in vascular reactivity among animals. Despite this limitation, our data showed the potential of vascular reactivity as a marker of predicting a response from chemotherapy, and employing a diffuse optical tomography system or functional MRI and PET will overcome this limitation, which can be a future study. 5.ConclusionsIn conclusion, we found that respiratory challenges cause a significant change in vascular reactivity in tumor breast but not in normal breast. This implies that a respiratory challenge can serve as a contrast agent to detect breast tumor from normal breast tissue. We also found that the vascular reactivity during a respiratory challenge responded 1 day earlier than the change in tumor volume after chemotherapy. This study showed that vascular reactivity during respiratory challenges may serve as a biomarker in the early detection of breast tumor and in the prediction of tumor response from chemotherapy. DisclosuresWe declare that there are no relevant financial interests and no other potential conflicts of interest in this manuscript. AcknowledgmentsThis work was partially supported by the National Research Foundation of Korea (NRF) Grants (Nos. 2012K1A2B1A03000757, 2013R1A1A2013625, and 2015R1D1A1A02062382), the Traditional Korean Medicine R&D Program funded by the Ministry of Health and Welfare through the Korea Health Industry Development Institute (No. HI15C0190), a grant from the Small and Medium Business Administration (No. S2273981), and the GIST Research Institute (GRI) in 2017. We are vey grateful to Ms. Eloise Anguluan for her proof of the manuscript. ReferencesR. Siegel, K. Miller and A. Jemal,
“Cancer statics, 2015,”
CA Cancer J. Clin., 65
(1), 5
–29
(2015). http://dx.doi.org/10.3322/caac.21254 CAMCAM 0007-9235 Google Scholar
J. E. Martin, M. Moskowitz and J. R. Milbrath,
“Breast cancer missed by mammography,”
Am. J. Roentgenol., 132
(5), 737
–739
(1979). http://dx.doi.org/10.2214/ajr.132.5.737 Google Scholar
R. M. Abolfath et al.,
“A molecular dynamics simulation of DNA damage induction by ionizing radiation,”
Phys. Med. Biol., 58
(20), 7143
–7157
(2013). http://dx.doi.org/10.1088/0031-9155/58/20/7143 PHMBA7 0031-9155 Google Scholar
L. Stankevicins et al.,
“MiR-34a is up-regulated in response to low dose, low energy X-ray induced DNA damage in breast cells,”
Radiat. Oncol., 8
(1), 231
(2013). http://dx.doi.org/10.1186/1748-717X-8-231 Google Scholar
N. Houssami et al.,
“Clinical utility of ultrasound-needle biopsy for preoperative staging of the axilla in invasive breast cancer,”
Anticancer Res., 34
(3), 1087
–1097
(2014). ANTRD4 0250-7005 Google Scholar
H. M. Zonderland et al.,
“Diagnosis of breast cancer: contribution of US as an adjunct to mammography,”
Radiology, 213
(2), 413
–422
(1999). http://dx.doi.org/10.1148/radiology.213.2.r99nv05413 RADLAX 0033-8419 Google Scholar
D. Saslow et al.,
“American Cancer Society guidelines for breast screening with MRI as an adjunct to mammography,”
CA Cancer J. Clin., 57
(2), 75
–89
(2007). http://dx.doi.org/10.3322/canjclin.57.2.75 CAMCAM 0007-9235 Google Scholar
C. E. Loo et al.,
“Magnetic resonance imaging response monitoring of breast cancer during neoadjuvant chemotherapy: relevance of breast cancer subtype,”
J. Clin. Oncol., 29
(6), 660
–666
(2011). http://dx.doi.org/10.1200/JCO.2010.31.1258 JCONDN 0732-183X Google Scholar
J. K. P. Begley et al.,
“In vivo proton magnetic resonance spectroscopy of breast cancer: a review of the literature,”
Breast Cancer Res., 14
(2), 207
(2012). http://dx.doi.org/10.1186/bcr3132 BCTRD6 Google Scholar
C. Zhou et al.,
“Diffuse optical monitoring of blood flow and oxygenation in human breast cancer during early stages of neoadjuvant chemotherapy,”
J. Biomed. Opt., 12
(5), 051903
(2007). http://dx.doi.org/10.1117/1.2798595 JBOPFO 1083-3668 Google Scholar
B. J. Tromberg et al.,
“Non-invasive in vivo characterization of breast tumors using photon migration spectroscopy,”
Neoplasia, 2 26
–40
(2000). http://dx.doi.org/10.1038/sj.neo.7900082 Google Scholar
B. W. Pogue et al.,
“Quantitative hemoglobin tomography with diffuse near infrared spectroscopy: pilot results in the breast,”
Radiology, 218 261
–266
(2001). http://dx.doi.org/10.1148/radiology.218.1.r01ja51261 RADLAX 0033-8419 Google Scholar
S. Nioka and B. Chance,
“NIR spectroscopic detection of breast cancer,”
Technol. Cancer Res. Treat., 4 497
–512
(2005). http://dx.doi.org/10.1177/153303460500400504 Google Scholar
R. Choe and T. Durduran,
“Diffuse optical monitoring of the neoadjuvant breast cancer therapy,”
IEEE J. Sel. Top. Quantum Electron., 18
(4), 1367
–1386
(2012). http://dx.doi.org/10.1109/JSTQE.2011.2177963 IJSQEN 1077-260X Google Scholar
S. A. Carp et al.,
“Hemodynamic signature of breast cancer under fractional mammographic compression using a dynamic diffuse optical tomography system,”
Biomed. Opt. Exp., 4
(12), 2911
–2924
(2013). http://dx.doi.org/10.1364/BOE.4.002911 BOEICL 2156-7085 Google Scholar
C. Zhou et al.,
“Diffuse optical monitoring of blood flow and oxygenation in human breast cancer during early stages of neoadjuvant chemotherapy,”
J. Biomed. Opt., 12 051903
(2007). http://dx.doi.org/10.1117/1.2798595 JBOPFO 1083-3668 Google Scholar
A. Cerussi et al.,
“Predicting response to breast cancer neoadjuvant chemotherapy using diffuse optical spectroscopy,”
Proc. Natl. Acad. Sci. U. S. A., 104 4014
–4019
(2007). http://dx.doi.org/10.1073/pnas.0611058104 Google Scholar
S. Jiang et al.,
“Evaluation of breast tumor response to neoadjuvant chemotherapy with tomographic diffuse optical spectroscopy: case studies of tumor region-of-interest changes,”
Radiology, 252 551
–560
(2009). http://dx.doi.org/10.1148/radiol.2522081202 RADLAX 0033-8419 Google Scholar
D. Roblyer et al.,
“Optical imaging of breast cancer oxyhemoglobin flare correlates with neoadjuvant chemotherapy response one day after starting treatment,”
Proc. Natl. Acad. Sci. U. S. A., 108 14626
(2011). http://dx.doi.org/10.1073/pnas.1013103108 Google Scholar
J. Gunther et al.,
“Combined dynamic and static optical tomography for prediction of treatment outcome in breast cancer patients,”
Proc. SPIE, 9538 953811
(2015). http://dx.doi.org/10.1364/ECBO.2015.953811 Google Scholar
J. Gunther et al.,
“Dynamic diffuse optical tomography for assessing changes of breast tumors during neoadjuvant chemotherapy,”
Proc. SPIE, 9319 93190C
(2015). http://dx.doi.org/10.1117/12.2079435 Google Scholar
M. L. Flexman et al.,
“Optical biomarkers for breast cancer derived from dynamic diffuse optical tomography,”
J. Biomed. Opt., 18
(9), 096012
(2013). http://dx.doi.org/10.1117/1.JBO.18.9.096012 JBOPFO 1083-3668 Google Scholar
D. R. Busch et al.,
“Blood flow reduction in breast tissue due to mammographic compression,”
Acad. Radiol., 21
(2), 151
–161
(2014). http://dx.doi.org/10.1016/j.acra.2013.10.009 Google Scholar
S. A. Carp et al.,
“Compression-induced changes in the physiological state of the breast as observed through frequency domain photon migration measurements,”
J. Biomed. Opt., 11
(6), 064016
(2006). http://dx.doi.org/10.1117/1.2397572 JBOPFO 1083-3668 Google Scholar
S. Jiang et al.,
“Measurement of pressure-displacement kinetics of hemoglobin in normal breast tissue with near-infrared spectral imaging,”
Appl. Opt., 48
(10), D130
–D136
(2009). http://dx.doi.org/10.1364/AO.48.00D130 APOPAI 0003-6935 Google Scholar
S. A. Carp et al.,
“Dynamic functional and mechanical response of breast tissue to compression,”
Opt. Exp., 16
(20), 16064
(2008). http://dx.doi.org/10.1364/OE.16.016064 OPEXFF 1094-4087 Google Scholar
R. X. Xu et al.,
“Development of a handheld near-infrared imager for dynamic characterization of in vivo biological tissue systems,”
Appl. Opt., 46
(30), 7442
–7451
(2007). http://dx.doi.org/10.1364/AO.46.007442 Google Scholar
G. Boverman et al.,
“Spatio-temporal imaging of the hemoglobin in the compressed breast with diffuse optical tomography,”
Phys. Med. Bio., 52 3619
–3641
(2007). http://dx.doi.org/10.1088/0031-9155/52/12/018 PHMBA7 0031-9155 Google Scholar
R. Al Abdi et al.,
“Optomechanical imaging system for breast cancer detection,”
J. Opt. Soc. Am. A., 28
(12), 2473
–2493
(2011). http://dx.doi.org/10.1364/JOSAA.28.002473 Google Scholar
S. S. Dixit et al.,
“Near infrared transillumination imaging of breast cancer with vasoactive inhalation contrast,”
Biomed. Opt., 1 295
–309
(2010). http://dx.doi.org/10.1364/boe.1.000265 Google Scholar
J. W. Choi et al.,
“A metastatic hepatoma model of rats using the 13762-MAT-B-III cell line: basic characteristics and potential as a tool for interventional oncology experiments,”
Anticancer Res., 35
(3), 1333
–1338
(2015). ANTRD4 0250-7005 Google Scholar
J. G. Kim et al.,
“Interplay of tumor vascular oxygenation and tumor observed using NIRS, needle electrode and 19F MR mapping,”
J. Biomed. Opt., 8
(1), 53
–62
(2003). http://dx.doi.org/10.1117/1.1527049 JBOPFO 1083-3668 Google Scholar
J. G. Kim and H. Li,
“Variation of haemoglobin extinction coefficients can cause errors in the determination of haemoglobin concentration measured by near-infrared spectroscopy,”
Phys. Med. Bio., 52
(20), 6295
–6322
(2007). http://dx.doi.org/10.1088/0031-9155/52/20/014 PHMBA7 0031-9155 Google Scholar
D. T. Delpy et al.,
“Estimation of optical pathlength through tissue from direct time of flight measurement,”
Phys. Med. Biol., 33
(12), 1433
–1442
(1998). http://dx.doi.org/10.1088/0031-9155/33/12/008 PHMBA7 0031-9155 Google Scholar
T. J. Farrell et al.,
“A diffusion theory model of spatially resolved, steady-state diffuse reflectance for the noninvasive determination of tissue optical properties in vivo,”
Med. Phys., 19
(4), 879
–888
(1992). http://dx.doi.org/10.1118/1.596777 MPHYA6 0094-2405 Google Scholar
H. Liu et al.,
“Noninvasive investigation of blood oxygenation dynamics of tumors by near-infrared spectroscopy,”
Appl. Opt., 39
(28), 5231
–5243
(2000). http://dx.doi.org/10.1364/AO.39.005231 APOPAI 0003-6935 Google Scholar
BiographySonghyun Lee received BS degree in electric and electronic communications engineering from Chungnam National University, Daejeon, Republic of Korea, and MS degree in information and communications from Gwangju Institute of Science and Technology (GIST), Gwangju, Republic of Korea. He is a PhD candidate at Department of Biomedical Science and Engineering (BMSE), GIST, Gwangju, Republic of Korea. His current research interest is in translational optics for medical applications. Hyeryun Jeong is a PhD candidate in the Department of BMSE at GIST, Republic of Korea. She received her BSc and MSc degrees from the Department of Medical Engineering at Yeungnam University, Republic of Korea and the Department of Medical System Engineering at GIST, Republic of Korea, respectively. Her research interests include development and application of an optical spectroscopic system to cancer and urology researches. Myeongsu Seong is a PhD candidate in the Department of BMSE at GIST, Republic of Korea. He received his BEng and MSc degrees from the Department of Medical Engineering at Jungwon University, Republic of Korea and the Department of Medical System Engineering at GIST, Republic of Korea, respectively. His research interests include development and application of an optical spectroscopic system to cancer and brain researches. Jae Gwan Kim is a professor in the Department of BMSE, GIST, Gwangju, Republic of Korea. Before joining GIST, he was a postdoctoral scholar at the Beckman Laser Institute and Medical Clinic, University of California, Irvine. He received his PhD from Joint Program of Biomedical Engineering between the University of Texas Arlington and the UT Southwestem Medical Center at Dallas in 2005. |


