|
|
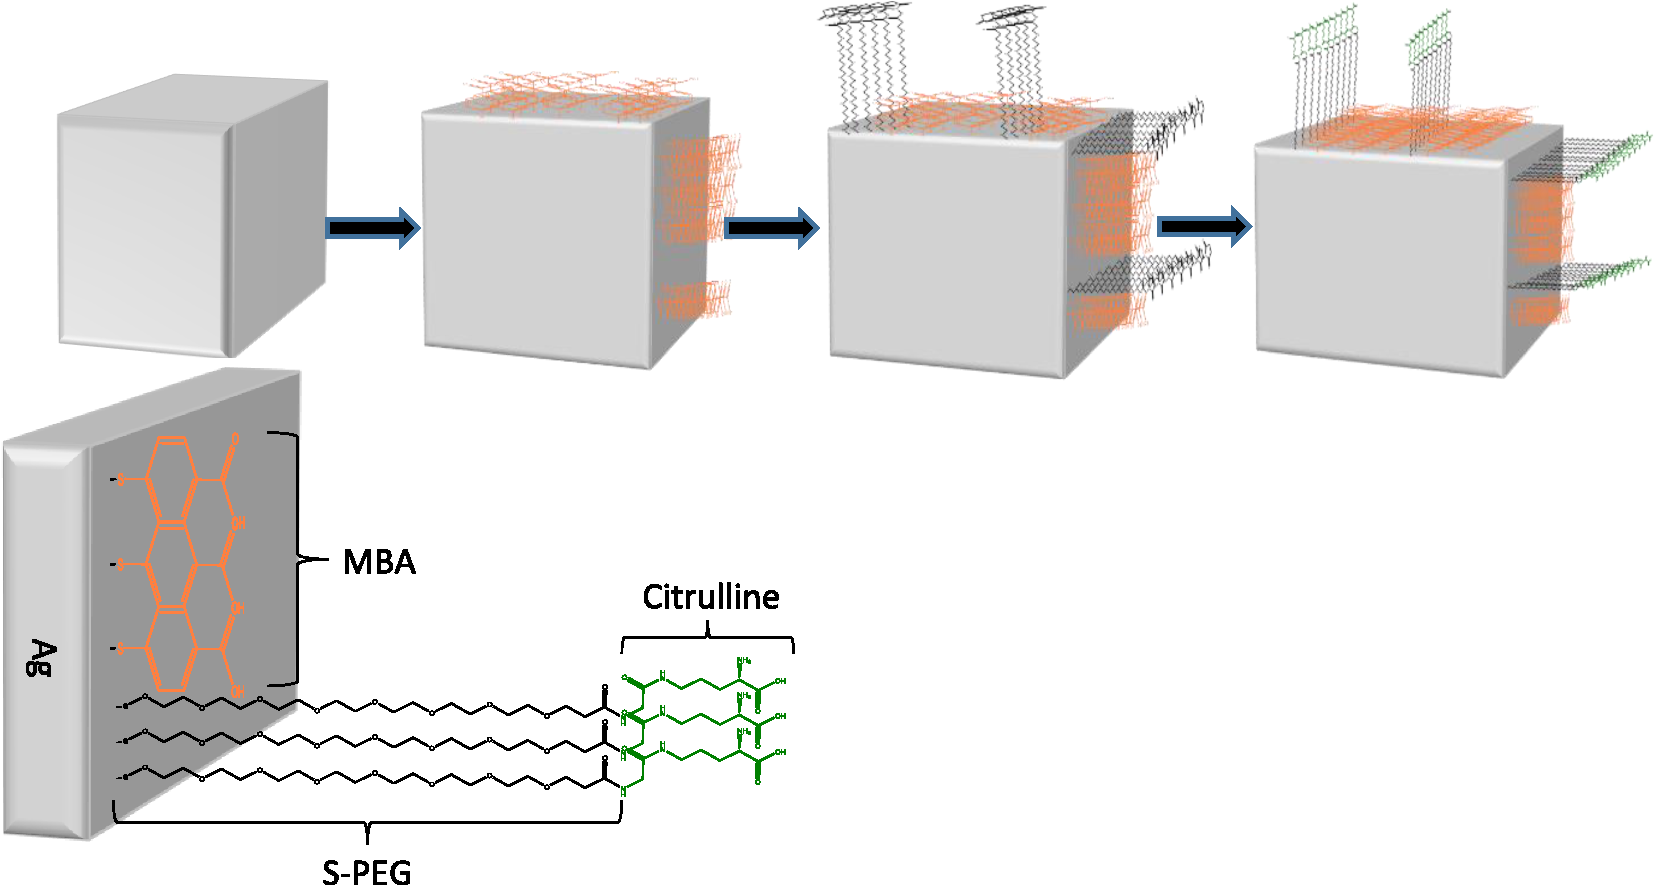
1.IntroductionPoint-of-care (PoC) devices are being explored by many groups as a potential means for cost-effective monitoring and diagnosis of patient health outside of the centralized laboratory.1–5 The most common and commercially available PoC device has been the glucose monitor but, as technology improves, many other applications, such as testing for HIV, for example, have been explored in recent years.6–9 For sensitively monitoring blood biomarkers, one PoC technique being investigated is the incorporation of surface-enhanced Raman spectroscopic (SERS) labels for more sensitive analyte detection.10–12 SERS is a method that uses a metallic surface or nanoparticle metal colloids to enhance the inelastic Raman scattering of photons.13–15 By providing vibrational energy information about molecules adsorbed to the metal surface, including nanoparticles, and because of the substantial enhancement factor from the metallic substrate, SERS can be used for trace analysis.16–22 SERS has the ability to analyze molecules in the micro- to nanomolar concentration range with some reports reaching picomolar levels in solution, and because of their narrow spectral line widths, SERS also has the potential for multiplexing multiple biomarkers making such labels a promising analytical approach for biosensing.23 l-Citrulline is an α-amino acid not normally incorporated in protein but present in free form, e.g., averaging concentration in the blood of healthy humans. The majority of circulating citrulline are produced mainly from catabolism of the amino acid glutamine and arginine, and occur primarily in intestinal mucosa cells. There is a strong relationship between citrulline circulating levels and various indices of gut status and mass status24 (e.g., villous atrophy in small bowel disease). We and others have established a strong relation between intestinal epithelial damage detected after myeloma ablative therapy of humans and experimental irradiation of rats and mice.25–36 Production of citrulline depends almost exclusively on functional intestinal enterocytes, therefore circulating citrulline level has been established as a reliable biomarker for the clinical assessment of ionizing radiation damage and gut function.24,28,29,31,37,27 Plasma citrulline has been also used as a biomarker for gut function in critically ill patients.28,29,31,37,38 In addition to the utilization of SERS reporting for detection of citrulline, DNA-based aptamers have been chosen as a molecular recognition element against the target analyte. Aptamers are uniquely suited to detect small molecules, such as citrulline, since aptamers are DNA- or RNA-based ligands capable of practically binding any other molecular target. They are identified by an in vitro method of selection frequently referred to as systematic evolution of ligands by exponential enrichment or “SELEX.”39,40 The process begins with a very large pool ( unique sequences) of randomized polynucleotides, which is generally narrowed to just a few aptamer binders per molecular target. Once multiple (typically 10 to 15) rounds of SELEX are completed, the aptamer pool is sequenced to identify candidate affinity reagents (aptamers). Aptamers have been developed as ligands to important peptides and proteins, rivaling antibodies in both affinity and specificity.41–44 Aptamers have also been developed to bind small organic molecules and cellular toxins,45–49 and even targets as small as heavy metal ions.50–53 An important advantage of aptamers is that they are developed entirely by in vitro methods, enabling applications where it is desirable to have pure, relatively inexpensive, affinity reagents that exhibit no batch-to-batch variation. Aptamers also circumvent other challenges encountered with in vivo production as with antibodies. For example, the immunogenicity of molecules smaller than a few thousand daltons, such as citrulline, is generally low, and therefore usually requires the coupling of the target molecule (a hapten) to a carrier. The coupling position of the hapten–carrier linkage may significantly affect antibody specificity, and some hapten conjugates still do not elicit a sufficient immune response. In addition to their amenability to targeting of small molecules, aptamers possess several key advantages over their antibody counterparts.54 They are smaller in size than antibodies making them entropically more stable and sterically less bulky. In stark contrast to antibodies, oligonucleotides are made through chemical synthesis, a process that is well defined, highly reproducible, sequence independent and can be readily scaled up, and their production does not depend on bacteria, cell cultures, or animals. Finally, they are much more stable at ambient temperature than antibodies, yielding a considerably higher shelf life, and they can tolerate transportation without any special requirements for cooling. In order to fabricate and characterize the components of a future aptamer-SERS biosensor for citrulline, two separate mechanisms were incorporated for the first time. Ag nanocubes were functionalized with citrulline molecules in a unique manner, and DNA-based citrulline aptamers were discovered by SELEX. While RNA aptamers to citrulline have been described previously by Famulok,55 these aptamers had fairly weak affinity for the target of , and negative selection was performed only against glycine immobilized on agarose. By contrast, here, we have developed DNA aptamers against citrulline, which are inherently more stable than RNA-based aptamers, and our aptamer selection has included counter-screening against a cocktail of the 20 essential amino acids. In this paper, functionalized nanoparticles specific for citrulline detection are characterized and novel aptamers are developed specific to citrulline to enhance the specificity and sensitivity of a future PoC SERS device. 2.Materials and Methods2.1.MaterialsHeterobifunctional polyethylene glycol (PEG) linker thiol-PEG-n-hydroxysuccinimide with a 1-kDa molecular weight was purchased from Nanocs (New York). About 200 proof ethanol (EtOH) was purchased from VWR (Radnor, Pennsylvania). 4-(2-hydroxyethyl)piperazine-1-ethanesulfonic acid (HEPES), 4-mercaptobenzoic acid (MBA), and l-citrulline were purchased from Fisher Scientific (Hampton, New Hampshire). Citrulline aptamers were discovered by Base Pair Biotechnologies (Pearland, Texas; Base Pair). After discovery, aptamers were synthesized with a 3′-dithiol group and a 5′-Cy5™ fluorophore. 2.2.Particle CharacterizationA Zetasizer nano ZS90 (Malvern, United Kingdom) was used to measure the -potential of the functionalized nanoparticles. Functionalized nanoparticle samples were put into a Greiner 96 flat bottom transparent well plate and scans were recorded between 400 and 900 nm. A Tecan ultraviolet–visible (UV/VIS) spectrometer was used to measure the extinction spectra of the silver nanoparticles. Transmission electron microscope (TEM; JEOL JEM-2010 TEM) images of the 100-nm silver nanocubes were collected to show the nanoparticles’ size and morphology. A nanosight particle tracking system (Nanosight, LM10, Salisbury, United Kingdom) was used to characterize the silver nanoparticles’ size distribution. SERS spectra were recorded using a Thermo Scientific, DXR Raman microscope (Waltham, Massachusetts) to show the enhancement capabilities of the silver nanoparticles and find the limit of detection in the microwells. The functionalized nanoparticles were excited using a 24 mW, , diode laser through a Olympus microscope objective configured with an grating. The 780-nm laser was chosen with the future biosensor in mind. Blood, a typical medium for biosensing, has a strong background fluorescence in the VIS region confounding the SERS signal. Also, due primarily to water, the absorption of blood is very high beyond the mid-infrared wavelength region. Therefore, it is useful to look outside these wavelength regions in the near-infrared wavelength band in which the background signal relative to SERS is low. The nanoparticles’ integration time was 5 s and they were exposed 30 times. The reported Raman/SERS signal is the average of all 30 scans. To verify the amide bond between citrulline and PEG, Fourier transform infrared spectrometry (FTIR) (Moore Analytical, Houston, Texas) was used. Microscale thermophoresis (MST) data were collected from two bind molecular interactions. Each test was repeated in triplicate and read twice on a Monolith NT.115 (Pico) MST instrument (NanoTemper Technologies GmbH, Germany) via thermophoresis + temperature jump at 80% laser power, 10% LED power at 25°C. 2.3.Nanoparticle SynthesisThe 100-nm edge length silver nanocubes were obtained from Dr. Hung-Jen Wu’s group within chemical engineering at Texas A&M University. Their synthesis process is described in detail in Ref. 56. Briefly, pentanediol was heated in an oil bath with a magnetic stir bar. After reaching , a silver nitrate solution followed by a polyvinylpyrrolidone (PVP) solution was repeatedly injected into the pentanediol solution until the reactant was consumed. To finish the synthesis, the nanocubes were washed with ethanol and concentrated to the desired final concentration. 2.4.Nanoparticle FunctionalizationFunctionalizing the nanoparticles and removing the capping agent PVP were based on a protocol of Moran and Xia.57 To functionalize the nanoparticles, the capping agent PVP was removed by centrifuging the nanocubes for 30 min in water. Following centrifugation, the supernatant was removed, and the nanocubes were suspended in a 1:1 ratio of ethanol and MBA. The pH of the sample was then adjusted and the nanocubes were allowed to shake 1 h on a shake plate. The sample was then centrifuged 30 min, and the supernatant was removed and replaced with a 1:1 ratio of deionized water (DI) water and MBA. Ethanol was initially added to help dissolve the PVP capping agent, but ethanol has been shown to weaken thiol bonds; therefore, the second wash step was performed without ethanol.58 The sample was then placed on a shake plate and left for 24 h. Near the end of the 24-h period, a sample of citrulline bonded to PEG was made in another centrifuge tube. To make the citrulline PEG sample, 5 mg of PEG was first dissolved in 1 ml of 50 mM HEPES resulting in a 5-mM PEG HEPES solution. Citrulline was then gently dissolved in HEPES making a 250 mM final concentration of citrulline HEPES solution. Citrulline was then added dropwise to PEG at a 5:1 ratio at pH 7.3. Citrulline forms an amide bond to PEG by displacing the NHS group on PEG. The reaction occurred over 2 h on a shake plate. Following the conjugation of citrulline to PEG, the citrulline PEG solution was slowly added dropwise at a 1:1 ratio to the nanocubes with MBA solution on a stir plate. The solution was then allowed to sit 24 h on a shake plate. Last, the sample was carefully washed one last time via centrifugation at slow speeds, 6000 rpm, to remove any excess MBA, PEG, or citrulline not bonded to the surface. The process is depicted schematically in Fig. 1. When making the protocol specific for the silver nanocubes, there are a few important parameters to consider. One of the most important parameters was having the correct pH for the various reactions to occur. Regarding the thiol group on MBA and PEG, hydrogen was displaced from sulfur and binds to the silver surface in basic solutions above pH 7. When MBA was dissolved in DI, the pH was and was raised using NaOH. NHS, the functional group on the heterobifunctional PEG, begins to hydrolyze after 4 h at pH 7. Hydrolysis occurs within 10 min at pH 8.6, meaning the citrulline would not be able to bind to the PEG after this process. Choosing the correct pH and performing the reaction before the occurrence of hydrolyzation is vital. 2.5.Citrulline Aptamer DiscoveryA key advantage of in vitro aptamer selection is that selection and counter-selection steps can be easily alternated to obtain highly specific affinity agents. In order to select DNA aptamers to citrulline, a modified version of “structure-switching” SELEX described by Martin et al.,59 was utilized. Briefly, structure-switching SELEX involves immobilization of the nucleic acid library rather than the target. The DNA library is immobilized by hybridization to a short capture oligonucleotide, and upon exposure to the target (or off-targets), candidate aptamers are eluted due to conformational change and higher affinity to the target over the capture probe. This approach is especially advantageous for selection of aptamers to small molecule targets as it does not require the chemical immobilization of the target, which can perturb the structure. Fourteen rounds of SELEX were performed. In even-numbered rounds, citrulline was used to elute the library captured on magnetic beads. In odd-numbered rounds, the library was first exposed to a cocktail of the 20 essential amino acids (Promega, catalog #L4461) followed by citrulline elution in phosphate-buffered saline (PBS) buffer, pH 7.4, , 0.05% Tween 20, with 5% human serum albumin added. Stringency was increased by increasing the concentration of the 20 essential amino acids as well as decreasing the elution concentration of the citrulline in successive rounds. After the final round, the eluted library was sequenced using an Ion Torrent Personal Genome Machine™ (Life Technologies). Approximately 100,000 sequences were then ranked by bioinformatic analysis for frequency, subsequence motifs, and secondary structure. By this process, individual aptamer candidates were then chosen for synthesis and further testing. 3.Results and Discussion3.1.Ag Nanocube Functionalization and CharacterizationAg nanocubes were initially analyzed with a zetasizer to quantify the surface charge (-charge) before and after functionalization. About of Ag nanocubes were diluted in of HEPES buffer to machine specifications and of Ag functionalized nanocubes were also diluted in the same manner as the nanocubes. The -charge of the nanoparticles decreased from before functionalization to . The surface charge is similar due to the capping agents, initially PVP before functionalization and then PEG after functionalization, both of which prevent aggregation. UV/VIS spectrophotometry was used to verify the extinction spectra from the Ag nanocube nanoparticles and these nanocube extinction spectra are tuned primarily by the edge curvature and particles size, which is why the experiments were performed using 100 nm size nanocubes. As depicted in Fig. 2(a), the functionalized nanoparticles extinction spectra were at the edge of the resonance with the 780-nm excitation wavelength. It should be noted that while it is desirable to align the extinction spectra maximum with the excitation wavelength, enhancement can still be depicted as long as there is overlap and, in addition, the literature has stated that localized resonances at different locations on the nanoparticles due to dimers, etc., are actually more effective for creating SERS enhancements than the excitation wavelength relative to location of extinction spectra maximum peak.60 After functionalizing the nanocubes, no major shift was noticed, indicating no major aggregation occurred during the functionalizing process that would have shifted the extinction spectra [Fig. 2(a)]. TEM images shown in Fig. 2(b) of the silver nanocubes were used to show their size, 100 nm and morphology, both of which are important for understanding the overall SERS intensity.61 After proving that the extinction spectra of the functionalized nanoparticles were in resonance with the excitation wavelength and did not shift after functionalization using the UV/VIS spectrometer, multiple devices were used to further characterize the surface chemistry. Fig. 2(a) UV/VIS spectrum of Ag nanocubes (black line) and functionalized Ag nanocubes (red line). (b) TEM image of Ag nanocubes. 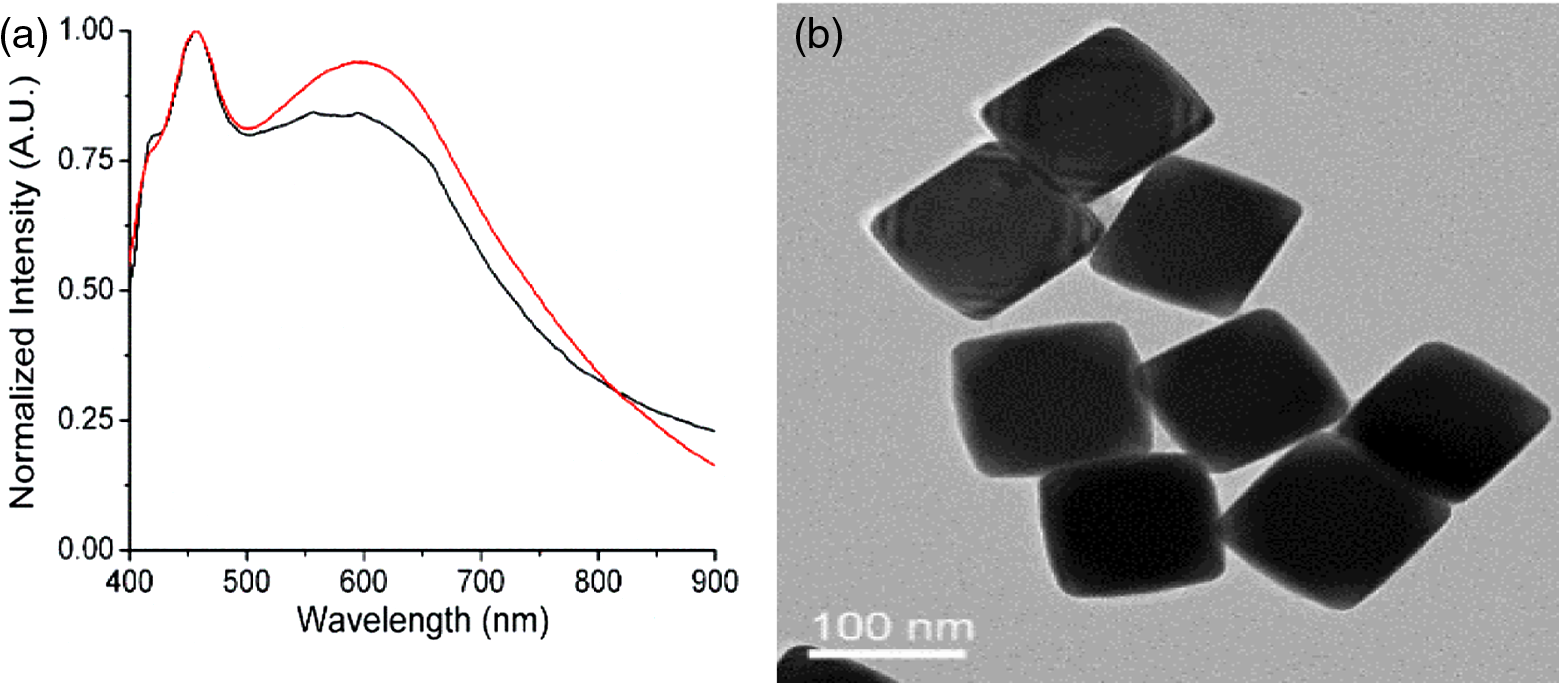 FTIR spectroscopy (Moore Analytical, Houston, Texas) was used to verify that the amide bond was formed between citrulline and PEG. To insure that the NHS group on heterobifunctional PEG did not prevent the amine group on citrulline from bonding to the PEG, an important step was to confirm the citrulline did bond to PEG. A peak analysis was performed of the FTIR spectra in Fig. 3(a), which revealed that an amide bond did form, which was depicted in the spectrum by the peak between 1630 and . Fig. 3(a) FTIR spectrum of functionalized Ag nanocubes, highlighting the amide bond formed between PEG and citrulline. (b) Raman spectrum of MBA powder (top plot) and SERS spectrum of MBA bonded to Ag nanocubes (middle plot). Raman spectrum of MBA dissolved in PBS showing no detectable signal at this concentration as expected (bottom plot).  3.2.Raman and Surface-Enhanced Raman Spectroscopy AnalysisKnowing that PEG and citrulline are present on the functionalized nanoparticles, Raman and SERS scans were performed to verify the Raman reporter MBA was present on the nanoparticles. As depicted in Fig. 3(b), to understand the SERS spectra, first, a Raman scan of MBA powder was taken. A peak analysis was done to show where the vibrational modes are for the two main Raman and SERS MBA peaks, 1099/1596 and , respectively. The shift from 1099 to and 1596 to from Raman to SERS corresponds to MBA bonding to the metal surface.62 For the peak, the vibrational modes correspond to the in-plane bending. The peak corresponds to the stretching. Using the Raman spectra of MBA powder to know where the Raman active peaks of MBA are located, a SERS scan of the functionalized nanoparticles with of MBA was taken to verify MBA did bond to the surface of the nanoparticles. A Raman scan of of MBA dissolved in PBS was then taken to see if that concentration of MBA gives off a detectable Raman signal. Figure 3(b) shows no detectable signal from of MBA dissolved in PBS, which verifies that the MBA peaks detectable when bonded to the Ag nanocubes can come only from the Ag surface enhancement. Also, the enhancement factor of nanoparticles was calculated to be . Raman spectra of 100-mM MBA dissolved in ethanol were used to compare with the intensity from of MBA adsorbed to the surfaces of the nanoparticles, to calculate the enhancement factor. The enhancement factor (EF) for the nanoparticles was calculated using Eq. (1)60 to be where : 12,940.65 a.u., SERS intensity; : 89.76 a.u., the intensity of MBA at 100 mM concentration; : concentration of 100 mM MBA in moles; and : Concentration of MBA in moles.After characterization of the functionalized nanoparticles, a serial dilution was performed of the functionalized nanoparticles to find the limit of detection. The functionalized nanoparticles were first pipetted into the microwell and an initial SERS scan was performed. Following the initial scan, the nanoparticles were diluted by mixing them with PBS at a 1:1 ratio, the solution was then pipetted in the microwell and a SERS scan was performed. The surface modified nanoparticles were found to have a 24.50 pM limit of detection, as depicted in Fig. 4(a), which was defined as where the 1075 and MBA peaks were no longer easily discernable after multiple dilution steps. 3.3.Microscale Thermophoresis Binding StudiesAfter finding the limit of detection for the nanoparticles, the aptamers were tested with a MST instrument. To perform the MST experiments, a Cy5-labeled version of the natural DNA citrulline aptamer ( stock in PBS, was folded by incubating at 95°C for 5 min, and then allowed to slowly cool to room temperature (). The aptamer was diluted in a solution of PBS, , and 0.05% Tween 20. This was then added to an equal volume of a twofold dilution series of citrulline in a solution of PBS, , and 0.05% Tween 20. The final concentration of Cy5-citrulline aptamer was 5 nM. The final concentration of citrulline ranged from down to 1.526 nM, as depicted in Fig. 4(b). For the tests against the cocktail of 20 essential amino acids (EA), EA1, EA2, and EA3 are technical replicates of the same solution of 5 nM Cy5-labeled aptamer in a mixture of all 20 essential amino acids (arginine, lysine, aspartic acid, glutamic acid, glutamine, asparagine, histidine, serine, threonine, tyrosine, cysteine, methionine, tryptophan, alanine, isoleucine, leucine, phenylalanine, valine, proline, and glycine). There is a dilution series of the mixture in PBS pH 7.4, , 0.05% Tween 20, such that at the highest concentration, the amino acids are each , with a twofold serial dilution down from there, to a final concentration of 15.26 nM. The aptamer was held constant at 5 nM. Last, tests (T)—T1, T2, and T3—are technical replicates of the amino acid citrulline with 5 nM Cy5-labeled aptamer. The highest final concentration of citrulline is , with a twofold serial dilution down from there in PBS pH 7.4, , 0.05% Tween 20, to a final concentration of 1.526-nM citrulline. The aptamer was held constant at 5 nM. The dissociation constant, , for the citrulline aptamer binding to citrulline was calculated to be [the vertical dashed line in Fig. 4(b)], with a 95% confidence interval of 3.325 to . To find the , three technical replicates were collected for each concentration. Technical replicates 2 and 3 were baseline corrected toward the technical replicate one. This was done by computing the average fluorescence for each replicate and then by subtracting that value from replicate 1’s average fluorescence. Based on the MST-based affinity data, the for citrulline aptamer to citrulline was determined to be . The MST affinity data were also used for the citrulline aptamer to the 20 amino acids. The aptamer does appear to have some minor affinity for the other 20 amino acids, but the affinity is weak, . Thus, the aptamer is at least 50-fold more selective for citrulline than the other 20 amino acids. 4.ConclusionAg nanocubes successfully functionalized for a future SERS citrulline competitive binding assay were presented for the first time. Citrulline aptamers were also made that bind to citrulline. To characterize the functionalized nanoparticles, a UV/VIS spectrometer was used to verify that the extinction spectra were in resonance with the excitation wavelength. TEM images were used to ascertain the length of the nanocubes and visualize the morphology. An FTIR was used to prove that citrulline did bind to the PEG on the surface of the nanocubes, and SERS scans were used to verify MBA binding to the surface of the nanoparticles. Last, SERS scans were used to show a potential limit of detection to 24.5 pM and MST was used to prove that the citrulline aptamers do bind to citrulline with a strong affinity in comparison to the other amino acids. AcknowledgmentsThe authors would like to acknowledge Dr. Hung-Jen Wu, an assistant professor within chemical engineering at Texas A&M and his group for synthesizing the nanocubes; Meredith Davies, an undergraduate student at Texas A&M, for helping perform the characterization experiments and graphing data; and Robert H. Batchelor, aptamer development manager at Base Pair BioTechnologies, for guiding the aptamer selection. The authors wish to acknowledge the financial support from the NIH—National Institute of Environmental Health Sciences under Grant Nos. 2R44ES022303 and P30ES023512. The content is solely the responsibility of the authors and does not necessarily represent the official views of the National Institutes of Health. ReferencesL. Kulinsky, Z. Noroozi and M. Madou,
“Present technology and future trends in point-of-care microfluidic diagnostics,”
Methods Mol. Biol., 949 3
–23
(2013). http://dx.doi.org/10.1007/978-1-62703-134-9_1 Google Scholar
C. I. L. Justino et al.,
“Advances in point-of-care technologies with biosensors based on carbon nanotubes,”
TrAC Trends Anal. Chem., 45 24
–36
(2013). http://dx.doi.org/10.1016/j.trac.2012.12.012 TTAEDJ 0165-9936 Google Scholar
J. Lee and S.-H. Lee,
“Lab on a chip for in situ diagnosis: from blood to point of care,”
Biomed. Eng. Lett., 3
(2), 59
–66
(2013). http://dx.doi.org/10.1007/s13534-013-0094-y Google Scholar
K. Omidfar, F. Khorsand and M. D. Azizi,
“New analytical applications of gold nanoparticles as label in antibody based sensors,”
Biosens. Bioelectron., 43 336
–347
(2013). http://dx.doi.org/10.1016/j.bios.2012.12.045 BBIOE4 0956-5663 Google Scholar
A. Warsinke,
“Point-of-care testing of proteins,”
Anal. Bioanal. Chem., 393
(5), 1393
–1405
(2009). http://dx.doi.org/10.1007/s00216-008-2572-0 ABCNBP 1618-2642 Google Scholar
D. J. Dietzen et al.,
“Point-of-care glucose analysis in neonates using modified quinoprotein glucose dehydrogenase,”
Diabetes Technol. Ther., 15
(11), 923
–928
(2013). http://dx.doi.org/10.1089/dia.2013.0160 Google Scholar
C. Moore,
“Point-of-care tests for infection control: should rapid testing be in the laboratory or at the front line?,”
J. Hosp. Infect., 85
(1), 1
–7
(2013). http://dx.doi.org/10.1016/j.jhin.2013.06.005 Google Scholar
P. von Lode,
“Point-of-care immunotesting: approaching the analytical performance of central laboratory methods,”
Clin. Biochem., 38
(7), 591
–606
(2005). http://dx.doi.org/10.1016/j.clinbiochem.2005.03.008 Google Scholar
A. K. Yetisen, M. S. Akram and C. R. Lowe,
“Paper-based microfluidic point-of-care diagnostic devices,”
Lab Chip, 13
(12), 2210
(2013). http://dx.doi.org/10.1039/c3lc50169h LCAHAM 1473-0197 Google Scholar
M. Benford,
“Nanofluidic biosensing for B-amyloid detection using SERS,”
Nano Lett., 8
(6), 1729
–1735
(2008). http://dx.doi.org/10.1021/nl0808132 NALEFD 1530-6984 Google Scholar
R. A. Tripp, R. A. Dluhy and Y. Zhao,
“Novel nanostructures for SERS biosensing,”
Nano Today, 3
(3–4), 31
–37
(2008). http://dx.doi.org/10.1016/S1748-0132(08)70042-2 NTAOCG 1748-0132 Google Scholar
M. Wang et al.,
“Optofluidic device for ultra-sensitive detection of proteins using surface-enhanced Raman spectroscopy,”
Microfluid. Nanofluid., 6
(3), 411
–417
(2009). http://dx.doi.org/10.1007/s10404-008-0397-y Google Scholar
C. V. Raman,
“Part II: The Raman effect: investigation of molecular structure by light scattering,”
Trans. Faraday Soc., 25 781
–792
(1929). http://dx.doi.org/10.1039/TF9292500781 TFSOA4 0014-7672 Google Scholar
J. M. Benevides, S. A. Overman and G. J. Thomas,
“Raman, polarized Raman and ultraviolet resonance Raman spectroscopy of nucleic acids and their complexes,”
J. Raman Spectrosc., 36
(4), 279
–299
(2005). http://dx.doi.org/10.1002/(ISSN)1097-4555 JRSPAF 0377-0486 Google Scholar
Z. Movasaghi, S. Rehman and I. U. Rehman,
“Raman spectroscopy of biological tissues,”
Appl. Spectrosc. Rev., 42
(5), 493
–541
(2007). http://dx.doi.org/10.1080/05704920701551530 APSRBB 0570-4928 Google Scholar
K. C. Bantz et al.,
“Recent progress in SERS biosensing,”
Phys. Chem. Chem. Phys., 13
(24), 11551
–11567
(2011). http://dx.doi.org/10.1039/c0cp01841d PPCPFQ 1463-9076 Google Scholar
K. Hering et al.,
“SERS: a versatile tool in chemical and biochemical diagnostics,”
Anal. Bioanal. Chem., 390
(1), 113
–124
(2008). http://dx.doi.org/10.1007/s00216-007-1667-3 ABCNBP 1618-2642 Google Scholar
B. Sharma et al.,
“SERS: materials, applications, and the future,”
Mater. Today, 15
(1–2), 16
–25
(2012). http://dx.doi.org/10.1016/S1369-7021(12)70017-2 MATOBY 1369-7021 Google Scholar
M. D. Porter et al.,
“SERS as a bioassay platform: fundamentals, design, and applications,”
Chem. Soc. Rev., 37
(5), 1001
(2008). http://dx.doi.org/10.1039/b708461g CSRVBR 0306-0012 Google Scholar
H. K. K. Kneipp et al.,
“Single molecule detection using near infrared surface-enhanced Raman scattering,”
Springer Ser. Chem. Phys., 67 144
–160
(2001). http://dx.doi.org/10.1007/978-3-642-56544-1 SSCPDA 0172-6218 Google Scholar
A. K. Kalkan and S. J. Fonash,
“Laser-activated surface-enhanced Raman scattering substrates capable of single molecule detection,”
Appl. Phys. Lett., 89
(23), 233103
(2006). http://dx.doi.org/10.1063/1.2399369 APPLAB 0003-6951 Google Scholar
G. McNay et al.,
“Surface-enhanced Raman scattering (SERS) and surface-enhanced resonance Raman scattering (SERRS): a review of applications,”
Appl. Spectrosc., 65
(8), 825
–837
(2011). http://dx.doi.org/10.1366/11-06365 APSPA4 0003-7028 Google Scholar
L. Rodriguez-Lorenzo, L. Fabris and R. A. Alvarez-Puebla,
“Multiplex optical sensing with surface-enhanced Raman scattering: a critical review,”
Anal. Chim. Acta, 745 10
–23
(2012). http://dx.doi.org/10.1016/j.aca.2012.08.003 Google Scholar
P. Crenn, B. Messing and L. Cynober,
“Citrulline as a biomarker of intestinal failure due to enterocyte mass reduction,”
Clin. Nutr., 27
(3), 328
–339
(2008). http://dx.doi.org/10.1016/j.clnu.2008.02.005 Google Scholar
N. M. Blijlevens et al.,
“Citrulline: a potentially simple quantitative marker of intestinal epithelial damage following myeloablative therapy,”
Bone Marrow Transplant., 34
(3), 193
–196
(2004). http://dx.doi.org/10.1038/sj.bmt.1704563 BMTRE9 0268-3369 Google Scholar
A. Vanclee et al.,
“Keratinocyte growth factor ameliorates acute graft-versus-host disease in a novel nonmyeloablative haploidentical transplantation model,”
Bone Marrow Transplant., 36
(10), 907
–915
(2005). http://dx.doi.org/10.1038/sj.bmt.1705157 BMTRE9 0268-3369 Google Scholar
L. C. Lutgens et al.,
“Plasma citrulline concentration: a surrogate end point for radiation-induced mucosal atrophy of the small bowel. A feasibility study in 23 patients,”
Int. J. Radiat. Oncol. Biol. Phys., 60
(1), 275
–285
(2004). http://dx.doi.org/10.1016/j.ijrobp.2004.02.052 Google Scholar
L. C. H. W. Lutgens et al.,
“Monitoring myeloablative therapy-induced small bowel toxicity by serum citrulline concentration,”
Cancer, 103
(1), 191
–199
(2005). http://dx.doi.org/10.1002/(ISSN)1097-0142 Google Scholar
L. C. H. W. Lutgens et al.,
“Citrulline: a physiologic marker enabling quantitation and monitoring of epithelial radiation-induced small bowel damage,”
Int. J. Radiat. Oncol. Biol. Phys., 57
(4), 1067
–1074
(2003). http://dx.doi.org/10.1016/S0360-3016(03)00781-8 IOBPD3 0360-3016 Google Scholar
L. C. H. W. Lutgens et al.,
“Monitoring myelo-ablative therapy induced small bowel toxicity by serum citrulline concentration: a comparison with sugar permeability tests,”
Radiother. Oncol., 73 S210
–S211
(2004). http://dx.doi.org/10.1002/cncr.20733 RAONDT 0167-8140 Google Scholar
L. Lutgens and P. Lambin,
“Biomarkers for radiation-induced small bowel epithelial damage: an emerging role for plasma citrulline,”
World J. Gastroenterol., 13
(22), 3033
–3042
(2007). Google Scholar
M. Moroni et al.,
“Accelerated hematopoietic syndrome after radiation doses bridging hematopoietic (H-ARS) and gastrointestinal (GI-ARS) acute radiation syndrome: early hematological changes and systemic inflammatory response syndrome in minipig,”
Int. J. Radiat. Biol., 90
(5), 363
–372
(2014). http://dx.doi.org/10.3109/09553002.2014.892226 Google Scholar
T. B. Elliott et al.,
“Gastrointestinal acute radiation syndrome in Gottingen minipigs (Sus scrofa domestica),”
Comp. Med., 64
(6), 456
–463
(2014). CMEWDR 0147-2917 Google Scholar
M. Goudarzi et al.,
“Quantitative metabolomic analysis of urinary citrulline and calcitroic acid in mice after exposure to various types of ionizing radiation,”
Int. J. Mol. Sci., 17
(5), 782
(2016). http://dx.doi.org/10.3390/ijms17050782 Google Scholar
K. Bujold et al.,
“Citrulline as a biomarker for gastrointestinal-acute radiation syndrome: species differences and experimental condition effects,”
Radiat. Res., 186
(1), 71
–78
(2016). http://dx.doi.org/10.1667/RR14305.1 Google Scholar
J. W. Jones et al.,
“Citrulline as a biomarker in the murine total-body irradiation model: correlation of circulating and tissue citrulline to small intestine epithelial histopathology,”
Health Phys., 109
(5), 452
–465
(2015). http://dx.doi.org/10.1097/HP.0000000000000346 HLTPAO 0017-9078 Google Scholar
Q. Fu et al.,
“The somatostatin analog SOM230 (pasireotide) ameliorates injury of the intestinal mucosa and increases survival after total-body irradiation by inhibiting exocrine pancreatic secretion,”
Radiat. Res., 171
(6), 698
–707
(2009). http://dx.doi.org/10.1667/RR1685.1 RAREAE 0033-7587 Google Scholar
P. Crenn, B. Messing and L. Cynober,
“Citrulline as a biomarker of intestinal failure due to enterocyte mass reduction,”
Clin. Nutr., 27
(3), 328
–339
(2008). http://dx.doi.org/10.1016/j.clnu.2008.02.005 Google Scholar
C. Tuerk and L. Gold,
“Systematic evolution of ligands by exponential enrichment: RNA ligands to bacteriophage T4 DNA polymerase,”
Science, 249
(4968), 505
–510
(1990). http://dx.doi.org/10.1126/science.2200121 SCIEAS 0036-8075 Google Scholar
A. D. Ellington and J. W. Szostak,
“In vitro selection of RNA molecules that bind specific ligands,”
Nature, 346
(6287), 818
–822
(1990). http://dx.doi.org/10.1038/346818a0 Google Scholar
J. F. Lee et al.,
“Aptamer database,”
Nucleic Acids Res., 32
(Suppl. 1), D95
–D100
(2004). http://dx.doi.org/10.1093/nar/gkh094 Google Scholar
C. Srisawat and D. R. Engelke,
“Streptavidin aptamers: affinity tags for the study of RNAs and ribonucleoproteins,”
RNA, 7
(4), 632
–641
(2001). http://dx.doi.org/10.1017/S135583820100245X RNARFU 1355-8382 Google Scholar
J. Ruckman et al.,
“2′-Fluoropyrimidine RNA-based aptamers to the 165-amino acid form of vascular endothelial growth factor (VEGF165) inhibition of receptor binding and VEGF-induced vascular permeability through interactions requiring the exon 7-encoded domain,”
Int. J. Biol. Chem., 273
(32), 20556
–20567
(1998). http://dx.doi.org/10.1074/jbc.273.32.20556 IJRBA3 0020-7616 Google Scholar
S. D. Jayasena,
“Aptamers: an emerging class of molecules that rival antibodies in diagnostics,”
Clin. Chem., 45
(9), 1628
–1650
(1999). Google Scholar
P. L. Sazani, R. Larralde and J. W. Szostak,
“A small aptamer with strong and specific recognition of the triphosphate of ATP,”
J. Am. Chem. Soc., 126
(27), 8370
–8371
(2004). http://dx.doi.org/10.1021/ja049171k JACSAT 0002-7863 Google Scholar
J. R. Babendure, S. R. Adams and R. Y. Tsien,
“Aptamers switch on fluorescence of triphenylmethane dyes,”
J. Am. Chem. Soc., 125
(48), 14716
–14717
(2003). http://dx.doi.org/10.1021/ja037994o JACSAT 0002-7863 Google Scholar
I. Hirao et al.,
“In vitro selection of aptamers that bind to ribosome-inactivating toxins,”
Nucleic Acids Symp. Ser., 37 283
–284
(1996). Google Scholar
J. Liu and Y. Lu,
“Fast colorimetric sensing of adenosine and cocaine based on a general sensor design involving aptamers and nanoparticles,”
Angew. Chem., 118
(1), 96
–100
(2006). http://dx.doi.org/10.1002/(ISSN)1521-3757 ANCEAD 0044-8249 Google Scholar
T. C. Chu et al.,
“Aptamer: toxin conjugates that specifically target prostate tumor cells,”
Cancer Res., 66
(12), 5989
–5992
(2006). http://dx.doi.org/10.1158/0008-5472.CAN-05-4583 CNREA8 0008-5472 Google Scholar
D. P. Wernette,
“Functional-DNA-based nanoscale materials and devices for sensing trace contaminants in water,”
MRS Bull., 33
(1), 34
–41
(2008). http://dx.doi.org/10.1557/mrs2008.12 MRSBEA 0883-7694 Google Scholar
C. B. Swearingen et al.,
“Immobilization of a catalytic DNA molecular beacon on Au for Pb (II) detection,”
Anal. Chem., 77
(2), 442
–448
(2005). http://dx.doi.org/10.1021/ac0401016 ANCHAM 0003-2700 Google Scholar
I.-H. Chang et al.,
“Miniaturized lead sensor based on lead-specific DNAzyme in a nanocapillary interconnected microfluidic device,”
Environ. Sci. Technol., 39
(10), 3756
–3761
(2005). http://dx.doi.org/10.1021/es040505f ESTHAG 0013-936X Google Scholar
J. Wrzesinski and J. Ciesiolka,
“Characterization of structure and metal ions specificity of -binding RNA aptamers,”
Biochemistry, 44
(16), 6257
–6268
(2005). http://dx.doi.org/10.1021/bi047397u Google Scholar
R. Stoltenburg, C. Reinemann and B. Strehlitz,
“SELEX—A (r) evolutionary method to generate high-affinity nucleic acid ligands,”
Biomol. Eng., 24
(4), 381
–403
(2007). http://dx.doi.org/10.1016/j.bioeng.2007.06.001 Google Scholar
M. Famulok,
“Molecular recognition of amino acids by RNA-aptamers: an l-citrulline binding RNA motif and its evolution into an l-arginine binder,”
J. Am. Chem. Soc., 116
(5), 1698
–1706
(1994). http://dx.doi.org/10.1021/ja00084a010 JACSAT 0002-7863 Google Scholar
J. D. Weatherston, N. C. Worstell and H. J. Wu,
“Quantitative surface-enhanced Raman spectroscopy for kinetic analysis of aldol condensation using Ag–Au core–shell nanocubes,”
Analyst, 141
(21), 6051
–6060
(2016). http://dx.doi.org/10.1039/C6AN01098A ANLYAG 0365-4885 Google Scholar
C. H. Moran and Y. Xia,
“Replacement of poly(vinyl pyrrolidone) by thiols: a systematic study of Ag nanocube functionalization by surface-enhanced Raman scattering,”
Phys. Chem., 115 21852
–21857
(2011). http://dx.doi.org/10.1021/jp207868a Google Scholar
Y. Xue et al.,
“Quantifying thiol–gold interactions towards the efficient strength control,”
Nat. Commun., 5 4348
(2014). http://dx.doi.org/10.1038/ncomms5348 Google Scholar
J. A. Martin et al.,
“A method for selecting structure-switching aptamers applied to a colorimetric gold nanoparticle assay,”
J. Visualized Exp., 96 e52545
(2015). http://dx.doi.org/10.3791/52545 Google Scholar
B. Walton et al.,
“Use of a micro- to nanochannel for the characterization of surface-enhanced Raman spectroscopy signals from unique functionalized nanoparticles,”
J. Biomed. Opt., 21
(8), 085006
(2016). http://dx.doi.org/10.1117/1.JBO.21.8.085006 JBOPFO 1083-3668 Google Scholar
N. D. Israelsen, C. Hanson and E. Vargis,
“Nanoparticle properties and synthesis effects on surface-enhanced Raman scattering enhancement factor: an introduction,”
Sci. World J., 2015
(2015), 1
–12
(2015). http://dx.doi.org/10.1155/2015/124582 Google Scholar
H. L. Marks et al.,
“Rational design of a bisphenol A aptamer selective surface-enhanced Raman scattering nanoprobe,”
Anal. Chem., 86
(23), 11614
–11619
(2014). http://dx.doi.org/10.1021/ac502541v Google Scholar
BiographyBrian M. Walton earned his PhD in the Department of Biomedical Engineering at Texas A&M University. His research focus is on developing point-of-care optical biosensors using surface-enhanced Raman spectroscopy. He has presented his research SPIE twice and has been recognized by BMES with an Innovation and Career Development Award. He is also an Alfred P. Sloan Foundation fellow. He earned his bachelor of science in physics from Florida A&M University. George W. Jackson is a founder and CSO of Base Pair Biotechnologies, Inc. He is a recognized leader in the aptamer space having authored 12 peer-reviewed publications on aptamers as well as 30+ posters and conference proceedings. In 2010, he coauthored the first market research report on aptamers. He received his PhD in chemical engineering from University of Houston in 2006 and BS in biomedical engineering from Texas A&M University in 1997. Nicolaas Deutz trained at the University of Amsterdam for his MD and PhD degrees. Presently, he is an endowed professor, director, and founder of the Center for Translational Research in Aging and Longevity at Texas A&M University. His clinical research projects are in older adult patients with reduced skeletal muscle mass and function caused by chronic diseases, such as COPD, cancer, and CHF. He has over 280 publications in impact journals, several patents, and he is the editor-in-chief of the journal Clinical Nutrition. Gerard Cote is the director for the Center for Remote Health Technologies and Systems and holds the Charles H. & Bettye Barclay professorship within the Department of Biomedical Engineering at Texas A&M University. He is recognized as a worldwide expert in optical sensing for diagnostic and biomedical monitoring applications. He is a fellow of four societies, coauthor of over 300 publications, proceedings, patents, and abstracts, and is cofounder of four medical device companies. |