
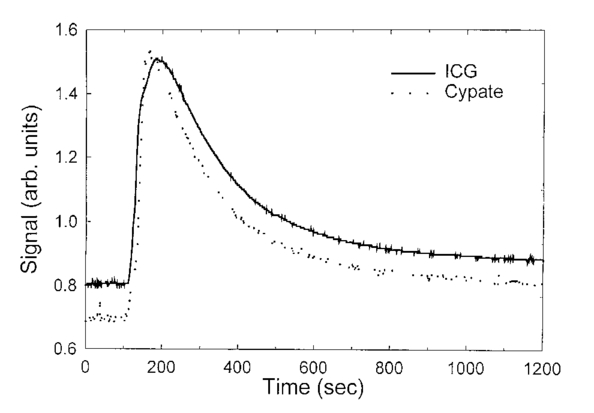
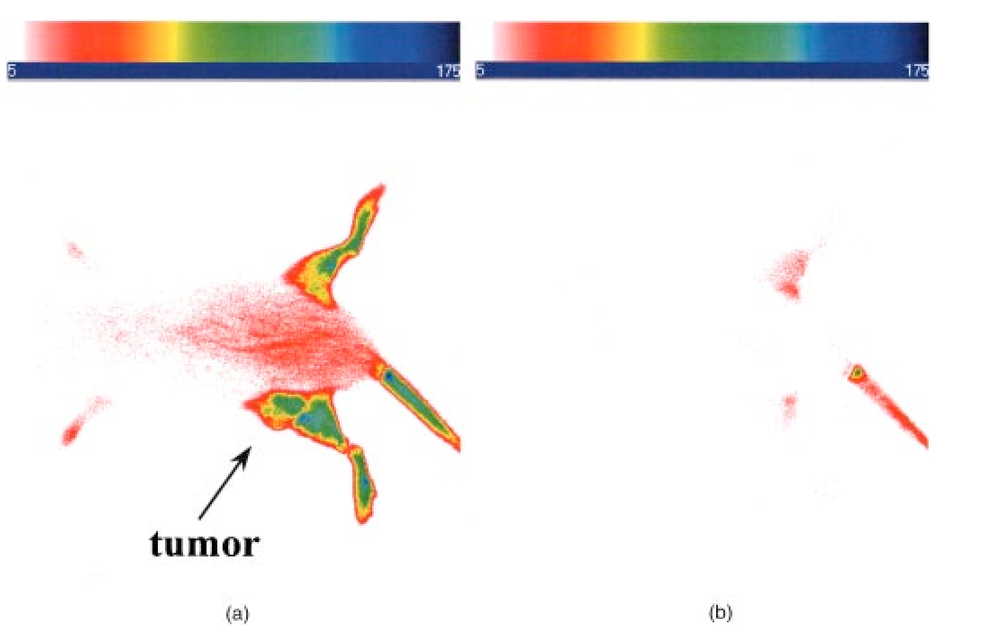
1.IntroductionInterest in the early detection of tumors has increased recently as a result of the increasing number of deaths caused by cancer.1 Common methods for cancer diagnosis rely on the physical detection of a palpable tumor mass or the use of different forms of roentgenography, scintigraphy, ultrasound and magnetic resonance imaging techniques for tissue imaging.2 3 In both cases, the presence of a significant tumor mass is necessary for reliable diagnosis, at which stage patient prognosis may have already been compromised. Recently, optical imaging has been proposed as an alternative tumor detection method with great potential in clinical diagnosis.4 5 6 7 8 Among other advantages over conventional modalities, the optical approach uses neither ionizing radiation nor radioactive materials, and a wealth of information can be extracted from light-tissue interaction in the electromagnetic region of interest.9 10 11 12 13 14 15 16 As in traditional imaging techniques, optical contrast agents designed to enhance the differentiation of normal from abnormal tissues in vivo would result in an increased sensitivity and specificity for tumor detection.17 The ideal properties for optical contrast agents include biocompatibility, high molar absorptivity and fluorescent quantum yield. Furthermore, compounds which absorb or emit in the near infrared (NIR) region of the electromagnetic spectrum are also desirable due to the enhanced tissue penetration of light in this wavelength range.18 19 Localization of dyes in tumors can be mediated by several factors, including leaky vasculature and high metabolic activity in proliferating cells.20 However, tumor targeting by such nonspecific mechanisms may not differentiate inflammation from benign or malignant tumors. In addition, nonspecific contrast agents initially distribute to several organs, hence, require a prolonged waiting period to clear from normal tissues. Advances in tumor biology have shown that many tumors over-express specific receptors that could be used to differentiate them from normal cells.20 21 Therefore, ligands for such receptors can be used as drug delivery vehicles to enhance tumor specificity.22 23 Studies by scintigraphic imaging have demonstrated the feasibility of targeting tumor receptors with antibodies and other large biomolecules.24 25 Adaptation of this approach to optical imaging has been described.26 27 However, such large molecules are preferentially taken up by the liver and can elicit adverse immunogenic reactions in humans.28 Some have very long blood residence times, which prolongs the period required for improved tumor-to-background ratio.29 For solid tumors, which rely on the diffusion of biomarkers from the vasculature, penetration of large dye bioconjugates is not favorable due to the net positive pressure within the tumor.30 Hence, a better method to specifically deliver optical probes to tumors is highly desirable. Recent studies in nuclear medicine have demonstrated that attachment of chelating agents to small molecular peptides can be used to target tumors without loss of receptor affinity of the peptides31 (see Figure 1). This approach has several advantages with respect to either the use of nonspecific agents or the conjugation of probes to large biomolecules. Such advantages include enhanced localization in tumors, rapid clearance from blood, and the possibility of synthesizing a combinatorial library of peptides for rapid identification of bioactive products.20 Our goal in this study was to replace the radiolabeled chelate component of the peptides used in scintigraphy with fluorescent dyes while preserving the receptor affinity of the peptide and the fluorescence of the dye. To this end, we designed and synthesized novel dye-peptide conjugates that are receptor specific. Figure 1Scintigraph of a somatostatin sst 2 receptor-rich CA20948 tumor bearing Lewis rat at 24 h postadministration of the radiolabeled peptide conjugate 111 In-DTPA-Y 3 -Octreotate. Specific retention of this radiolabeled tracer is observed in the sst 2 positive tumor (left flank area), with nonspecific uptake observed in the kidneys. This gamma scintigraph was measured using Picker 300SX gamma camera interfaced to a dedicated Odyssey Image processor. The image was obtained with a large field of view camera fitted with a medium energy collimator, with the peak energies centered at 171 and 245 keV for In-111.  The efficacy of these new fluorescent contrast agents (sometimes referred to in the literature as “molecular beacons,” or “designer fluorophores”) was evaluated in vivo in two well-characterized rat tumor models using a simple continuous wave fluorescence imaging apparatus. These models were chosen because both cell lines have been used extensively in nuclear medicine as in vitro cell binding assay systems and for in vivo tissue biodistribution studies. Several laboratories currently use the CA20948 rat tumor model for in vivo evaluation of novel sst 2 specific compounds. The AR42-J cell line is known to express multiple receptors, and this line has been widely used in cell binding assays and in vivo biodistribution studies in severe combined immunodeficient (SCID) and athymic nude mice. Therefore, both animal models serve as appropriate in vivo systems to demonstrate and establish the concept of receptor-mediateduptake and retention of novel fluorescent dye-peptide conjugates expressed on cell surface tumor lines in vivo. 2.Materials and Methods2.1.Indocyanine GreenIndocyanine green (ICG) was obtained from Sigma (St. Louis, MO), and was used without further purification. The structure of ICG is schematically shown in Figure 2(a). 2.2.Synthesis of Bispropylcarboxymethylindocyanine Dye (Cypate)A mixture of 1,1,2-trimethyl-[1H]-benz[e]indole (9.1 g, 43.58 mmole) and 3-bromopropanoic acid (10.0 g, 65.37 mmoles) in 1,2-dichlorobenzene (40 mL) was heated at 110°C for 12 h. The solution was cooled to room temperature and the residue obtained was filtered and washed with a mixture of acetonitrile:diethyl ether (1:1). The solid obtained was dried under vacuum to give 10 g (64) of light brown powder. A portion of this solid (6.0 g; 16.56 mmole) was added to a mixture of glutaconaldehyde dianil monohydrochloride (2.36 g, 8.28 mmoles) and sodium acetate trihydrate (2.93 g, 21.53 mmoles) in ethanol (150 mL) and the resulting heterogeneous mixture was heated at reflux for 90 min. After evaporating the solvent, the residue was washed with HCl (2M, 4×40 mL) and the green paste obtained was lyophilized in water:acetonitrile (3:2) to give 2 g of dark green flakes. Cypate was obtained in greater than 99 purity as established by 1 H -nuclear magnetic resonance (NMR) and liquid chromatography-mass spectrometry (LC-MS). The structure of cypate is schematically shown in Figure 2(b). 2.3.Synthesis of the Cypate-Octreotate Peptide Conjugate (Cytate)The octapeptide was prepared by an automated fluorenylmethyloxycarbonyl (Fmoc) solid phase peptide synthesis32 using a commercial peptide synthesizer from Applied Biosystems (Model 432A SYNERGY Peptide Synthesizer). The first peptide cartridge contained Wang resin pre-loaded with Fmoc-Thr on a 25 μmole scale. Subsequent cartridges containing Fmoc-protected amino acids were sequentially attached to the resin-bound amino acid. The peptide was synthesized from the C→N terminal using 2-(1H-benzotriazol-1-yl)-1,1,3,3-tetramethyluronium hexafluorophosphate (HBTU)/N-hydroxybenzotriazole as coupling reagent. After the synthesis was complete, the thiol group was cyclized with thallium trifluoroacetate. While still on solid support, the last N-terminal Fmoc group (Phe) was removed and the resin-bound peptide was added to pre-activated cypate (53 mg, 75 mmole; pre-activated with HBTU in dimethyl sulfoxide (DMSO) for 30 min). After 3 h, the peptide was cleaved from the resin and the side chain protecting groups were removed with a mixture of 85 trifluoroacetic acid, 7.5 water, and 7.5 thioanisole. The peptide-dye conjugate was precipitated with cold t -butyl methyl ether and lyophilized in acetonitrile:water (2:3) mixture. The crude product was purified by high performance liquid chromatography (HPLC) to give cytate in 99 HPLC purity. The structure of cytate is schematically shown in Figure 2(c). 2.4.Synthesis of the Cypate-Bombesin Peptide Analogue Conjugate (Cybesin)Cybesin was prepared by the same procedure described for cytate except that cyclization with thallium trifluoroacetate was not needed. Side-chain deprotection and cleavage of the peptide from the resin was carried out with 50 μL each of ethanedithiol, thioanisole and water, and 850 μL of trifluoroacetic acid. HPLC purity was established at greater than 99.5. The structure of cybesin is schematically shown in Figure 2(d). 2.5.Tumor LinesTwo distinct tumor lines were employed in these studies. 2.5.1.Pancreatic Acinar Carcinoma (CA20948) TumorMale Lewis rats (120–140 g) were implanted with the pancreatic acinar tumor by serial implantation of solid material from a donor animal to a recipient animal. This transplantable tumor line has previously been shown to express somatostatin (sst 2 ) receptors, and has been widely used in in vitro and in vivo receptor binding assays.33 34 35 The number of binding sites has been determined at 489 fmol/mg protein.36 Briefly, a tumor is excised aseptically from a donor animal, rinsed with sterile saline and placed in a petri dish containing Gibco media 199. From this tissue, an off-white solid material was obtained, which was further cut into smaller (∼2×2 mm) pieces before placing it in a second petri dish containing media 199. A single tumor piece was then placed into the bevel of a cancer implant needle. The recipient animals were anesthetized with halothane gas, and the left flank prepared by swabbing with povidone solution followed by cleansing with 70 isopropanol. The trocar containing the tumor material was inserted subcutaneously and then advanced to the center of the hind leg region. The material was released using the obdurator, followed by removal of the implant needle. Palpable tumor masses are evident approximately nine days post-implant, and between 13 and 15 days postimplant the tumor masses reach 2–2.5 g at which time they are used in the imaging studies described below. This tumor line has been maintained in vivo by serial implantation for more than 120 generations with no change in receptor expression. 2.5.2.Pancreatic Acinar Carcinoma (AR42-J) TumorThis cell line is derived from exocrine rat pancreatic acinar carcinoma. It can be grown in continuous culture or maintained in vivo in athymic nude mice, SCID mice or in Lewis rats. This cell line is particularly attractive for in vitro receptor assays as it is known to express a variety of hormone receptors including cholecystokinin, epidermal growth factor, pituitary adenylate cyclase activating peptide, somatostatin (sst 2 ) and bombesin.37 In this model, male Lewis rats were implanted with solid tumor material in a similar manner as described for the CA20948 rat model. Palpable masses were present seven days postimplant and imaging studies were conducted on animals at 10–12 days postimplant when the mass had achieved ∼2–2.5 g. This tumor line has been maintained in vivo for more than 20 generations without change in receptor expression. 2.6.Animal Preparation and Dose Administration ProcedureAll studies were conducted in compliance with the Mallinckrodt Animal Welfare Committee’s requirements for the care and use of laboratory animals in research. The animals were anesthetized with rat cocktail (xylazine; ketamine; acepromazine 1.5: 1.5: 0.5) at 0.8 mL/kg via intraperitoneal injection. The area of the tumor (left flank) was shaved to expose the tumor and surrounding surface area, as was the contralateral flank which served as the control. A 21 gauge butterfly infusion set equipped with a stopcock and two syringes containing heparinized saline was placed into the lateral tail vein of the rat. Patency of the vein was checked prior to administration of the agent via the butterfly apparatus. 2.7.Imaging Apparatus and ProcedureA simple noninvasive in vivo continuous wave fluorescence imaging apparatus was employed to assess the efficacy of contrast agents developed for tumor detection in animal models. A schematic of this apparatus is shown in Figure 3. Light from a LaserMax Inc. laser diode of nominal wavelength 780 nm and nominal power of 40 mW was launched into a fiberoptic bundle. A defocusing lens in position after the bundle expanded the beam such that most of the rat was illuminated. The laser power at the output of the bundle was approximately one half of the input power. The detector was a Princeton Instruments model RTE/charge coupled device (CCD)-1317-K/2 CCD camera with a Rodenstock 10 mm F2 lens (stock No. 542.032.002.20) attached. An 830 nm interference lens (CVI Laser Corp. part No. F10-830-4-2) was mounted in front of the CCD input lens such that only emitted fluorescent light from the contrast agent was imaged. Images were acquired and processed using WinView software from Princeton Instruments. An image of the animal was taken pre-administration of contrast agent. Subsequently, images were typically taken at 0.5, 1, 2, 5, 10, 20, 30, 45, 60, and 90 min postadministration of the agent, all performed with the rat in a stationary position. Data analysis consisted of subtracting (pixel by pixel) the pre-administration image from the postadministration images, and displaying the false color results. An approximate 24 h time point was also imaged, however the subtraction of the original background was not performed since the animal had been removed from the sample area and returned at this later time. 3.Results3.1.Clearance of Dyes in Nontumored (Normal) Animals3.1.1.Clearance MonitoringCypate dye, as well as ICG for comparison, was administered to nontumor bearing rats in order to ascertain its intrinsic blood clearance rate before conjugation to the respective peptides. The apparatus which monitors clearance of a fluorescent agent from the bloodstream has been described extensively elsewhere, as have the results employing ICG.13 38 A typical clearance curve for cypate (from a sampling of n=3) is shown in Figure 4, along with a typical result for ICG (from a sampling of n=6) using the same methodology. Cypate has essentially the same rapid and complete clearance profile as ICG. ICG is well known to be cleared from the vasculature by the liver, with more than 90 eliminated within 15 min.39 3.1.2.ImagingTime sequence images pre- and postadministration of a 0.5 mL aqueous solution of ICG (at 5.4 μM concentration) were obtained with the optical imager shown in Figure 3. The entire rat fluoresced at 30 s postadministration (which was the earliest time point image taken), had the highest intensity at about 1 min postadministration, and was subsequently followed by a rapid loss of fluorescence with time. A small amount of residual fluorescence was seen after 1 h postadministration, in accordance with previous studies involving ICG clearance monitoring.13 Typical images from an n=4 study are shown in Figure 5 at 1 and 60 min post dye administration. Figure 5Time sequence fluorescent images of ICG in a normal (nontumor bearing) rat at (a) 1 min postadministration, and (b) 60 min postadministration. A 0.5 mL bolus intravenous administration of an aqueous solution of ICG (at 5.4 μM concentration) was dosed. Rat was in prone position.  Time sequence images pre- and postadministration of 0.5 mL aqueous solution of cypate of concentration 0.5 mg/mL were also obtained (images not shown). Once again, the entire rat again fluoresced at 30 s postadministration, had the highest intensity at about 1 min postadministration, and was subsequently followed by a rapid loss of fluorescence with time. A small amount of residual fluorescence was seen after 1 h postadministration. Thus, cypate blood clearance is very similar to that of ICG, in accordance with the nonimaging clearance monitoring study described above. 3.2.Clearance and Uptake of Dyes in CA20948 Tumor-Bearing AnimalsICG, and its derivatized analog cypate, were administered to CA20948 tumor bearing rats in order to ascertain tumor uptake and retention of each dye independent of conjugation to the targeting peptide. 3.2.1.ICGTime sequence images pre- and postadministration of a 0.5 mL aqueous solution of ICG (at 5.4 μM concentration) were obtained, and typical images from an n=4 study at 1 and 60 min postadministration are displayed in Figure 6. The entire rat fluoresced at 30 s postadministration, reached the highest intensity at approximately 1 min postadministration, and was subsequently followed by a rapid loss of fluorescence. The tumor also fluoresced at 30 s postadministration, reached the highest intensity at approximately 1 min postadministration, and was subsequently followed by a rapid loss of fluorescence. Thus, ICG does not bind to, does not leak into, nor localize in this somatostatin receptor-rich tumor tissue. A small amount of total body residual fluorescence is seen after 1 h postadministration, in accordance with the results from normal rats. 3.2.2.CypateTime sequence images pre- and postadministration of 0.5 mL aqueous solution of cypate (at 5.2 μM concentration) were obtained, and typical images from an n=4 study at 1 and 60 min postadministration are displayed in Figure 7. The entire rat fluoresced at 30 s postadministration, reached the highest intensity at approximately 1 min postadministration, and was subsequently followed by a rapid loss of fluorescence. The tumor also fluoresced at 30 s postadministration, reached the highest intensity at approximately 1 min postadministration, and was subsequently followed by a rapid loss of fluorescence. Thus, cypate also does not bind to, does not leak into, nor localize in this somatostatin receptor-rich tumor tissue. A small amount of total body residual fluorescence is seen after 1 h postadministration, in accordance with the results from normal rats. 3.3.Clearance and Uptake of Dyes in AR42-J Tumor-Bearing Animals3.3.1.ICGTime sequence images pre- and postadministration of a 0.5 mL aqueous solution of ICG (at 5.4 μM concentration) were obtained, and typical images from a n=2 study at 1 and 60 min postadministration are displayed in Figure 8. The entire rat fluoresced at 30 s postadministration (which was the earliest time point image taken), achieved the highest intensity near 1 min postadministration, which then dissipated rapidly. The tumor also fluoresced at 30 s postadministration, achieved the highest intensity near 1 min postadministration, then dissipated rapidly. Thus, ICG does not bind to, does not leak into, nor localize in this bombesin receptor-rich tumor tissue. A small amount of total body residual fluorescence was seen after 1 h postadministration, in accordance with the results from normal rats. 3.3.2.CypateTime sequence images pre- and postadministration of a 0.5 mL aqueous solution of cypate (at 5.2 μM concentration) were obtained, and typical images from a n=2 study at 1 and 60 min postadministration are displayed in Figure 9. The entire rat fluoresced at 30 s postadministration (which was the earliest time point image taken), had the highest intensity near 1 min postadministration, then faded rapidly. The tumor also fluoresced at 30 s postadministration, had the highest intensity near 1 min postadministration, then faded rapidly. Thus, cypate also does not bind to, does not leak into, nor localize in this bombesin receptor-rich tumor. A small amount of total body residual fluorescence is seen after 1 h postadministration, in accord with the results from normal rats. 3.4.Uptake of the Dye-Peptide Conjugates in Tumor-Bearing AnimalsFluorescence serial time sequence images of the tumor bearing rats were typically followed for 90 min postadministration. The rats were returned to their cages, and then subsequently re-imaged at approximately 24 h postadministration. After this image, the rat was sacrificed, and the internal organs were imaged ex vivo to observe the biodistribution of the fluorescence. 3.4.1.Cytate in CA20948 Tumor-Bearing AnimalsTime sequence images pre- and postadministration of a 0.5 mL aqueous solution of cytate (at 6.0 μM concentration) were obtained. Typical early time point images from a n=6 study at 1 and 45 min postadministration are displayed in Figure 10. The fluorescence at 1 min postadministration is evident, although not as intense as with the cypate dye alone. Accumulation of the fluorescent conjugate in the tumor was clearly evident at 45 min postadministration. Figure 10Time sequence fluorescent images of cytate in a CA20948 tumor-bearing rat (a) 1 min postadministration, and (b) at 45 min postadministration. A 0.5 mL bolus intravenous administration of an aqueous solution of cytate (at 6.0 μM concentration) was dosed. Rat was in prone position.  A typical image from the above study obtained at approximately 24 h postadministration is shown in Figure 11. Preferential localization and retention of the dye-peptide conjugate in the tumor was readily observed. At this time point, the vast majority of this compound had been eliminated from all other tissues, with only a residual fluorescence still observed within the rat. Figure 11Fluorescent image of cytate in a CA20948 tumor bearing rat at 27 h postadministration. Cytate is well localized in the tumor. 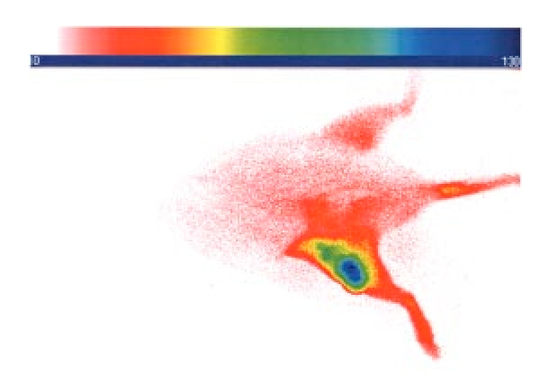 A fluorescence map of several ex vivo organs and tissues from the above study is shown in Figure 12. The somatostatin receptor-rich tissues of the tumor, pancreas and the adrenal glands, indicate specific localization of the fluorescent label. Residual uptake of compound in the liver, due presumably to the dye component, was evident. A rough estimate of the average pixel intensity within a tissue was employed to construct the tumor-to-normal tissue ratios listed in Table 1 for this CA20948 tumor line. Average values from a n=3 sampling are given. Table 1
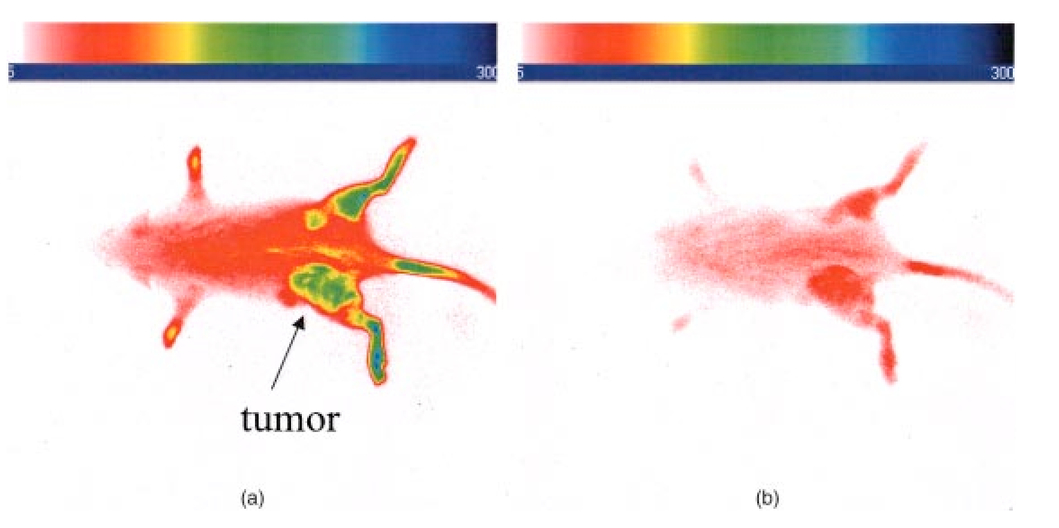
3.4.2.Cybesin in AR42-J Tumor-Bearing AnimalsTime sequence images pre- and postadministration of a 0.5 mL aqueous solution of cybesin (at 6.0 μM concentration) were obtained. Typical early time point images from a n=3 study at 1 and 60 min postadministration are displayed in Figure 13. The fluorescence at 1 min postadministration pervades the entire body of the rat. Accumulation of fluorescence at the tumor site on the left flank is evident as early as 1 min postadministration. The position of this particular tumor apparently inhibits free capillary flow in the left leg, and some of the compound is trapped there for a prolonged time. At 60 min postadministration the difference between the tumored left flank and the contralateral nontumored flank is easily distinguishable. Figure 13Time sequence fluorescent images of cybesin in an AR42-J tumor bearing rat (a) 1 min postadministration, and (b) at 60 min postadministration. A 0.5 mL bolus intravenous administration of an aqueous solution of cybesin (at 6.0 μM concentration) was dosed. Rat was in prone position. 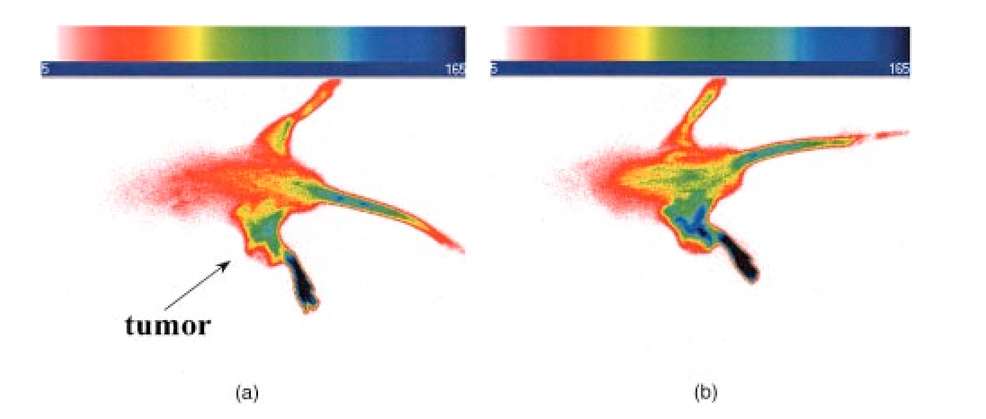 Figure 14 is an image of the 22 h time point postadministration. Localization and retention of the dye-peptide conjugate in the tumor is readily observed. The compound has mainly been eliminated from all other tissues, although a small residual fluorescence is still seen to emanate from the remainder of the rat. The agent previously trapped in the left leg has been eliminated. Figure 14Fluorescent image of cybesin in an AR42-J tumor bearing rat at 22 h postadministration. Cybesin is localized in the tumor.  A fluorescence map of several ex vivo organs and tissues is shown in Figure 15. The bombesin receptor-rich tumor is highly fluorescent with respect to the muscle and heart tissues, which are barely distinguishable from the background. Uptake of the compound by the liver, due presumably to the dye component, was observed. The two bombesin positive tissues, pancreas and tumor, indicate receptor mediated specific uptake and retention. Again, a rough estimate of the average pixel intensity within a tissue was employed to construct the tumor-to-normal tissue ratios listed in Table 1 for this AR42-J tumor line. Average values from a n=3 sampling are given. 4.DiscussionICG is well known to be cleared from the vasculature by the liver, with subsequent excretion through the large intestine. The rapid rate of clearance is illustrated by two different experiments in Figures 4 and 5. Figures 6 and 8 definitively show that ICG is neither tumor selective for the pancreatic acinar tumor line CA20948 nor the pancreatic acinar tumor line AR42-J. Coupled with our previously published observation that ICG does accumulate in the DSL6/A rat pancreatic tumor model, and in the Dunning R3327H prostate tumor model40 41 (both presumably due to a leaky vasculature system in the tumor), we conclude that there is no specific mechanism of action for this dye to localize in tumors. Although previous reports in the literature suggest a mechanism of active preferential uptake of ICG in tumors,42 our findings based on repeated experiments in several tumor lines demonstrate that ICG uptake in tumors is not a universal phenomenon. Therefore, use of ICG for tumor differentiation may be expected to result in many false positives and false negatives, and thus its use would not be reliable for general clinical prognosis in tumor detection. Figures 7 and 9 definitively show that cypate is not tumor selective for either rat pancreatic acinar tumor lines CA20948 or AR42-J. Thus, the dye alone (not conjugated to the peptide) does not accumulate in tumor tissue. This observation is the negative control for our hypothesis that only the dye-peptide conjugates are receptor specific, and the dye alone (either ICG or cypate) is not. The CA20948 tumor is known to over express the sst 2 receptor. Fortunately, several somatostatin peptide analogues have been demonstrated by gamma scintigraphy to target the sst 2 receptor.43 Indeed, a commercial nuclear medicine diagnostic product based on targeting the somatostatin tumor receptor, OctreoScan®, is currently used for the detection of neuroendocrine tumors.31 Thus, a logical step would be the conjugation of dyes to biomarkers that have high affinity for this receptor. However, the active targeting component of this imaging agent is a small eight-amino acid peptide, and it was not known whether the attachment of a large dye molecule to an analogue of this peptide would decrease the affinity of the peptide for the receptor. In addition, the transformation of cyanine dyes, such as ICG, for peptide conjugation is difficult, generally requiring harsh reaction conditions which may contribute to the attenuation of both dye and peptide properties. Consequently, we evaluated the feasibility of using small peptide-dye conjugates in tumor detection by optical imaging. This approach required the synthesis of functionalizable dyes for the attachment of the peptides. We developed a method to conjugate the dyes to peptides by standard solid phase synthesis, a process that is quite amenable to automated synthesis. Control samples of aqueous solution of cytate continue to retain their high fluorescence intensity even after 18 months of storage at room temperature on an open shelf. Figures 10 and 11 illustrate the accumulation of cytate in vivo in the CA20948 rat tumor and the clearance of the compound from the nontarget tissues. The quality of the optical image at 27 h is very similar to that of a scintigraph employing a radiolabeled peptide analog.44 Comparison of Figure 11 with Figure 7 leads to the conclusion that the receptor targeting moiety of cytate retains affinity for the receptor, and the dye retains its fluorescence. Thus, the images confirm that cytate is a receptor-specific targeted fluorescent contrast agent. Figure 12 graphically depicts the biodistribution of cytate in several organs and tissues. The tumor-to-muscle ratio, given in Table 1, is approximately an order of magnitude greater than the porphyrin compounds currently employed in photodynamic therapy.45 46 Thus, cytate is a receptor targeted fluorescent contrast agent with a high tumor-to-muscle tissue biodistribution. The corresponding ratios for the pancreas and adrenals are also rather low, as those two organs naturally express the sst 2 receptor and therefore, like the tumor, indicate a greater uptake and retention of the dye-peptide conjugate. In addition, the peptide is metabolized to smaller amino acid fragments in vivo, which are retained within the lysosomal compartment of the renal cells. This metabolic breakdown of the peptide47 results in the persistent localization of the dye-peptide conjugate in the kidneys, and hence the low tumor-to-kidney tissue ratio. Last, the low tumor-to-liver tissue ratio is presumably due to the well-known preferential uptake of the dye by the liver. Ex vivo inspection and further dissection of the tumor tissue revealed that the fluorescence, and hence dye-peptide conjugate, was localized in the viable regions. Necrotic regions of the tumor were essentially devoid of fluorescence. This result is in contrast to the recently reported finding that serum protein-dye compounds yield fluorescence signatures that were “mainly localized in the necrotic regions of the tumors.” 48 Figures 13 and 14 illustrate the accumulation of cybesin in vivo in the AR42-J rat tumor and the clearance of the compound from the nontarget tissues. The quality of the optical image at 22 h is very similar to that of a scintigraph employing the radiolabeled peptide analog.44 Comparison of Figure 14 with Figure 9 leads to the conclusion that the receptor targeting moiety of cybesin retains affinity for the receptor, and the dye retains its fluorescence. Thus, the images confirm that cybesin is a receptor-specific targeted fluorescent contrast agent. Figure 15 graphically depicts the biodistribution of cybesin in several organs and tissues. The tumor-to-muscle ratio, given in Table 1, is also approximately an order of magnitude greater than the porphyrin compounds currently employed in photodynamic therapy.45 46 Thus cybesin is a receptor-targeted fluorescent contrast agent with a high tumor-to-muscle tissue biodistribution. The bombesin receptors on the pancreas, and to a lesser extent on the adrenal glands, are naturally expressed in a lower density with respect to the somatostatin receptors. Thus, this accounts for the higher tumor-to-normal tissue ratio for these two organs in the AR42-J tumor line than in the CA20948 tumor line. The kidney retention is not believed to be the result of specific uptake, but most likely is the result of in vivo metabolism of the parent peptide into smaller fragments that persist within the renal cell lysosomes, as reported in the literature.47 Again, the low tumor-to-liver tissue ratio is presumably due to the well-known preferential uptake of the dye by the liver. Furthermore, ex vivo inspection and further dissection of this tumor tissue revealed that the fluorescence, and hence dye-peptide conjugate, was also localized in the viable regions. 5.SummaryOur results indicate that small peptide-dye conjugates can be efficacious as fluorescent contrast agents for in vivo tumor detection by optical imaging, analogous to what has been demonstrated in nuclear medicine. Both the newly synthesized cytate and cybesin compounds preferentially localized for over 24 h in tumors known to over-express somatostatin and bombesin receptors, respectively, whereas the dye moiety devoid of the receptor targeting peptide was not retained in these two tumor model lines. The tumor-to-muscle fluorescence ratio is approximately an order of magnitude greater in the tumor targeting dye-peptide conjugates reported herein with respect to typical porphyrin-type compounds reported in the literature.46 The images reported herein of fluorescent-glowing tumors provide an unambiguous demonstration of tumor targeting, without resorting to extensive pharmacokinetic data analysis as employed for agents with low targeting efficacy.49 50 A functionalizable carbocyanine dye, with similar photophysical properties and pharmacokinetics as ICG was synthesized. Conjugation of this dye to biomolecules was readily achieved without loss of the relevant photophysical properties for deep tissue penetration of light. The novel synthetic schemes employed yielded compounds of purity on the order of 99 or greater. Thus, ambiguity in the results due to contaminants was eliminated. In addition, new techniques in the art of solid state peptide synthesis were needed and developed in order to attain these levels of purity in the conjugates. The large signals obtained using targeted exogenous contrast agents allowed the use of a simple continuous wave imaging apparatus, with vendor supplied imaging software employed for the measurement and for the output. Neither exotic instrumentation nor extensive data analysis and manipulation with rigorous computer algorithms were needed. REFERENCES
R. T. Greenlee
,
T. Murray
,
S. Bolden
, and
P. A. Wingo
,
“Cancer statistics, 2000,”
CA Cancer J. Clin. , 50 7
–33
(2000). Google Scholar
D. D. Shaw
,
“Contrast media: Directions for the 1990s,”
Invest. Radiol. , 28 S138
–S139
(1993). Google Scholar
M. L. Giger
and
C. A. Pelizzari
,
“Advances in tumor imaging,”
Sci. Am. , 275 110
–112
(1996). Google Scholar
D. A. Benaron
and
D. K. Stevenson
,
“Optical time-of-flight and absorbance imaging of biologic media,”
Science , 259 1463
–1466
(1993). Google Scholar
G. J. Tearney
,
M. E. Brezinski
,
B. E. Bouma
,
S. A. Boppart
,
C. Pitris
,
J. F. Southern
, and
J. G. Fujimoto
,
“In vivo endoscopic optical biopsy with optical coherence tomography,”
Science , 276 2037
–2039
(1997). Google Scholar
B. J. Tromberg
,
O. Coquoz
,
J. B. Fishkin
,
T. Pham
,
E. R. Anderson
,
J. Butler
,
M. Cahn
,
J. D. Gross
,
V. Venugopalan
, and
D. Pham
,
“Non-invasive measurements of breast tissue optical properties using frequency-domain photon migration,”
Philos. Trans. R. Soc. London, Ser. B , 352 661
–668
(1997). Google Scholar
S. Fantini
,
S. A. Walker
,
M. A. Franceschini
,
M. Kaschke
,
P. M. Schlag
, and
K. T. Moesta
,
“Assessment of the size, position, and optical properties of breast tumors in vivo by non-invasive optical methods,”
Appl. Opt. , 37 1982
–1989
(1998). Google Scholar
C. H. Contag
,
S. D. Spilman
,
P. R. Contag
,
M. Oshiro
,
B. Eames
,
P. Dennery
,
D. K. Stevenson
, and
D. A. Benaron
,
“Visualizing gene expression in living mammals using a bioluminescent reporter,”
Photochem. Photobiol. , 66 523
–531
(1997). Google Scholar
J. C. Hebden
and
D. T. Delpy
,
“Diagnostic imaging with light,”
Br. J. Radiol. , 70 S206
–S214
(1997). Google Scholar
R. B. Dorshow
,
J. E. Bugaj
,
B. D. Burleigh
,
J. R. Duncan
,
M. A. Johnson
, and
W. B. Jones
,
“Noninvasive fluorescence detection of hepatic and renal function,”
J. Biomed. Opt. , 3 340
–345
(1998). Google Scholar
B. Chance
,
E. Anday
,
S. Nioka
,
S. Zhou
,
L. Hong
,
K. Worden
,
C. Li
,
T. Murray
,
Y. Ovetsky
,
D. Pidikiti
, and
R. Thomas
,
“A novel method for fast imaging of brain function, non-invasively, with light,”
Opt. Express , 2 411
–423
(1998). Google Scholar
G. A. Wagnieres
,
W. M. Star
, and
B. C. Wilson
,
“In vivo fluorescence spectroscopy and imaging for oncological applications,”
Photochem. Photobiol. , 68 603
–632
(1998). Google Scholar
B. R. Masters
,
“Early development of optical low-coherence reflectometry and some recent biomedical applications,”
J. Biomed. Opt. , 4 236
–247
(1999). Google Scholar
V. M. Runge
,
“Contrast media research,”
Invest. Radiol. , 34 785
–790
(1999). Google Scholar
O. O. Abugo
,
R. Nair
, and
J. R. Lakowicz
,
“Fluorescence properties of rhodamine 800 in whole blood and plasma,”
Anal. Biochem. , 279 142
–150
(2000). Google Scholar
A. Yodh
and
B. Chance
,
“Spectroscopy and imaging with diffusing light,”
Phys. Today , 48 34
–40
(1995). Google Scholar
S. J. Goldsmith
,
“Receptor imaging: Competitive or complementary to antibody imaging?,”
Seminars in Nucl. Med. , 27 85
–93
(1997). Google Scholar
T. Reisine
and
G. I. Bell
,
“Molecular biology of somatostatin receptors,”
Endocrine Rev. , 16 427
–442
(1995). Google Scholar
S. D. Konda
,
M. Aref
,
M. Brechbiel
, and
E. C. Wiener
,
“Development of a tumor-targeting MR contrast agent using the high affinity folate receptor: Work in progress,”
Invest. Radiol. , 35 50
–57
(2000). Google Scholar
E. Unger
,
P. Metzger III
,
E. Krupinski
,
M. Bakker
,
R. Hulett
,
D. Gabaeff
,
J. Mills
,
D. Ihnat
, and
T. McCreery
,
“The use of a thrombus-specific ultrasound contrast agent to detect thrombus in arteriovenous fistulae,”
Invest. Radiol. , 35 86
–89
(2000). Google Scholar
D. J. Buchsbaum
,
“Experimental tumor targeting with radiolabeled ligands,”
Cancer (N.Y.) , 80 2371
–2377
(1997). Google Scholar
T. M. Behr
,
S. Gratz
,
P. M. Markus
,
R. M. Dunn
,
M. Hufner
,
A. Schauer
,
M. Fischer
,
D. L. Munz
,
H. Becker
, and
W. Becker
,
“Anti-carcinoembryonic antigen antibodies versus somatostatin analogs in the detection of metastatic medullary thyroid carcinoma,”
Cancer (N.Y.) , 80 2436
–2457
(1997). Google Scholar
B. Ballou
,
G. W. Fisher
,
A. S. Waggonner
,
D. L. Farkas
,
J. M. Reiland
,
R. Jaffe
,
R. B. Mujumdar
, and
T. R. Hakala
,
“Tumor labeling in vivo using cyanine-conjugated monoclonal antibodies,”
Cancer Immunol. Immunother , 41 257
–263
(1995). Google Scholar
R. Weissleder
,
C.-H. Tung
,
U. Mahmood
, and
A. Bogdanov Jr.
,
“In vivo imaging of tumors with protease-activated near-infrared fluorescent probes,”
Nat. Biotechnol. , 17 375
–378
(1999). Google Scholar
K. Licha
,
A. Becker
,
F. Kratz
, and
W. Semmler
,
“New contrast agents for optical imaging: Acid-cleavable conjugates of cyanine dyes with biomolecules,”
Proc. SPIE , 3600 29
–35
(1999). Google Scholar
R. K. Jain
,
“Barriers to drug delivery in solid tumors,”
Sci. Am. , 271 58
–65
(1994). Google Scholar
D. J. Kwekkeboom
,
E. P. Krenning
,
G. S. Kho
,
W. A. P. Breeman
, and
P. M. Van Hagen
,
“Somatostatin receptor imaging in patients with sarcoidosis,”
Eur. J. Nucl. Med. , 25 1284
–1292
(1998). Google Scholar
J.-C. Reubi
,
U. Horrisberger
,
C. E. Essed
,
J. Jeekel
,
J. G. Klijn
, and
S. W. Lamberts
,
“Absence of somatostatin receptors in human exocrine pancreatic adenocarcinomas,”
Gastroenterology , 95 760
–763
(1988). Google Scholar
C. J. Anderson
,
L. A. Jones
,
L. A. Bass
,
E. L. C. Sherman
,
D. W. McCarthy
,
P. D. Cutler
,
M. V. Lanahan
,
M. E. Cristel
,
J. S. Lewis
, and
S. W. Schwarz
,
“Radiotherapy, toxicity and dosimetry of copper-64-TETA-octreotide in tumor-bearing rats,”
J. Nucl. Med. , 39 1944
–1951
(1998). Google Scholar
M. De Jong
,
W. A. P. Breeman
,
B. F. Bernard
,
E. J. Rolleman
,
L. J. Hofland
,
T. J. Visser
,
B. Setyono-Han
,
W. H. Bakker
,
M. E. van der Pluijm
, and
E. P. Krenning
,
“Evaluation in vitro and in rats of
161Tb-DTPA-octreotide,
a somatostatin analogue with potential for intraoperative scanning and radiotherapy,”
Eur. J. Nucl. Med. , 22 608
–616
(1995). Google Scholar
B. Stolz
,
G. Weckbecker
,
P. M. Smith-Jones
,
R. Albert
,
F. Raulf
, and
C. Bruns
,
“The somatostatin receptor-targeted radiotherapeutic
[90YDOTA-DPhe1,Tyr3]octreotide
(90Y-SMT
487) eradicates experimental rat pancreatic CA 20948 tumors,”
Eur. J. Nucl. Med. , 25 668
–674
(1998). Google Scholar
J.-B. Deitrich
,
“AR4-2J cells: A model to study polypeptide hormone receptors,”
Biosci. Rep. , 16 273
–288
(1996). Google Scholar
R. B. Dorshow
,
J. E. Bugaj
,
S. Achilefu
,
R. Rajagopalan
, and
A. H. Combs
,
“Monitoring physiological function by detection of exogenous contrast agents,”
Proc. SPIE , 3599 2
–8
(1999). Google Scholar
G. Paumgartner
,
P. Probst
,
R. Kraines
, and
C. M. Leevy
,
“Kinetics of indocyanine green removal from the blood,”
Ann. N.Y. Acad. Sci. , 170 134
–147
(1970). Google Scholar
S. Achilefu
,
R. B. Dorshow
,
J. E. Bugaj
, and
R. Rajagopalan
,
“Novel receptor-targeted fluorescent contrast agents for in vivo tumor imaging,”
Invest. Radiol. , 35 479
–485
(2000). Google Scholar
S. Achilefu
,
R. B. Dorshow
,
J. E. Bugaj
, and
R. Rajagopalan
,
“Tumor specific fluorescent contrast agents,”
Proc. SPIE , 3917 80
–86
(2000). Google Scholar
J. S. Reynolds
,
T. L. Troy
,
R. H. Mayer
,
A. B. Thompson
,
D. J. Waters
,
K. K. Cornell
,
P. S. Snyder
, and
E. M. Sevick-Muraca
,
“Imaging of spontaneous canine mammary tumors using fluorescent contrast agents,”
Photochem. Photobiol. , 70 87
–94
(1999). Google Scholar
W. H. Bakker
,
E. P. Krenning
,
W. A. P. Breeman
,
J. W. Koper
,
P. P. Kooij
,
J.-C. Reubi
,
J. G. Klijn
,
T. J. Visser
,
R. Docter
, and
S. W. Lamberts
,
“Receptor scintigraphy with a radioiodinated somatostatin analogue: Radiolabeling, purification, biological activity, and in vivo application in animals,”
J. Nucl. Med. , 31 1501
–1509
(1990). Google Scholar
M. de Jong
,
W. A. P. Breeman
,
W. H. Bakker
,
P. P. M. Kooij
,
B. F. Bernard
,
L. J. Hofland
,
T. J. Visser
,
A. Srinivasan
,
M. A. Schmidt
,
J. L. Erion
,
J. E. Bugaj
,
H. R. Macke
, and
E. P. Krenning
,
“Comparison of
111In
-labeled somatostatin analogues for tumor scintigraphy and radionuclide therapy,”
Cancer Res. , 58 437
–441
(1998). Google Scholar
M. Yeng
,
E. Baranov
,
P. Jiang
,
F.-X. Sun
,
X.-M. Li
,
L. Li
,
S. Hasegawa
,
M. Bouvet
,
M. Al-Tuwaijri
,
T. Chishima
,
H. Shimada
,
A. R. Moossa
,
S. Penman
, and
R. M. Hoffman
,
“Whole-body optical imaging of green fluorescent protein-expressing tumors and metastases,”
Proc. Natl. Acad. Sci. U.S.A. , 97 1206
–1211
(2000). Google Scholar
J. F. Evensen
,
S. Sommer
,
J. Moan
, and
T. Christensen
,
“Tumor-localizing and photosensitizing properties of the main components of hematoporphyrin derivative,”
Cancer Res. , 44 482
–486
(1984). Google Scholar
H. Akizawa
,
Y. Arano
,
T. Uezono
,
M. Ono
,
Y. Fujioka
,
T. Uehara
,
A. Yokoyama
,
K. Akaji
,
Y. Kiso
,
M. Koizumi
, and
H. Saji
,
“Renal metabolism of
111In
-DTPA-D-Phe-Octreotide in vivo,”
Bioconjugate Chem. , 9 662
–670
(1998). Google Scholar
A. Becker
,
B. Riefke
,
B. Ebert
,
U. Sukowski
,
H. Rinneberg
,
W. Semmler
, and
K. Licha
,
“Macromolecular contrast agents for optical imaging of tumors: Comparison of indotricarbocyanine-labeled human serum albumin and transferrin,”
Photochem. Photobiol. , 72 234
–241
(2000). Google Scholar
J. T. H. M. van den Akker
,
O. C. Speelman
,
H. J. van Staveren
,
A. L. Moore
,
T. A. Moore
,
D. Gust
,
W. M. Star
, and
H. J. C. M. Sterenborg
,
“Localisation and accumulation of a new carotenoporphyrin in two primary tumour models,”
J. Photochem. Photobiol., B , 54 108
–115
(2000). Google Scholar
M. Gurfinkel
,
A. B. Thompson
,
W. Ralston
,
T. L. Troy
,
A. L. Moore
,
T. A. Moore
,
J. D. Gust
,
D. Tatman
,
J. S. Reynolds
,
B. Muggenburg
,
K. Nikula
,
R. Pandey
,
R. H. Mayer
,
D. J. Hawrysz
, and
E. M. Sevick-Muraca
,
“Pharmacokinetics of ICG and HPPH-car for the detection of normal and tumor tissue using fluorescence, near-infrared reflectance imaging: A case study,”
Photochem. Photobiol. , 72 94
–102
(2000). Google Scholar
|
|||||||||||||||||||||||||||


CITATIONS
Cited by 163 scholarly publications and 19 patents.
Tumors
Luminescence
Receptors
Tissues
In vivo imaging
Optical imaging
Solids


