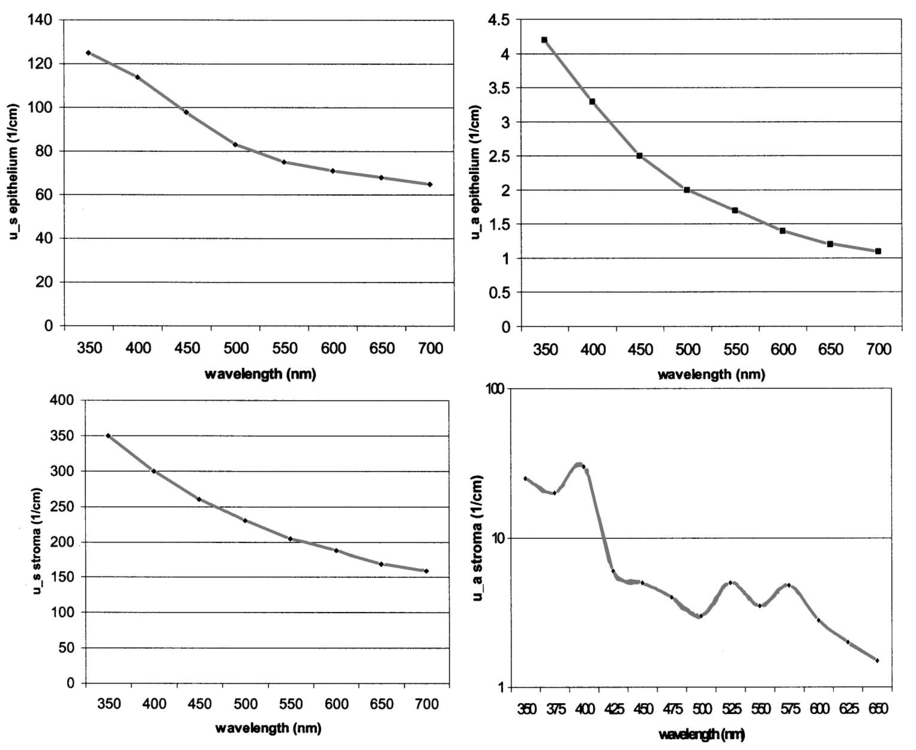
1.IntroductionThe development of screening and detection programs based on the Papanicolau (Pap) smear over the past 50 years has significantly reduced the mortality associated with cervical cancer.1 However, cervical cancer still poses an important health threat today and causes more deaths in women than any other malignancy.2 Women who have an abnormal Pap smear are referred for a diagnostic procedure called colposcopy. Neither the Pap smear nor colposcopy is a perfect test. The Pap smear fails to identify abnormalities at a rate exceeding 40.3 Colposcopy, although quite sensitive in expert hands (94±6), lacks specificity (48±23), and histopathologic analysis of a biopsy is required for final diagnosis.4 In addition to the limited performance of the Pap smear for screening and colposcopy for diagnosis, the current clinical strategy is extremely expensive. Over $6 billion is spent annually in the evaluation and treatment of low-grade lesions,5 suggesting that there is a significant need for new technologies which improve the detection process and reduce costs. During the past decade, fluorescence spectroscopy has shown potential as a new diagnostic tool for the detection of cervical precancers.6 7 8 9 Techniques based on fluorescence spectroscopy can deliver highly sensitive, specific, and cost-effective diagnosis without the removal of tissue. Diagnostic algorithms have been developed that can differentiate normal squamous tissue, normal columnar tissue, low grade squamous intraepithelial lesions (LGSILs), and high grade squamous intraepithelial lesions (HGSILs) based on fluorescence spectra collected in vivo at three excitation wavelengths.7 9 For the discrimination of SILs vs nonSILs, the algorithm performed with a sensitivity of 82 and a specificity of 68 in a blinded 95-patient study conducted in a diagnostic setting.9 Cantor et al.; performed a decision analysis showing that a see-and-treat strategy combining fluorescence spectroscopy and colposcopy would be more effective and less expensive than the current standard of care of colposcopy.10 The study estimated that using fluorescence spectroscopy could save >$625 million annually in the United States. Although there is a large body of empirical evidence which suggests fluorescence spectroscopy can be used to discriminate normal and dysplastic cervical tissue, there has been little work to understand the biological basis of differences in the fluorescence spectra of normal and dysplastic cervical tissue. It is likely that a better understanding of the microscopic origins of spectral differences could lead to development of new strategies for the measurement and analysis of fluorescence spectra, improving the sensitivity and specificity of the technique. In an initial attempt to understand the contribution of various chromophores to cervical spectra, Ramanujam et al.; fit in vivo spectra to a model of turbid tissue fluorescence.11 Potential chromophores contributing to cervical tissue fluorescence were identified from the literature as collagen, elastin, NADH, and FAD. The results of this biochemical analysis indicated that the absolute contribution of collagen fluorescence decreased and the contribution of oxyhemoglobin attenuation increased as tissue progressed from normal to abnormal in a single patient. In addition, the normalized relative contribution of NADH increased as tissue in a single patient progressed from normal to cervical intraepithelial neoplasia. The described study was a significant step towards developing a preliminary understanding of the relationship between tissue biochemical and morphological structure and measured spectral changes associated with dysplasia. Although the results provided some indication regarding the relationship between biochemical changes associated with dysplasia and measured tissue spectra, the model made several approximations not realistic for in vivo tissue. The model assumed: (1) the scattering coefficient was constant over the entire spectral range, (2) attenuation due to absorption and scattering was of exponential form, and (3) fluorphores were distributed homogeneously throughout the tissue.12 In order to produce more accurate results, particularly given the distinct layered structure of cervical tissue, there is a need for a more sophisticated model of light propagation. Monte Carlo methods, which can simulate the random walk of photons through biological tissue, provide a very flexible technique for investigating light propagation. As the theory behind Monte Carlo simulations is well described in the literature, it will not be repeated here. We refer interested readers to the papers by Prahl et al.;13 and Wang, Jacques, and Zheng14 which provide a thorough introduction to the approach. Adaptation of Monte Carlo simulations for fluorescence is a straightforward procedure. A photon is propagated using optical properties at the excitation wavelength. When absorption of the excitation photon generates a fluorescence event, the fluorescence photon is initially released isotropically and then propagated using the optical properties of the emission wavelength. The procedure is repeated for each emission wavelength of interest. In this paper, we follow the method reported by Welch et al.;15 for fluorescence Monte Carlo simulations. Monte Carlo methods have previously been used to model remitted fluorescence from a number of organ sites. Keijzer et al.;16 used a Monte Carlo model to study how autofluorescence of human aorta was impacted by light delivery and collection geometries. Welch et al.;15 also modeled fluorescence of the aorta, focusing on the effects of tissue geometry, quantum yield, and boundary conditions on remitted fluorescence. Zonios et al.;17 developed a model of human colon tissue fluorescence in order to relate spectra measured in a clinical setting to underlying tissue microstructure. Qu et al.;18 developed a similar model for bronchial fluorescence, incorporating measurements of the optical properties of normal and abnormal bronchial tissue, in order to investigate design strategies to mitigate spectral distortions due to scattering and absorption. Finally, Pogue and Hasan19 used a Monte Carlo model to demonstrate how the effects of intrinsic absorption could be diminished by measuring fluorescence from small tissue volumes using confocal detection. In the work described in this paper, the Monte Carlo technique was used to predict fluorescence spectra from human cervical tissue. The intrinsic fluorescence spectra of tissue constituents were obtained from excitation-emission matrices (EEMs) of live cervical cells and collagen gel phantoms. To obtain information about the location of tissue fluorophores as a function of depth, past modeling studies relied on fluorescence imaging of frozen–thawed sections. In this study, we imaged fresh tissue sections rather than frozen–thawed tissue. The use of fresh tissue sections is of vital importance. Oxygenation occurs as frozen tissue thaws prior to microscopic examination, converting any NADH to NAD + which is nonfluorescent. Previous studies of frozen–thawed cervical tissue by Mahadevan20 and Lohmann et al.;21 found little evidence of epithelial fluorescence, while significant epithelial fluorescence, particularly in younger women, was noted by Brookner et al.;22 when imaging fresh tissue. In understanding the biological basis of changes in fluorescence spectra between normal and dysplastic tissue, it is critical that contributions of epithelial fluorescence to measured spectra are considered. To motivate the necessity of a quantitative model of tissue fluorescence, we begin by demonstrating that both patient age and the presence of dysplasia significantly impact the intensity of fluorescence emission spectra at 380 nm excitation as measured in a prior 95-patient in vivo study. Our group has previously shown that the intensity of native NADH and collagen fluorescence is influenced by patient age22 and the presence of dysplasia.23 We believe that changes in NADH and collagen fluorescence largely explain observed differences among normal spectra of women of different ages and between normal and dysplastic tissue spectra. In order to better understand the biological origins of measured tissue fluorescence, we developed a Monte Carlo model of fluorescent light propagation in cervical tissue. The sensitivity of the model was examined to understand how predictions of NADH and collagen contribution were impacted by parameters including patient age, epithelial thickness, and the optical properties of the epithelial and stromal tissue layers. Predictions were most sensitive to patient age and epithelial thickness. After considering the model sensitivity, fluorescence spectra from normal and dysplastic tissue were modeled and compared to spectra measured in vivo at the time of colposcopy. The modeling was used to relate known changes in tissue biochemistry and architecture with dysplasia to clinically observed differences between normal and dysplastic tissue spectra. 2.Methods2.1.EEMs of Cell Suspensions and Collagen GelsThe collection of EEMs of cell suspensions is briefly described here. More complete procedures, including details regarding cell cultures and the preparation before fluorescence measurements, are described in Ref. 22. EEMs were measured from suspensions of a cervical cancer cell line (SiHa) and normal ectocervical cells from primary culture (CrEC-Ec). SiHa cells were obtained from the American Type Culture Collection (ATCC, Rockville, MD); CrEC-Ec cells were obtained from Clonetics. EEMs were measured from 3 ml suspensions in a 1 cm pathlength cuvette, using a scanning Spex Fluorolog II spectrofluorimeter. Excitation wavelengths ranged from 250 to 550 nm in 10 nm increments and emission wavelengths ranged from 10 nm past the excitation wavelength to the lower of 10 nm below twice the excitation wavelength or 700 nm, in 5 nm increments. Prior to and following the collection of each EEM, a cell count and trypan blue viability assay were performed. To permit background signal subtraction, a fluorescence EEM was also measured from the final supernatant for each cell line. Both the SiHa cell line and the normal ectocervical cells were measured on four different days using fresh samples. To prepare the collagen gels, Type I collagen from rat tail tendon (Roche Molecular Biochemicals) was dissolved in sterile 0.2 acetic acid (v/v) to a final concentration of 3 mg/ml. To dissolve lyophilized collagen, acetic acid was added to a bottle with the lyophilisate and the bottle was left overnight at room temperature. To induce gel formation, eight parts of the collagen solution were mixed on ice with one part of sterile 10X PBS and one part of sterile 0.2 M HEPES, pH 7.3. The pH of the final solution was adjusted to 7.4 using 2 M NaOH. Then the mixture was placed in an incubator at 37°C where the gelation process was completed in about 20 min. EEMs were measured on fresh samples of the gels. Data used in this study were the average of data obtained from four separate gel preparations and measurements. For further details on the preparation and measurement of collagen gels, please see the paper by Sokolov et al.;24 Cell and collagen gel data have been corrected for the nonuniform spectral response of the emission monochromator and detector using correction factors supplied with the instrument, and for the wavelength-dependent variations in the excitation intensity using a rhodamine B quantum counter. EEMs were plotted as contour maps, with contour lines connecting points of equal fluorescence intensity. 2.2.Preparation of Fresh Tissue SectionsCervical biopsies were obtained, with written consent, from women seen in the University of Texas MD Anderson Cancer Center Colposcopy Clinic and the Lyndon B. Johnson Hospital (LBJ) Colposcopy Clinic. Biopsies were immediately placed in chilled culture medium (DMEM without phenol red), and were then embedded in 4 agarose for slicing. The Krumdieck tissue slicer (Alabama Research and Development MD1000-A1) was used to obtain 200-μm-thick fresh tissue slices, which were cut perpendicular to the epithelial surface. 2.3.Fluorescence MicroscopyA Zeiss Axiophot 410 inverted fluorescence microscope was used to examine the unstained tissue slices under bright field and fluorescence conditions. Areas with recognizable epithelium and stroma were identified under bright field. Autofluorescence images were collected from these areas at 380 nm excitation, using the 100 W mercury lamp of the microscope and a filter cube (BP380 exciter filter, FT410 dichroic mirror, 420 long pass filter). A more complete description of the acquisition of fluorescence images and the quantification of acquired images is provided in Ref. 22. Following fluorescence microscopy, tissue slices were fixed in 10 formalin, embedded in paraffin, and 4 μm sections were made for histological evaluation. A standard hematoxylin and eosin (H&E) protocol was used to stain sections from each tissue slice. Stained sections were used to correlate fluorescent areas to histological features of the tissue. H&E slides were read by pathologists with expertise in gynecologic pathology to provide a diagnosis of the particular tissue imaged (I.B., A.M.). 2.4.In Vivo EEMs of Cervical TissueIn vivo EEMs were collected for nine patients enrolled in the fresh tissue slice study. These patients had been referred to the colposcopy clinic at MD Anderson Cancer Center in Houston, TX. The instrumentation used to obtain the EEMs has been previously described in detail.25 Briefly, emission spectra were acquired at 18 excitation wavelengths, ranging from 330 to 500 nm, at 10 nm increments with a spectral resolution of 7 nm. The system used to measure the spectra consists of a fiberoptic probe, a xenon arc lamp coupled to a monochromator to provide excitation light, and a polychromator and cooled charged-coupled device to record emission spectra. After measuring EEMs from a patient, biopsies were obtained from the same sites as the EEM measurements, and tissue slices were prepared from the biopsies as described above. Data were corrected for the nonuniform spectral response of the detection system and for variations in the intensity of fluorescence light at different excitation wavelengths. In addition, a rhodamine calibration standard was used as a positive control. 2.5.Monte Carlo Model: Tissue Geometry and Intrinsic FluorescenceThe cervix was modeled as two infinitely wide layers or slabs, the first representing the cervical epithelium and the second representing the stroma. Each layer was assumed to contain a homogeneous distribution of fluorophores, absorbers, and scatterers. In the simulations described in this paper, it was assumed that all of the fluorescence arising from the epithelial layer was due to NADH and all of the fluorescence generated in the stromal layer was due to collagen. The shape of the intrinsic fluorescence spectra for the epithelial and stromal layers was determined from the emission spectra of cervical cells and collagen gels. Average spectra at 380 nm excitation were calculated from the measured cell and collagen EEMs. These average spectra were used as input to the model. Simulations indicated that the choice of cell type did not significantly impact the results of the simulations since both SiHa and normal cells contain the same fluorophores. The simulations shown in this paper use the spectral data from the normal ectocervical cells. While the line shapes of the intrinsic fluorophores were obtained from the emission spectra extracted from the EEMs, the magnitude of the fluorescence intensity of the epithelial layer relative to the stromal layer at 450 nm was obtained from the fluorescence microscopy measurements of fresh cervical tissue samples. The model was used only to consider relative contributions of the two layers to obtained spectra and not to predict the absolute magnitude of remitted fluorescent light. 2.6.Monte Carlo AlgorithmAll simulations presented in this paper involved 380 nm excitation light. The algorithm used is briefly described. For further detail, see the paper by Welch et al.;15 A fixed weight (single photon) Monte Carlo technique was used. Photons were initially propagated using optical properties for the excitation wavelength. When a fluorescence photon was created, the photon was released isotropically. The photon was then propagated using optical properties for the emission wavelength. A separate Monte Carlo simulation was run for each emission wavelength of interest. Total remitted fluorescence was obtained by summing all photons at the emission wavelength that crossed the top surface of the tissue. The program was developed for use either to predict total remitted fluorescence, in which case a narrow excitation ray normal to the slab was used, or to simulate realistic fiberoptic delivery and collection geometries, consisting of multiple fibers of variable diameter and numerical aperture and a quartz shield of adjustable thickness. To verify the accuracy of the Monte Carlo code, the multilayer fluorescence simulations described in Ref. 15 were replicated. See Tables 1 and 2 of Ref. 15 for optical properties and Table 3 of Ref. 15 for results. Results obtained were within 0.5 of those reported by Ref. 15. It is critical to ensure that the Monte Carlo method is developed in such a way that changes in absorption due to nonfluorescence tissue constituents do not bias the generation of fluorescence. Only the fraction of absorbed excitation photons contributed by the fluorophores, not the entirety of the absorbed excitation light, should be considered as energy available for fluorescence conversion. In practice, the probability that an absorbed excitation photon is converted to a fluorescent photon must be weighted by an additional factor which accounts for the ratio of the fluorophore absorption coefficient to the bulk tissue absorption coefficient at the excitation wavelength. To test that this weighting was correctly implemented in the Monte Carlo model, simulation results were compared to analytic solutions for a nonscattering, semi-infinite tissue with homogeneous fluorophore distribution and a quantum yield of one as the absorption coefficient due to nonfluorescing compounds was modulated, holding all other variables constant. 3.Results3.1.In Vivo Cervical Tissue FluorescenceFigure 1(a) shows mean normal and abnormal spectra, at 380 nm excitation, measured in the 95-patient in vivo study by Ramanujam et al.; The error bars show the variability in the measured fluorescence spectra. Throughout this paper, error bars show two standard deviations. Details regarding instrument design and data collection for this study are found in Refs. 7 8 9. In this paper, normal tissue includes tissue classified as negative for dysplasia upon histopathologic analysis. Abnormal tissue includes both LGSILs and HGSILs. Note that the intensity of fluorescence is significantly lower in abnormal tissue. Figure 1(b) shows mean normal spectra as a function of patient age. This graph demonstrates that the intensity of remitted fluorescence is strongly a function of patient age, with fluorescence intensity increasing with patient age. Together, these graphs show that both patient age and the presence of dysplasia significantly impact the magnitude of remitted fluorescence. Thus, in order to most fully understand the biologic basis of measured cervical fluorescence, it is important to consider both of these parameters. 3.2.EEMs of Cervical Tissue ConstituentsFigure 2 shows representative EEMs of cell suspensions and collagen gels. The EEM shown in Figure 2(a) is from a suspension of normal ectocervical cells. The fluorescence EEMs of both types of cervical cells showed three major peaks, which were consistent with the fluorophores tryptophan, NADH, and FAD. In all cases, the most intense peak was seen at 290 nm excitation, corresponding to tryptophan. Two other peaks were located at 350–370 nm excitation and 430–450 nm excitation, corresponding to NADH and FAD, respectively. Figure 2(b) shows a representative EEM of a collagen gel, showing a peak located at 360–370 nm excitation. A second peak, consistent with tyrosine fluorescence, is also apparent in the collagen gel EEM at 270 nm excitation. For a more thorough discussion of the fluorescence of collagen gels, the reader is referred to the paper by Sokolov et al.;24 3.3.Correlated EEMs and Fluorescence ImagesTo visually demonstrate the influence of age on cervical tissue fluorescence, Figure 3 shows representative fluorescence images of fresh tissue sections and corresponding EEMs from a young, pre-menopausal woman and an older, postmenopausal woman. Figure 3(a) shows the EEM and fluorescence images from a 25-year-old patient. The fluorescence images show bright epithelial fluorescence and weaker fluorescence in the deeper epithelial layers and the stroma. The corresponding EEM shows fluorescence consistent with collagen, NADH and FAD, and clear peaks corresponding to NADH and FAD. In the fluorescence images shown in Figure 3(b), from a 55-year-old woman, there is bright stromal fluorescence but little epithelial fluorescence. The corresponding fluorescence EEM shows a peak corresponding to collagen. Note that the elongated, broad fluorescence seen in the EEM of the older patient in Figure 3(b) is similar to the pattern observed for the collagen gel in Figure 2(b), whereas the shape of the EEM of the younger patient, shown in Figure 3(a), is more similar to the EEM of the cervical cell suspension shown in Figure 2(a). In Figures 3(a) and 3(b), H&E images for the corresponding tissue slice data and measured EEM are also shown. 3.4.Tissue Optical PropertiesProperties discussed in this section are base line optical properties used in the Monte Carlo model. The effect of varying these properties on the modeling results is discussed in the next section. For the base line case, the thickness of the normal epithelium was 350 μm. Note that this thickness can vary significantly with patient age and disease state. The stroma was modeled as a semi-infinite layer. Optical properties were based on a combination of references in the literature.18 26 27 28 29 Figure 4 shows the base line properties for the absorption and scattering coefficients of the epithelial and stromal layers which were used in the modeling. An index of refraction of n=1.4 was used for both tissue layers. Anisotropy factor, g, was set to 0.95 for the epithelial layer, a value slightly higher than measurements of epithelium by Qu et al.;27 and slightly lower than measurements by Mourant et al.; for cell suspensions.30 An anisotropy factor of g=0.89 was used for the stromal layer, based on values reported for tissue in Ref. 26. Because simulations suggested small variations in g did not significantly impact results and the wavelength-dependent trends of g are not well established, g was not varied with wavelength. 3.5.Model SensitivityThe Monte Carlo was developed, incorporating line shapes from EEMs similar to those shown in Figure 3 along with data concerning the intrinsic fluorescence intensity of the epithelial and stromal layers obtained from images of the fluorescence of fresh tissue sections. As discussed previously, a primary motivation for the model development was to provide a means to explore the relative contributions of NADH and collagen to measured spectra under various conditions. Thus, before using the model to predict complete emission spectra, we investigated the sensitivity of the model to variations in model input by calculating the percent of remitted fluorescence due to NADH photons for a range of optical properties and different epithelial thicknesses. Data at 450 nm emission, a wavelength near the peak emission intensity for 380 nm excitation light, are shown in Figure 5. In particular, we wanted to examine how collected NADH and collagen fluorescence was affected by patient age. For this reason, all results in Figure 5 are shown for three groups of women of progressively increased age labeled as group I, group II, and group III. Only the relative quantum yields of the epithelial and stromal layers were varied to simulate the fluorescence emission at 450 nm for women in groups I, II, and III. The data used as model input for these groups of women are taken from the study described in Ref. 22. Briefly, women in group I displayed strong epithelial and weak stromal fluorescence. Women in group II exhibited both epithelial and stromal fluorescence, and women in group III displayed weak epithelial and strong stromal fluorescence. The mean ages of women in group I, group II, and group III were 31, 38, and 49, respectively. For each graph shown in Figure 5, the feature (optical property or epithelial thickness) plotted on the horizontal axis was varied while all other parameters in the simulations were held constant. The horizontal axis of the graph shows the optical property value at 450 nm. The data demonstrate how variations in patient age, epithelial thickness, epithelial absorption coefficient, epithelial scattering coefficient, and stromal scattering coefficient influence model predictions. Note that patient age and epithelial thickness impact the predictions the most and that assuming all of the fluorescence is due only to NADH and collagen, collagen contributes more strongly than NADH to remitted fluorescence. Varying the value of g of each layer between 0.88 and 0.95 was also assessed. This had little impact on the model predictions (data not shown). Figure 5Influence of perturbation of optical properties on model predictions. Graphs show the fraction of remitted fluorescence due to NADH (at 380 nm excitation, 450 nm emission) as a function of optical properties and patient age. Remitted fluorescence is assumed to consist only of NADH and collagen contributions. The mean ages of women in Group I, Group II, and Group III are 31, 38, and 49 years, respectively. 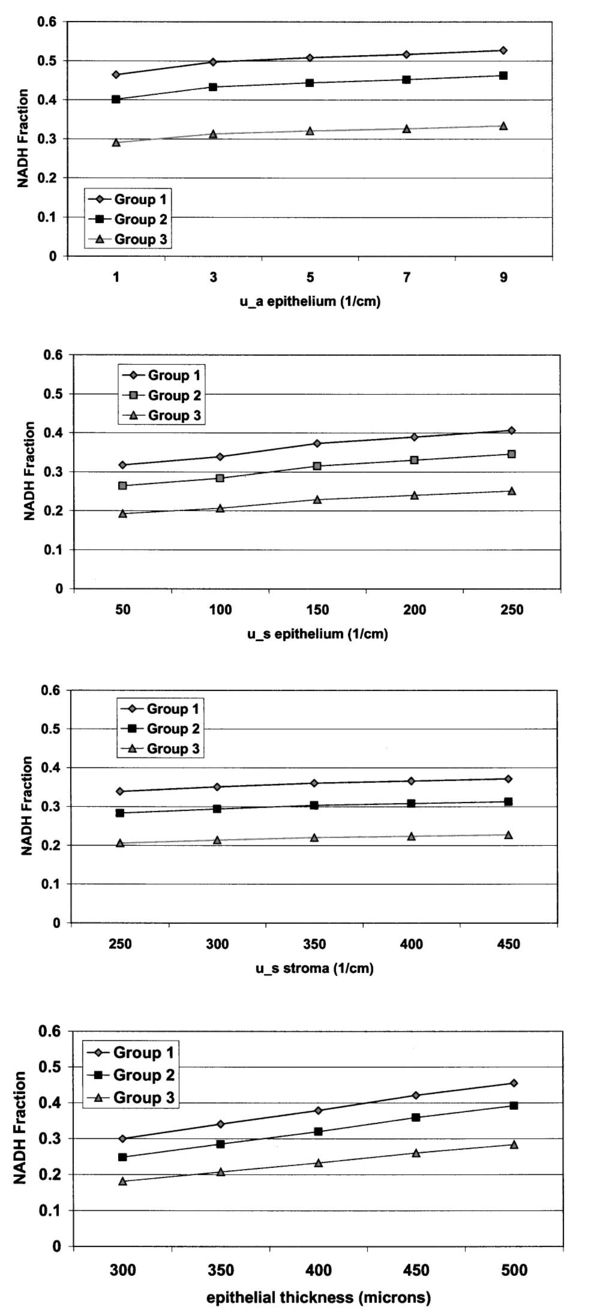 3.6.Modeled SpectraCervical tissue spectra were modeled for normal and dysplastic tissue using data from the EEMs of cervical cells and collagen as well as the tissue slice experiments. Predicted and measured spectra from normal and dysplastic (LGSIL/HGSIL) tissue are compared in Figure 6. The measured emission spectra come from the 95-patient in vivo study of human cervical tissue. Two pairs of curves are shown in this figure. In the first pair [Figure 6(a)], the only difference between the modeled normal and dysplastic case is the magnitude of fluorescence arising from the epithelial and stromal layers. Mean fluorescence intensity of the epithelial layer, in linear, arbitrary units was 85±30 in normal tissue and 106±39 in abnormal tissue. Mean fluorescence intensity of the stromal layer was 151±44 in normal tissue and 102±34 in dysplastic tissue.23 Note that these data are from a study of paired normal and abnormal biopsies described in Ref. 23, and are not the same data set used in the previous section (Figure 5). Those data were based on the study described in Ref. 22 and involved only normal women. The modeled normal data shown in Figure 6(a) are scaled to the value of the measured normal data at 475 nm emission. This same scaling factor was then applied to the SIL data such that the relative magnitude of the normal and dysplastic spectra is predicted rather than the absolute magnitude of each curve. Error bars represent predicted variability in the modeled spectra based on uncertainties in the measurements of intrinsic fluorescence. Although error bars are large, they are consistent with measured data which can vary an order of magnitude patient to patient. Figure 6Comparison of measured and modeled spectra. (a) In these modeled curves only the relative intensity of epithelial and stromal fluorescence is altered between the normal and SIL case. (b) In these curves, in addition to changes in epithelial and stromal fluorescence intensity, the thickness of the epithelial layer and the stromal absorption coefficient are increased. (c) Predicted remitted fluorescence due to NADH for modeled spectra shown in (a). (d) Predicted remitted fluorescence due to NADH for modeled spectra shown in (b).  Epithelial thickening occurs with dysplasia. In addition, microvessel density increases,31 32 33 altering the stromal absorption coefficient. These effects are particularly prominent in HGSILs. The measured spectra used to obtain the mean SIL curve plotted in Figure 6(a) consisted of approximately 41 LGSILs and 59 HGSILs. The modeled data in Figure 6(a) are based only on changes in intrinsic fluorescence with dysplasia and does not reflect changes in thickness and stromal absorption most prominent in HGSILs. Figure 6(b) shows a mean modeled spectrum obtained from a weighted average of modeled LGSIL and HGSIL fluorescence spectra based on the prevalence of LGSIL and HGSIL diagnoses in the measured data. LGSIL spectra were modeled as described previously. To model the HGSIL data, the epithelial thickness was increased to 500 μm and the stromal absorption coefficient was increased by 50. For both pairs of curves shown in Figure 6, there is relatively good agreement between measured and modeled data. Making the assumption that epithelial fluorescence is dominated by NADH and stromal fluorescence is dominated by collagen, the percentage of remitted fluorescence due to NADH was calculated as a function of wavelength for both cases. As shown in Figure 6(c) [data corresponding to Figure 6(a)] and Figure 6(d) [data corresponding to Figure 6(b)], the model predicts approximately 20 of remitted fluorescence is due to NADH in mean normal spectra while 30–50 is due to NADH in abnormal spectra. Although the magnitude of the NADH contribution is increased in abnormal spectra, the overall fluorescence intensity of the abnormal spectra is decreased because of a significant reduction in intrinsic collagen fluorescence and increased hemoglobin absorption. 4.DiscussionThere are a number of questions which must be addressed in assessing the reliability of models designed to predict the intensity of fluorescence remitted from a tissue. First, is there sufficient understanding of the tissue fluorophores? It is necessary to understand, if not the fluorophores’ identities, at least their spatial distribution, relative quantum yields, and intrinsic fluorescence spectra. Next, are the optical properties of the tissue understood? The magnitude of the individual properties (n, μa, μs, and g of each layer) and the relationships between properties significantly influence model predictions. In addition, it is necessary to know how the pathological process in question impacts all of the fluorophores and optical properties. What are the implications of dividing what is in reality a continuum of changes into the discrete cate gories of normal and diseased? Finally, are there other variables, perhaps biographical in nature (for instance, patient age, race, or menopausal status), perhaps introduced in the measurement process (changes in probe pressure or application of a chemical agent to the tissue prior to measurements) which could alter fluorescence intensity, possibly even more significantly than the disease process under investigation? Given an imperfect understanding of all of the variables addressed above, modeling can still be used to provide important insight into interpretation of measured fluorescence spectra, providing a link between clinical spectra and underlying tissue biochemistry, morphology, and architecture. The most significant conclusions from the modeling studies discussed in this paper are briefly summarized here and then discussed in detail: (1) The model accurately predicts the shape as well as the relative intensity of normal and dysplastic tissue spectra, providing an indication of how NADH and collagen contributions add together in normal and abnormal tissue. In both normal and dysplastic tissue, most of the remitted fluorescence is due to collagen rather than NADH. Collagen accounts for approximately 70–80 of the total fluorescence signal in normal tissue and 60–70 of measured fluorescence in dysplastic tissue. (2) Given the present understanding of tissue optical properties, a primary explanation for clinically observed decreases in fluorescence intensity with dysplasia is the reduction in intrinsic collagen fluorescence in dysplastic tissue. Increased hemoglobin absorption adds to this effect, but we believe this may be a secondary factor, particularly for low grade lesions. (3) Despite observed decreases in fluorescence intensity with dysplasia, NADH fluorescence increases with dysplasia. (4) To understand the biological basis of an individual patient’s spectra, the patient’s age should be taken into account. (5) Finally, because NADH fluorescence increases with dysplasia while collagen fluorescence decreases, differences between normal and dysplastic cervical tissue may be amplified by new fiberoptic probe designs which interrogate epithelial and stromal tissue separately. Perhaps the most fundamental question the modeling studies could answer was whether measurements of the microscopic fluorescence properties of normal and dysplastic cervical tissue, when combined with tissue scattering and absorption effects, produced spectra consistent with those observed clinically. In fact, predicted spectra demonstrate relatively good agreement with measured spectra in both spectral shape and the relative intensities of normal and dysplastic spectra. A unique feature of the work described in this paper was the use of quantitative fluorescence microscopy of fresh tissue sections rather than frozen–thawed tissue. The fresh tissue sections display significant epithelial fluorescence, varying in intensity with patient age and the presence of dysplasia. Previous work presumed the epithelial fluorescence contribution was negligible. Explaining the measured decreases in fluorescence intensity between normal and dysplastic tissue becomes more difficult when the epithelial layer contributes significantly to remitted fluorescence, and the contribution increases with dysplasia. The modeling suggests that the primary reason for decreased fluorescence intensity in dysplastic tissue is a reduction in intrinsic collagen fluorescence. The decreased contribution from collagen is far greater than the increased contribution from NADH. In general, the collagen contributes more heavily to measured fluorescence emission despite the location of NADH in the epithelium, typically at least several hundred μm thick in normal women, and the location of collagen in the underlying stroma. In the modeling shown in Figure 6(a), only differences in intrinsic fluorescence were considered. An obvious concern is whether significant changes in tissue optical properties occur with dysplasia. Angiogenesis is known to accompany dysplasia, leading to progressively increased microvessel density.31 32 33 However, the epithelium thickens with dysplasia and because of the increased thickness, light may not travel as deeply into the vascular stroma. It is possible epithelial thickening may make it more difficult to detect changes in absorption related to angiogenesis. In fact, photon migration studies measured decreased absorption coefficients of cervical tissue with dysplasia, and this decrease was attributed to increased epithelial thickness.28 Both epithelial thickness and changes in absorption due to hemoglobin are likely to be highly variable from patient to patient. The numbers used for the simulations described in Figure 6, in which increased epithelial thickness and stromal absorption are considered, are not meant as exact descriptions of the mean changes associated with dysplasia. Optical properties, in particular regarding changes in absorption coefficient with dysplasia, are not yet fully understood. In the modeling shown in Figure 6(b), the stromal absorption coefficient was elevated to a level which likely overestimates the impact of angiogenesis as microvessel density has been measured to increase approximately 33–70 depending on the severity of dysplasia.31 32 33 After increasing the stromal absorption, the resultant spectrum [Figure 6(b)] is changed only slightly from the spectrum shown in Figure 6(a), suggesting that measured decreases in fluorescence intensity with dysplasia at 380 nm excitation may be impacted more strongly by decreases in collagen fluorescence than increased hemoglobin absorption. It should be emphasized that the modeling in this paper involves 380 nm excitation. At other common excitation wavelengths, for instance, 337 nm, the influence of hemoglobin is far greater as hemoglobin absorption peaks are located in close proximity to the fluorescence emission peaks of endogenous fluorophores. At 380 nm excitation, hemoglobin absorption predominantly affects the two ends of the emission spectra and causes a small redshift in peak location. It is also important to recognize that patient age may play a strong role in how dramatically hemoglobin absorption distorts the fluorescence spectra. As exemplified by the EEMs shown in Figure 2, the effects of hemoglobin absorption are readily apparent in the EEM from the postmenopausal woman but not in the EEM of the young woman. This is because light may more easily penetrate the stroma of older patients due to the thin, atrophic epithelium of postmenopausal women.34 The strong influence of patient age on spectra cannot be ignored. If not appropriately addressed, age may be a confounding factor in analysis of cervical tissue spectra because some changes related to age are similar to changes observed with the presence of dysplasia. Older women have a thinner epithelium than younger women, and normal women have a thinner epithelium than women with dysplasia.34 Older women have decreased epithelial fluorescence relative to younger women,22 and normal women have decreased epithelial fluorescence relative to women with dysplasia.23 Older women have increased stromal fluorescence relative to younger women,22 and normal women have increased stromal fluorescence relative to women with dysplasia.23 Because of the parallels between older patients and normal patients and between younger patients and patients with dysplasia, it is important to develop algorithms which do not misclassify patients because of their age. Our group has developed a multivariate statistical algorithm for the diagnosis of cervical dysplasia based on fluorescence spectra acquired at 337, 380, and 460 nm excitation.7 8 The performance of this algorithm maintains the sensitivity of current detection methods while significantly improving specificity. In examining the false negatives and false positives produced by the algorithm, the distribution of patient ages in the misclassified spectra is similar to the overall age distribution of women enrolled in the study, suggesting that, although patient age affects the intensity of raw spectra, age does not significantly impact the algorithm performance. One explanation for the success of the algorithm regardless of patient age is that data are preprocessed by normalization and mean scaling to reduce interpatient variability. Although there was not enough data in the 95-patient study to stratify the data by age, we believe that stratifying spectra by patient age may provide a strategy by which it is possible to retain absolute intensity information, yielding even further improvements to an algorithm which already significantly outperforms the current standard of care. It is likely that algorithms for spectral discrimination of normal and diseased tissue in other organ sites, for instance, the breast, could also be improved by considering patient age during algorithm development. A final implication of the studies described in this paper is the potential advantage to considering fiberoptic geometries which separately probe epithelial and stromal fluorescence. This type of probe could be achieved by collecting light from two different source detector separations. A model such as the one described in this paper could be used to achieve optimized fiberoptic design. Separately probing epithelial and stromal fluorescence would offer the advantage of two distinct diagnostic indicators: NADH fluorescence which increases with dysplasia and collagen fluorescence which decreases with dysplasia. In probe designs which interrogate large tissue volumes comprised of both epithelial and stromal tissue, the NADH signal may serve more to reduce the magnitude of the intensity difference between normal and dysplastic spectra than to provide potentially critical information about tissue metabolic status. In summary, modeling fluorescence spectra is a complicated process influenced by many variables which we do not yet fully understand. The Monte Carlo approach is valuable in that it provides a method for predicting how a number of fluorophores located at arbitrary depths within the tissue, in combination with tissue scattering and absorption properties, combine to yield measured spectra. The model used in the paper provides insight into how increased epithelial fluorescence and decreased stromal fluorescence, combined with epithelial thickening and increased vascularity, can predict the shape of measured spectra as well as the relative magnitude of the change in fluorescence intensity observed between normal and dysplastic tissue. The paper also demonstrates that patient age significantly impacts both the overall intensity of measured spectra as well as the relative contributions of epithelial and stromal fluorescence to cervical spectra. As more in vivo work is undertaken to further characterize cervical tissue optical properties, the methodology developed in this paper will provide an increasingly important tool for understanding the biological basis of tissue fluorescence. AcknowledgmentsThe authors thank Andrea Edwards for her help in conducting the Monte Carlo simulations. The authors gratefully acknowledge support from NIH Grant No. RO1 CA72650 and NCI Grant No. PO1-CA82710. REFERENCES
L. G. Koss
,
“The Papanicolau test for cervical cancer detection: A triumph and a tragedy,”
J. Am. Med. Assoc. , 261 737
–743
(1989). Google Scholar
M. F. Mitchell
,
W. N. Hittelman
,
W. K. Hong
, and
D. Schottenfeld
,
“The natural history of cervical intraepithelial neoplasia: An argument for intermediate endpoint biomarkers,”
Cancer Epidemiol. Biomarkers Prev. , 3 619
–626
(1994). Google Scholar
M. T. Fahey
,
L. Irwig
, and
P. Macaskill
,
“Meta-analysis of Pap test accuracy,”
Am. J. Epidemiol. , 141 680
–689
(1995). Google Scholar
M. F. Mitchell
,
“The accuracy of colposcopy,”
Clin. Consult. Obst. Gynecol. , 6 70
–73
(1994). Google Scholar
R. J. Kurman
,
D. E. Henson
,
A. L. Herbst
,
K. L. Noller
, and
M. H. Schiffman
,
“Interim guidelines for management of abnormal cervical cytology,”
J. Am. Med. Assoc. , 271 1866
–1869
(1994). Google Scholar
A. Mahadevan
,
M. F. Mitchell
,
E. Silve
,
S. Thomsen
, and
R. R. Richards-Kortum
,
“Study of the fluorescence properties of normal and neoplastic human cervical tissue,”
Lasers Surg. Med. , 13 647
–665
(1993). Google Scholar
N. Ramanujam
,
M. F. Mitchell
,
A. Mahadevan
,
S. Thomsen
,
A. Malpica
,
T. Wright
,
N. Atkinson
, and
R. Richards-Kortum
,
“Development of a multivariate statistical algorithm to analyze human cervical tissue fluorescence spectra acquired in vivo,”
Lasers Surg. Med. , 19 46
–62
(1996). Google Scholar
N. Ramanujam
,
M. F. Mitchell
,
A. Mahadevan
,
S. Thomsen
,
A. Malpica
,
T. Wright
,
N. Atkinson
, and
R. Richards-Kortum
,
“Spectroscopic diagnosis of cervical intraepithelial neoplasia (CIN) in vivo using laser induced fluorescence spectra at multiple excitation wavelengths,”
Lasers Surg. Med. , 19 63
–74
(1996). Google Scholar
N. Ramanujam
,
M. F. Mitchell
,
A. Mahadevan-Jansen
,
S. Thomsen
,
G. Staerkel
,
A. Malpica
,
T. Wright
,
N. Atkinson
, and
R. Richards-Kortum
,
“Cervical precancer detection using multivariate statistical algorithm based on laser-induced fluorescence spectra at multiple excitation wavelengths,”
Photochem. Photobiol. , 64 720
–735
(1996). Google Scholar
S. Cantor
,
M. Follen
,
G. Tortolero-Luna
,
C. Bratka
,
D. Bodurka
, and
R. Richards-Kortum
,
“Cost-effectiveness analysis of diagnosis and management of cervical squamous intraepithelial lesions,”
Obstet. Gynecol. (N.Y.) , 91 270
–277
(1998). Google Scholar
N. Ramanujam
,
F. Mitchell
,
A. Mahadevan
,
S. Warren
,
S. Thomsen
,
E. Silva
, and
R. Richards-Kortum
,
“In vivo diagnosis of cervical intraepithelial neoplasia using 337 nm excited laser-induced fluorescence,”
Proc. Natl. Acad. Sci. U.S.A. , 91 10193
–10197
(1994). Google Scholar
S. A. Prahl
,
M. Keijzer
,
S. L. Jacques
, and
A. J. Welch
,
“A Monte Carlo model of light propagation in tissue,”
Proc. SPIE , 5 102
–111
(1989). Google Scholar
L. H. Wang
,
S. L. Jacques
, and
L. Zheng
,
“MCML: Monte Carlo modeling of photon propagation in multi-layered tissues,”
Comput. Methods Programs Biomed. , 47 131
–146
(1995). Google Scholar
A. J. Welch
,
C. Gardner
,
R. Richards-Kortum
,
E. Chan
,
G. Criswell
,
J. Pfefer
, and
S. Warren
,
“Propagation of fluorescent light,”
Lasers Surg. Med. , 21 166
–178
(1997). Google Scholar
M. R. Keijzer
,
R. Richards-Kortum
,
S. L. Jacques
, and
M. S. Feld
,
“Fluorescence spectroscopy of turbid media: Autofluorescence of the human aorta,”
Appl. Opt. , 28 4286
–4292
(1989). Google Scholar
G. Zonios
,
R. Cothren
,
J. Arendt
,
J. Wu
,
J. Van Dam
,
J. Crawford
,
R. Manoharan
, and
M. Feld
,
“Morphological model of human colon tissue fluorescence,”
IEEE Trans. Biomed. Eng. , 43 113
–122
(1996). Google Scholar
J. Qu
,
C. MacAuluay
,
S. Lam
, and
B. Palcic
,
“Laser-induced fluorescence spectroscopy at endoscopy: Tissue optics, Monte Carlo modeling, and in vivo measurements,”
Opt. Eng. , 34 3334
–3343
(1995). Google Scholar
B. Pogue
and
T. Hasan
,
“Fluorophore quantitation in tissue-simulating media with confocal detection,”
IEEE J. Sel. Top. Quantum Electron. , 2 959
–964
(1996). Google Scholar
W. Lohmann
,
J. Musmann
,
C. Lohmann
, and
W. Kunzel
,
“Native fluorescence of the cervix uteri as a marker for dysplasia and invasive carcinoma,”
Eur. J. Obstet. Gynecol. Reprod. Biol. , 31 249
–253
(1989). Google Scholar
C. K. Brookner
,
M. Follen
,
I. Boio
,
J. Galvan
,
S. Thomsen
,
A. Malpica
,
S. Suzuki
,
R. Lotan
, and
R. Richards-Kortum
,
“Autofluorescence patterns in short-term cultures of normal cervical tissue,”
Photochem. Photobiol. , 71
(6), 730
–736
(2000). Google Scholar
A. Zuluaga
,
U. Utzinger
,
A. Durkin
,
H. Fuchs
,
A. Gillenwater
,
R. Jacob
,
B. Kemp
,
J. Fan
, and
R. Richards-Kortum
,
“Fluorescence excitation emission matrices of human tissue: A system for in vivo measurement and method of data analysis,”
Appl. Spectrosc. , 53 302
–311
(1999). Google Scholar
J. Qu
,
C. MacAulay
,
S. Lam
, and
B. Palcic
,
“Optical properties of normal and carcinomatous bronchial tissue,”
Appl. Opt. , 33
(31), 7397
–7405
(1994). Google Scholar
R. Hornung
,
T. H. Pham
,
K. A. Keefe
,
M. W. Berns
,
Y. Tadir
, and
B. J. Tromberg
,
“Quantitative near-infrared spectroscopy of cervical dysplasia in vivo,”
Hum. Reprod. , 14 2908
–2916
(1999). Google Scholar
W. G. Zijlstra
,
A. Buursma
, and
Meeuswen-van der Roest
,
“Absorption spectra of human fetal and adult oxyhemoglobin, de-oxyhemoglobin, carboxyhemoglobin, and methehemoglobin,”
Clin. Chem. , 37
(9), 1633
–1638
(1991). Google Scholar
J. Mourant
,
J. Freyer
,
A. Hielscher
,
A. Eick
,
D. Shen
, and
T. Johnson
,
“Mechanisms of light scattering from biological cells relevant to noninvasive optical-tissue diagnostics,”
Appl. Opt. , 37 3586
–3593
(1998). Google Scholar
S. P. Dobbs
,
P. W. Hewett
,
I. R. Johnson
,
J. Carmichael
, and
J. C. Murray
,
“Angiogenesis is associated with vascular endothelial growth factor expression in cervical intraepithelial neoplasia,”
Br. J. Cancer , 76
(11), 1410
–1415
(1997). Google Scholar
A. Dellas
,
H. Moch
,
E. Schultheiss
,
G. Feichter
,
A. C. Almendral
,
F. Gudat
, and
J. Torhorst
,
“Angiogenesis in cervical neoplasia: Microvessel quantitation in precancerous lesions and invasive carcinomas with clinicopathological correlations,”
Gynecol. Oncol. , 67
(1), 27
–33
(1997). Google Scholar
A. Obermair
,
D. Bancher-Todesca
,
S. Bilgi
,
A. Kaider
,
P. Kohlberger
,
S. Mullauer-Ertl
,
S. Leodolter
, and
G. Gitsch
,
“Correlation of vascular endothelial growth factor expression and microvessel density,”
J. Natl. Cancer Inst. , 89
(16), 1212
–1217
(1997). Google Scholar
|


CITATIONS
Cited by 277 scholarly publications and 4 patents.
Luminescence
Tissues
Collagen
Monte Carlo methods
Absorption
Data modeling
Optical properties


