1.IntroductionOptical imaging through biologic tissue is a subject of much interest due to the advantage of imaging with nonionizing radiation. The limiting factors of optical imaging, namely, resolution and contrast, can be improved through the discrimination and rejection of highly scattered diffuse photons from unscattered and weakly scattered ballistic photons. Recently, there has been considerable interest in using the polarization state of light as the discrimination criterion.1 2 3 4 In general, such techniques are based on the assumption that weakly scattered light retains its initial polarization whereas highly scattered light does not.5 6 The number of scattering events over which light retains its initial polarization depends on a variety of factors, including the incident polarization state, the size and shape of the scatterers, the concentration of scatterers, and the refractive indices of the scatterers and the surrounding medium.6 7 Past work with tissue phantoms that consisted of dilute suspensions of microspheres in water has demonstrated (1) different polarization states can be depolarized differently by a given set of scatterers,5 6 and (2) how the different states are depolarized depends strongly on the size and density of the scatterers.7 8 Past work with tissue, however, has been less complete. Most studies of tissue have typically concentrated on the loss of linear polarization,1 3 6 8 while speculating that in tissue, circular polarization may give different results.1 6 In order to evaluate the potential of polarization as a discrimination criterion for biomedical applications, either alone or combined with other discrimination techniques, a better understanding of polarized light propagation in biological tissue is needed. In this paper, we compare the loss of linear and circular polarizations for five different tissues. The effects of birefringence, found in many native tissues, are also explored. Section 2 begins with a theoretical and experimental description of the setup. Section 3 contains the results of experiments performed with linearly and circularly polarized light incident on blood, adipose tissue (fat), tendon, artery, and myocardium taken from an animal. In Sec. 4, a discussion of the results is presented. 2.Materials and Methods2.1.Stokes Vector MeasurementThe degree of polarization was measured in each sample using Stokes vectors to describe the polarization content of light exiting the sample (Figure 1). A HeNe laser (Melles Griot Inc., 05LHP925) emitting a collimated 1.5 mm 1/e2 diam beam of 632.8 nm radiation was passed through a chopper operating at 2.73 kHz (Stanford Research Systems, SR540), a linear polarizer (Melles Griot Inc., 03FPG009) and into the sample. For circularly polarized light incident on the sample, a quarter-wave plate (Meadowlark Optics, NQM-100-633) was inserted between the polarizer and the sample. The light source, polarization optics, and tissue constituted the sample section of the system. Light emerging from the sample was collected with a 55 mm focal length, f/2.8 camera lens and passed through subsequent polarizing optics. An iris in the camera lens rejected light scattered beyond a full angle of 22.6°. The light collected first passed through a variable-wave plate (VWP) (Meadowlark Optics, LRC-100) oriented 45° to the horizontal, whose retardance, Δ, was controlled by a voltage input. The light exiting the VWP then passed through a photoelastic modulator (PEM) (Hinds Instruments, PEM-90) oriented at 0° followed by a linear polarizer (LP) (Melles Griot Inc., 03FPG009) oriented at 45°. The PEM is a wave plate whose retardance, δ=δ0 cos(ωt), modulated between ±δ0 at a frequency ω=2π (50 kHz), thus providing the reference signal for lock-in detection. The collection optics, VWP, PEM, and LP, constituted the analysis section of the system. All signal components were measured with a ±15 V photoconductive detector (Hinds Instruments, DET-90-002) and a lock-in amplifier (Stanford Research Systems, SR810). Figure 1Experimental setup consisting of a HeNe laser, a chopper operating at 2.78 kHz, polarizing elements for the light incident on the sample, a variable-wave plate, a photoelastic modulator operating at 50 kHz, a linear polarizer, a photodetector and a lock-in amplifier. The degree of polarization with no sample present was 1.0001.  A Stokes vector, S, contains four elements that completely describe the polarization state of the light: I is the total intensity, Q and U describe the linearly polarized components, and V describes the circularly polarized component of the light collected. The individual elements of a Stokes vector that describe the light exiting the sample, defined as S sample , can be isolated from the signal measured using Mueller calculus to model the system. Each element in the analysis section of the system can be represented as a 4×4 Mueller matrix. The light incident on the analysis section is simply S sample . By multiplying S sample with each matrix element in the system, the polarization properties of the light incident on the detector can be described in terms of another Stokes vector, S detector . The Mueller calculus for the system is where the individual matrices for the VWP, PEM, and LP are taken from the literature.9 10 The first element in S detector , I detector , is the total light intensity measured by the photodetector and is where Δ and δ=δ0 cos(ωt) were defined earlier as the retardances of the VWP and PEM, respectively. Equation (2) can be simplified to isolate the individual elements of S sample , (i.e., Q sample , U sample , and V sample ) by setting the VWP retardance to Δ=0° and 90° [Eqs. (3) and (4), respectively], The Bessel function expansions for cos[δ0 cos(ωt)] and sin[δ0 cos(ωt)] can be used to simplify Eqs. (3) and (4) further: where J0, J1, J2,…, are Bessel functions of the zeroth, first, second, etc. order. To simplify signal analysis, δ0 was set to 138°; thus, J0(δ0)=0. When Δ was set to 0°, U sample could be measured by demodulating the detected signal at 2ω and V sample could be measured by demodulating at 1ω. Similarly, when Δ was set to 90°, U sample could be measured by demodulating at 2ω and Q sample could be measured by demodulating at 1ω. I sample was measured by demodulating at the chopper frequency.From each Stokes vector, the degree of linear polarization, pL, circular polarization, pC, and total polarization, pT, were calculated as and The sensitivity of this system is 10−5.2.2.Biologic SamplesSeveral tissues were investigated in this study: porcine blood, fat, tendon, artery, and myocardium. Tissue was obtained from freshly sacrificed 12-month-old slaughterhouse pigs and used within 48 h of postmortem. Prior to experimentation, the tendon, artery, and myocardium samples were wrapped in room-temperature phosphate-buffered saline (PBS)-soaked towels and stored at 5 °C. The samples were warmed to room temperature 2 h before each experiment. Coagulation of whole blood was prevented by the addition of sodium citrate to the fluid within 1 h of postmortem. For each experiment, a volume of whole blood was placed in a glass cuvette with pathlength ranging from 0.1 to 5 mm. Fat was taken from the abdominal cavity. For each experiment, a section of fat with a measured thickness ranging from 0.15 to 2.94 mm was mounted between glass slides. Tendon was dissected from the hindlimb. For each experiment, a sample of tendon with a measured thickness ranging from 0.067 to 1.21 mm was mounted between glass slides with the long axis of the tendon’s collagenous fibers oriented vertically. Arterial tissue was taken from the carotid arteries and aortas. For each experiment, a section of vessel was sliced along its long axis and then splayed open; the measured thickness of the vessel wall ranged from 0.27 to 1.76 mm. The samples were mounted in PBS between glass slides. The artery samples were mounted such that the circumferentially oriented fibers of the vessel were lying horizontal (i.e., 90°) to the incident linearly polarized light. The light was incident on the endothelial surface. Myocardial tissue was dissected from the apical side of the left ventricle. Fibers in the ventricular myocardium are oriented predominantly along two orthogonal axes; the myocardium was oriented such that the incident linearly polarized light was parallel to one of these axes. For each experiment, a section of tissue with a measured thickness ranging from 0.61 to 2.9 mm was excised and mounted in PBS between glass slides. 3.ResultsThe degree of linear and circular polarization for forward scattered light was measured for each of the tissues. Blood and adipose tissue were used to study polarized light propagation through nonbirefringent tissues that contained dilute and dense quasispherical scatterers, respectively. Tendon, artery, and myocardium were used to investigate the effects on polarized light propagation of birefringence arising from unidirectional (tendon and artery) and bidirectional (myocardium) fibers. The degree of polarization was measured versus cuvette pathlength (blood) and tissue thickness (remaining tissues). Each reported value is an average of three measurements, each performed on a unique sample. The error bars represent the standard deviation in the measurements. Points with nonvisible error bars have errors that are smaller than the symbol. Note that the data are reported on a semilog scale, which allows a better display of the data but sometimes hides the large differences between the degrees of linear versus circular polarization data. 3.1.Nonbirefringent TissuesBlood was used to investigate polarized light propagation through the simplest case scatterers: dilute, near-spherical structures. Blood is a fluid tissue that consists of various cells: biconcave, disk-like, anuclear erythrocytes (∼7 μm in diameter), spherical leukocytes (8–18 μm in diameter), and biconvex disk-like platelets (2–4 μm in diameter) that float freely and are generally separated from one another by plasma.11 12 Normally, blood has ∼10 times as many erythrocytes than platelets, and ∼30 times as many platelets as leukocytes. The degree of polarization in whole blood is shown as a function of the cuvette pathlength in Figure 2. An analysis based upon calculation of the t statistic for the difference between the degree of polarization for linear versus circularly polarized light indicates a statistically significant difference at the p=0.01 level for all cuvette pathlengths except for t=0.02 mm. Figure 2Degree of linear and circular polarization in whole porcine blood as a function of the cuvette pathlength. Each point is an average of three measurements. The error bars represent the standard deviation; points with nonvisible error bars have errors that are smaller than the symbol. 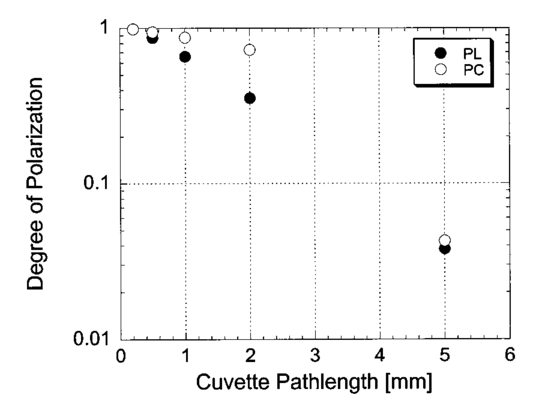 Polarized light scattering by densely packed spheres was studied using adipose tissue. White adipose tissue consists of closely packed unilocular fat cells, each containing a single lipid droplet. The lipid droplet nearly fills the entire cell, causing the cytoplasm and nucleus to become eccentrically placed. Fat cells range in size from small fat cells having a diameter of only a few microns to mature fat cells having a diameter of 50–75 μm. The dominant scatterers in fat cells are likely to be much smaller, perhaps the size of individual lipid droplet (0.5–1.5 μm in diameter) or subcellular organelles.11 12 The measured degree of polarization as a function of the tissue thickness is shown in Figure 3. An analysis based upon calculation of the t statistic for the difference between the degree of polarization for linear versus circularly polarized light indicates a statistically significant difference at the p=0.01 level for all tissue thicknesses except for t=0.01, 0.03, 0.06, and 0.09 mm. Figure 3Degree of linear and circular polarization in porcine adipose tissue as a function of the tissue thickness. Each point is an average of three measurements. The error bars represent the standard deviation; points with nonvisible error bars have errors that are smaller than the symbol. Measurements are reported as a function of tissue thickness in order to provide physical intuition as to how light depolarizes in thin vs thick tissues.  3.2.Birefringent TissuesThe effects of tissue birefringence on polarized light propagation were first studied using porcine tendon. Tendon consists mostly of thick, parallel, densely packed collagen fibers. Interspersed between the parallel bundles of collagen fibers are long, elliptical fibroblasts. A fine elastic mesh connects different collagen bundles. In general, tendon fibers are cylindrical in shape with diameters ranging from 20 to 400 nm.12 13 14 The ordered structure of the collagen fibers running parallel to a single axis makes tendon a highly birefringent tissue. Changes to the incident polarization state in such a sample can thus be due to tissue birefringence as well as to scattering depolarization. However, birefringence only changes the incident polarization state; it does not depolarize the light. The effect of tendon birefringence on the propagation of linearly polarized light is dependent on the angle between the incident polarization orientation and the tendon axis. The effect of tendon birefringence on the propagation of circularly polarized light, on the other hand, is not angle dependent since circularly polarized light has no preferential direction of orientation. Thus, any existing sample birefringence can be nulled out of the measurements of pL by orienting the sample axis 0° or 90° to the incident linear polarization axis but cannot easily be nulled out of the measurement of pC. By knowing the Mueller matrix that quantifies the tissue birefringence, it would be possible to null out the birefringence effects in our circular polarization measurements; however, with no values in the literature of the Mueller matrices for each tissue available, the measurement of these matrices is beyond the scope of this paper. Figure 4(a) shows the degree of polarization results through a 0.17-mm-thick section of tendon oriented with its axis vertical. Incident linear polarization orientations ranging from 0° to 180° to the horizontal were explored, as well as incident circular polarization. Figure 4(b) shows the degree of polarization results as a function of tissue thickness. An analysis based upon calculation of the t statistic for the difference between the degree of polarization for linear versus circularly polarized light indicates a statistically significant difference at the p=0.01 level for all tissue thicknesses. However, changes in the degree of linear polarization can be attributed solely to scattering depolarization whereas changes in the degree of circular polarization are due to a combination of scattering depolarization and tissue birefringence. Figure 4Degree of linear and circular polarization in porcine tendon as a function of (a) incident polarization orientation in a 0.17-mm-thick tendon sample and (b) tissue thickness. Each sample was oriented with its fiber axis vertical. Each point is an average of three measurements. The error bars represent the standard deviation; points with nonvisible error bars have errors that are smaller than the symbol. The legend notations in parentheses refer to the incident polarization state; thus, PT(L) refers to the total degree of polarization for linearly polarized light incident on tissue and PT(C) refers to the total degree of polarization for circularly polarized light incident on tissue. 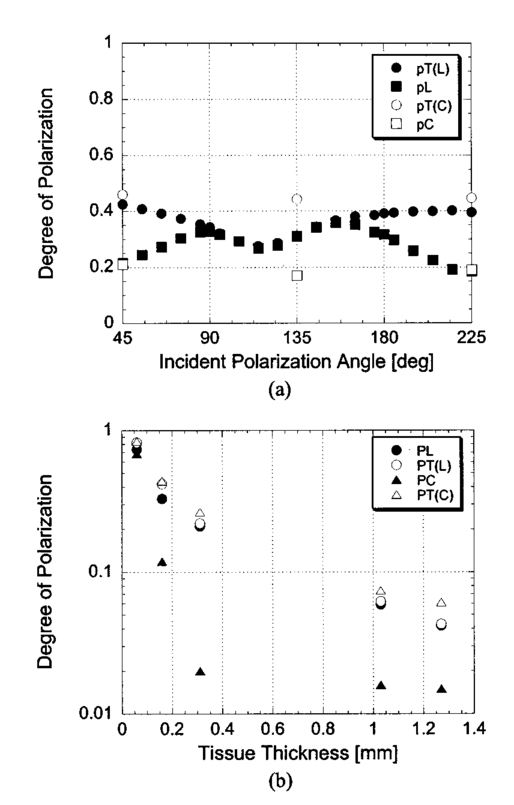 Studies of tissue birefringence were also conducted using porcine artery, which has a more complex structure that tendon. There are three main layers in muscular arteries. The inner intimal layer consists of endothelial cells with a mean diameter less than 10 μm. The medial layer consists mostly of closely packed smooth muscle cells with a mean diameter of 15–20 μm. Small amounts of connective tissue, including elastic, collagenous, and reticular fibers as well as a few fibroblasts, are also located in the media. Finally, the outer adventitial layer consists of dense fibrous connective tissue surrounded by looser connective tissue. The adventitia is largely made up of 1–12-μm-diam collagen fibers and thinner, 2–3-μm-diam elastin fibers. The dominant scatterers in artery may be the fibers, the cells, or the subcellular organelles.11 15 As with tendon, the cylindrical collagen and elastin fibers are ordered mainly along one axis, thus causing the tissue to be birefringent. The tissue was aligned 90° to the incident linear polarization axis to minimize the effect of birefringence on the signal measured. The degree of polarization as a function of tissue thickness is shown in Figure 5. An analysis based upon calculation of the t statistic for the difference between the degree of polarization for linear versus circularly polarized light indicates a statistically significant difference at the p=0.01 level for all tissue thicknesses. Again, the degree of circular polarization was affected by both birefringence and scattering whereas the degree of linear polarization was affected by scattering alone. Figure 5Degree of linear and circular polarization in porcine arterial tissue as a function of the tissue thickness. Each sample was oriented with its fiber axis vertical. Incident linear polarization was oriented at 90°. Each point is an average of three measurements. The error bars represent the standard deviation; points with nonvisible error bars have errors that are smaller than the symbol.  Last, porcine myocardium was investigated because it contains fibers oriented along two different orientations. Myocardium consists mostly of cardiac muscle fibers arranged in sheets that wind around the ventricles and atria. Cardiac muscle is comprised of myofibrils (∼1 μm in diameter) that in turn consist of cylindrical myofilaments (6–15 nm in diameter) and aspherical mitochondria (1–2 μm in diameter). Myocardium is typically birefringent since the refractive index along the axis of the muscle fibers is different than in the transverse direction.14 16 17 However, the birefringence effects in the degree of linear polarization measurements can be minimized by orienting one major axis of the tissue 0° relative to the incident linear polarization axis; the other tissue axis will then fall at roughly 90°, which also corresponds to minimal birefringence. The degree of polarization as a function of tissue thickness is shown in Figure 6. An analysis based upon calculation of the t statistic for the difference between the degree of polarization for linear versus circularly polarized light indicates a statistically significant difference at the p=0.01 level for all tissue thicknesses. Figure 6Degree of linear and circular polarization in porcine myocardial tissue as a function of the tissue thickness. Each sample was oriented with its fiber axis vertical. Incident linear polarization was oriented at 90°. Each point is an average of three measurements. The error bars represent the standard deviation; points with nonvisible error bars have errors that are smaller than the symbol.  4.DiscussionThe depolarization of linearly and circularly polarized light was measured versus propagation distance in blood, fat, tendon, artery, and myocardium. The results indicate that, in contrast to results obtained in common tissue phantoms,5 6 linearly polarized light survives through longer propagation distances than circularly polarized light in each of the biologic tissues investigated with the exception of blood. These results are both novel and interesting for two reasons: (1) for the first time the propagation of linear and circular polarization states has been compared in tissue, and (2) the data substantiate the speculation that different polarization states will propagate and depolarize differently in a given tissue and between different tissues.1 6 Clearly, some understanding of how and why light is depolarized by various types of biologic scatterers is needed. This understanding, in turn, can then be used both to design more accurate tissue phantoms for polarization-sensitive studies and to improve existing polarization-based tissue imaging technologies. Insight into the basic science of light depolarization by different tissues can be gained by looking at the differential depolarization of linear versus circular polarization states. In general, three different cases can be identified: Blood consists mainly of erythrocytes, which are anuclear and without abundant organelles; thus the dominant scatterers in blood are large cells, i.e., in blood Mie scatterers dominate. The results seen in blood demonstrate a preferential depolarization of linear over circular polarization states, which is typical of Mie scattering. Conversely, the other tissues investigated here consist of densely packed structures with a wide distribution of sizes that span the Rayleigh and Mie scattering regimes. However, the results seen in these tissues exhibit a preferential depolarization of circular over linear polarization states, which is typical of strict Rayleigh scattering.The underlying factors that contribute to why light is depolarized differently by each tissue may be attributed to various scatterer parameters, such as the scatterer size and concentration. It has been reported in the literature that, in solutions of spheres suspended in water, linearly polarized light is less depolarized than circularly polarized light for Rayleigh-sized spheres, whereas the reverse is true for Mie-sized spheres.5 6 7 Since the major structures (e.g., cells and collagenous fibers) in the tissues studied here are likely to be Mie sized, a priori one might have expected circularly polarized light to be less depolarized than linearly polarized light. However, this is not the case for the majority of the tissues we investigated. Clearly, either smaller structures or some other phenomenon must affect the scattering. Our understanding of light scattering by cellular and subcellular structures has evolved greatly in the past few years. It has been recognized for years that scattering by subcellular organelles can dominate tissue scattering.18 19 20 21 For example, the mitochondria of metabolically active cells have been shown to scatter light efficiently. More recently, both theoretical19 22 and experimental21 22 23 work has shown that material in the cell nucleus efficiently scatters light. These subcellular structures are typically much smaller than the wavelength of light; thus, one would expect Rayleigh scattering to dominate. One explanation for the results that we obtained in fat, tendon, artery, and myocardium is that small, Rayleigh-sized scatterers may dominate scattering in these tissues. Another explanation for our results may be the concentration of scatterers in these tissues. Most tissues are comprised of cellular and subcellular structures located in close proximity to each other; however, most studies involving tissue phantoms constructed of sphere suspensions are done with dilute concentrations, in which independent scattering can be assumed. In general, densely packed structures are likely to exhibit correlated scattering, an effect that has been observed previously in cornea.24 25 Cornea is comprised of individual collagen fibrils that are closely packed parallel to one another in a given layer, or lamella. If each fibril in the lamella scattered light independently, then the scattering cross section of the lamella should be the product of the cross section of a single fibril and the number of fibrils in the lamella. However, it has been observed that the lamella scatters less light than is predicted from the behavior of a single fibril. Thus, the fibrils do not scatter independently and coherent scattering effects cannot be neglected. Accordingly, just as densely packed structures exhibit correlated scattering, so too are they likely to exhibit correlated polarization effects. In a previous study, we observed that, in spherical suspensions, as the sphere concentration was increased beyond a concentration at which independent scattering can be assumed, the degree of polarization increased (rather than decreased) as the scatterer concentration increased.26 We hypothesize that this effect is due to coherent interactions between the scatterers, an effect that is likely to be present in many tissues. Having explored the reasons behind why tissues depolarize light as they do, we now turn to the subject of how best to use that information practically. Light depolarization is often reported as a function of some parameter that describes light scattering or attenuation by the sample. Typically, one of two parameters is used: τ, the estimated number of scattering events (also known as the optical thickness), or τ′, the reduced optical thickness. The quantity τ, calculated as the product of the scattering coefficient, μs, and the sample thickness, t, is the more intuitive parameter to use. However, it is not necessarily the best measure of the actual number of scattering events experienced by light propagating in the sample. Instead, τ represents the mean number of scattering events the light would experience if it traveled the shortest path through the sample. This estimate is valid for samples dominated by forward scattering, described by a scattering anisotropy (or average cosine of the scattering angle), g, of 1.0. For samples dominated by isotropic, large-angle scattering (indicated by g∼0 ), however, the majority of the light does not travel the shortest path through the sample and thus experiences many more scattering events than predicted by τ. One method of normalizing for the scattering anisotropy is to use τ′, the reduced optical thickness, calculated as the product of τ and (1−g). Although τ′ is a less intuitive parameter than τ, it provides a means of comparing polarized light propagation through samples with widely different scattering anisotropies. However, τ′ is only one of many parameters that can be used to compare datasets. Other parameters include the total attenuation coefficient, which takes into account the small but nonzero absorption by the sample, and the effective attenuation coefficient, taken from transport theory. A summary of the scattering and absorption properties of each of the tissues investigated here can be found in the literature.27 Thus far, there is no overwhelming evidence to suggest choosing one attenuation parameter over another. We choose here to compare the results from different tissues as a function of the measured intensity transmitted through the sample, I out ; relative to the incident intensity, I in (Figure 7). This method of comparing data is preferable because it is a direct measure of light attenuation through the same set of optics as those used for the polarimetric measurements rather than a calculation of light attenuation based on macroscopic average scattering parameters. A plot of the degree of polarization versus I out /I in also allows a direct comparison of how quickly the polarization state of the light is attenuated (or depolarized) relative to attenuation of the light intensity. Figure 7 shows a comparison of the degree of polarization as a function of I out /I in for the five tissues investigated. The degree of linear polarization is shown for all tissues; the degree of circular polarization (not shown) follows similar trends. The dotted line corresponds to a line of equal efficiency where light is depolarized and attenuated identically. Figure 7Degree of linear polarization in different tissues as a function of light intensity transmitted through the sample, I out , relative to the incident intensity, I in . Each point is an average of three measurements. The error bars represent the standard deviation; points with nonvisible error bars have errors that are smaller than the symbol.  The curve for each sample can be analyzed in terms of its slope, m, to indicate a situation where polarized light may be preferred over unpolarized light, or vice versa. The data indicate that light is depolarized most quickly through the adipose tissue, corresponding to a slope of m fat =1.94±0.21 ( R2=0.91, reported as mean slope ±0.21). In this case, imaging with polarized light may be less effective than imaging with unpolarized light. Blood illustrates the opposite extreme, where m blood =0.25±0.08 ( R2=0.98, reported as mean slope ±0.08), implying that polarized light could potentially be used to image further into blood than unpolarized light. The curves for the remaining tissues are all relatively similar and illustrate examples of equal imaging efficiency between unpolarized and polarized light. 5.ConclusionWe have quantified the degree of polarization subsequent to passage through various biological tissues. We have seen that linearly and circularly polarized light propagates differently in these tissues. Further, we have identified regions in which imaging by polarized light is likely to be preferable to imaging with unpolarized light. Finally, we have indicated the structural features in tissue that influence the degree of polarization and the importance of these structures on polarized light propagation. AcknowledgmentsThe authors thank the Affirmative Action and Diversity Program at Lawrence Livermore National Laboratory and the National Institutes of Health (National Cancer Institute Contract Grant No. 1 R01 CA85991-01) for their support of this research. This study was performed under the auspices of the U.S. Department of Energy under Contract No. W-7405-ENG-48. REFERENCES
S. L. Jacques
,
M. Ostermeyer
,
L. Wang
, and
D. Stephens
,
“Polarized light transmission through skin using video reflectometry: Toward optical tomography of superficial tissue layers,”
Proc. SPIE , 2671 199
–210
(1996). Google Scholar
L. T. Perelman
,
G. I. Zonios
,
V. Backman
,
R. Gurjar
,
I. Itzkan
,
R. R. Dasari
,
J. Van Dam
, and
M. S. Feld
,
“Quantitative analysis of mucosal tissues in patients using light scattering spectroscopy,”
Proc. SPIE , 3597 474
–479
(1999). Google Scholar
S. G. Demos
,
H. Savage
,
A. S. Heerdt
,
S. Schantz
, and
R. R. Alfano
,
“Time resolved degree of polarization for human breast tissue,”
Opt. Commun. , 124 439
–442
(1996). Google Scholar
G. Jarry
,
O. Schlee
,
O. Duhamel
,
J. Virmont
,
L. Poupinet
,
B. Clairac
,
M. Derrien
, and
D. Yeddou
,
“Coherent transmission of polarized light through mammalian tissue,”
Proc. SPIE , 2326 192
–201
(1995). Google Scholar
F. C. MacKintosh
,
J. X. Zhu
,
D. J. Pine
, and
D. A. Weitz
,
“Polarization memory of multiply scattered light,”
Phys. Rev. B , 40
(13), 9342
–9345
(1989). Google Scholar
J. M. Schmitt
,
A. H. Gandbakhche
, and
R. F. Bonner
,
“Use of polarized light to discriminate short-path photons in a multiply scattering medium,”
Appl. Opt. , 31
(30), 6535
–6546
(1992). Google Scholar
D. Bicout
,
C. Brosseau
,
A. S. Martinez
, and
J. M. Schmitt
,
“Depolarization of multiply scattered waves by spherical diffusers: Influence of the size parameter,”
Phys. Rev. E , 49
(2), 1767
–1770
(1994). Google Scholar
S. P. Morgan
,
M. P. Khong
, and
M. G. Somekh
,
“Effects of polarization state and scatterer concentration on optical imaging through scattering media,”
Appl. Opt. , 36
(7), 1560
–1565
(1997). Google Scholar
S. Bosman
,
“Heat-induced structural alterations in myocardium in relation to changing optical properties,”
Appl. Opt. , 32
(4), 461
–463
(1993). Google Scholar
R. C. Haskell
,
F. D. Carlson
, and
P. S. Blank
,
“Form birefringence of muscle,”
Biophys. J. , 56 401
–413
(1989). Google Scholar
B. Beauvoit
,
T. Kitai
, and
B. Chance
,
“Contribution of the mitochondrial compartment to the optical properties of the rat liver: A theoretical and practical approach,”
Biophys. J. , 67
(6), 2501
–2510
(1994). Google Scholar
A. Dunn
and
R. Richards-Kortum
,
“Three-dimensional computation of light scattering from cells,”
IEEE J. Sel. Top. Quantum Electron. , 2
(4), 898
–905
(1996). Google Scholar
R. Meyer
,
“Light scattering from biological cells: Dependence of backscatter radiation on membrane thickness and refractive index,”
Appl. Opt. , 18 585
–590
(1979). Google Scholar
J. R. Mourant
,
M. Canpolat
,
C. Brocker
,
O. Espondo-Ramos
,
T. Johnson
,
A. Matanock
,
K. Stetter
, and
J. P. Freyer
,
“Light scattering from cells: The contribution of the nucleus and the effects of proliferative status,”
Proc. SPIE , 3917 33
–42
(2000). Google Scholar
R. Drezek
,
A. Dunn
, and
R. Richards-Kortum
,
“Light scattering from cells: Finite-difference time-domain simulations and goniometric measurements,”
Appl. Opt. , 38 3651
–3661
(1999). Google Scholar
K. Sokolov
,
R. Drezek
,
K. Gossage
, and
R. Richards-Kortun
,
“Reflectance spectroscopy with polarized light: Is it sensitive to cellular and nuclear morphology?,”
Opt. Lett. , 5 302
–317
(1999). Google Scholar
D. Maurice
,
“Structure and transparency of the cornea,”
J. Physiol. (London) , 136 263
–287
(1957). Google Scholar
R. W. Hart
and
R. A. Farrell
,
“Light scattering in the cornea,”
J. Opt. Soc. Am. , 59 766
–774
(1969). Google Scholar
V. Sankaran
,
M. J. Everett
,
D. J. Maitland
, and
J. T. Walsh Jr.
,
“Polarized light propagation through tissue phantoms containing densely packed scatterers,”
Opt. Lett. , 25
(4), 239
–241
(2000). Google Scholar
|


CITATIONS
Cited by 160 scholarly publications and 1 patent.
Tissues
Polarization
Light scattering
Scattering
Blood
Optical fibers
Birefringence


