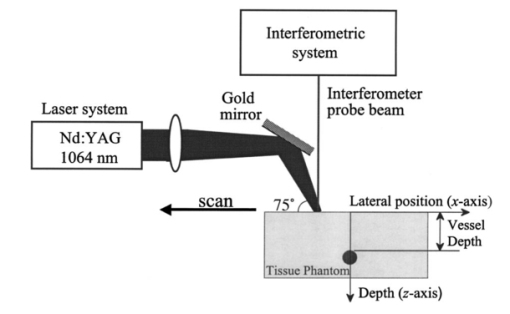
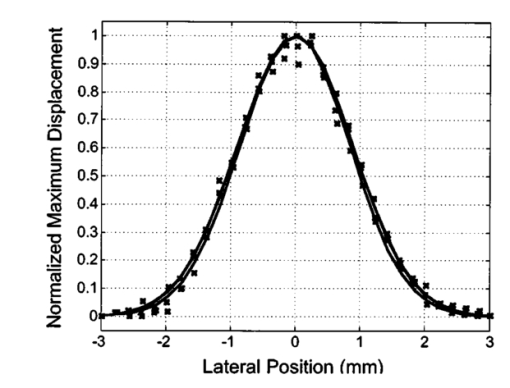
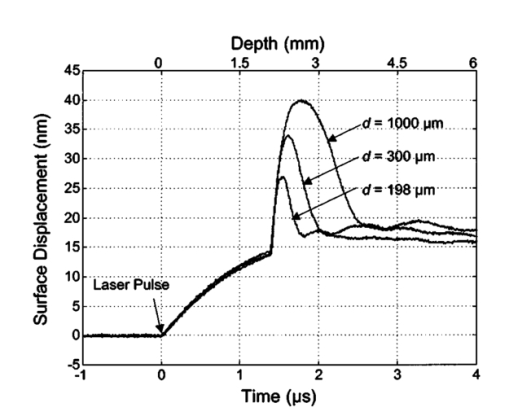
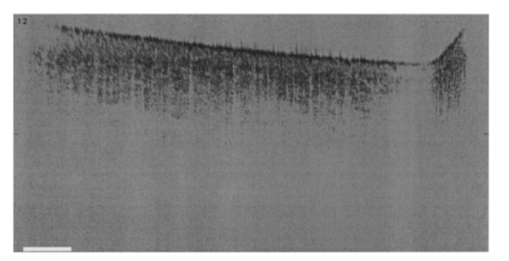
1.IntroductionNoninvasive techniques that image deep subsurface absorbers such as tumors and blood vessels in highly scattering tissue would be useful in a wide variety of medical applications. Techniques such as confocal microscopy and optical coherence tomography provide high-resolution images but cannot be applied to depths larger than 0.5 to 2 mm in turbid tissues.1 2 3 4 5 Diffuse optical imaging techniques such as photon migration are less sensitive to signal attenuation caused by multiple light scattering; however, their spatial resolution is often insufficient to detect small tumors or blood vessels.6 7 Conventional imaging modalities such as x-ray radiography, magnetic resonance imaging, and ultrasound imaging utilize different physical mechanisms that often do not provide sufficient contrast between various soft tissue types. Optoacoustic methods typically measure stress transients generated by the absorption of pulsed laser radiation to detect/image tissue heterogeneities or determine optical properties of spatially homogeneous media.8 9 10 11 12 13 14 15 16 17 18 Optoacoustic tomography refers to image formation from the time-resolved measurement of acoustic transients generated by optically heterogeneous tissue volumes in response to short pulse laser irradiation. Image formation is possible because optically heterogeneous structures absorb different amounts of light relative to the surrounding tissue. This difference in local energy density results in a differential tissue expansion that manifests itself in the radiation of a stress wave that propagates to the tissue surface, where it is measured by single or multiple stress transducers. Although radiative transport of the pump laser pulse within the target may be governed by multiple scattering, transduction of the laser-induced stresses to the tissue surface occurs via wave propagation that, in contrast to radiative transport, suffers comparatively little attenuation and spatial dispersion.8 16 17 19 20 Therefore, the use of laser-induced stress waves to examine heterogeneous structures that exhibit optical contrast may be possible at depths larger than those achieved by coherent optical techniques and with higher spatial resolution than that provided by diffuse optical methods. In general, it is desirable to perform optoacoustic imaging in a manner that allows the delivery of the pump laser pulse and detection of the stress waves on the same tissue surface. Consequently, standard front surface stress transducers may be impractical because they block the incident laser radiation. Numerous techniques have been developed to overcome this difficulty, including the use of piezoelectric transducers with separated light and sound fields, transparent transducers that measure stress-induced changes in optical reflectance, annular piezoelectric elements, and acoustic conductors where sound generated by an obliquely incident laser pulse propagates predominantly normal to the tissue surface.19 21 22 23 24 25 Despite these developments, detection using a stress transducer is impractical for some medical applications, because it requires tissue contact and cannot be readily used in conjunction with some minimally invasive procedures. We introduce a minimally invasive technique capable of detecting and imaging subsurface absorbers through the time-resolved measurement of surface displacement produced by laser-induced thermoelastic stresses. We demonstrate the use of a prototype system to detect subsurface blood vessels in model tissue phantoms and in vivo. 2.Materials and Methods2.1.ApparatusA prototype system is shown in Fig. 1. A Q-switched Nd:YAG laser operating at 1064 nm was used as the pump laser. The laser pulse possessed a Gaussian temporal profile with a full width at half maximum (FWHM) duration of 8 ns. The spatial profile as analyzed by a CCD camera (Cohu 4800, Cohu Incorporated) was a flat top with a FWHM diameter of 6.6 mm. The beam was focused by a 1000-mm focal length lens to a diameter of 0.6 mm. The angle of incidence of the pump laser beam at the sample was 15 deg. The refractive index of the tissue phantoms was 1.3, and yields an angle of laser radiation propagation within the phantom of 11.5 deg. The interferometric system has been described previously.26 The interferometer probe beam was centered relative to the pump laser beam on the target surface. Single pulse measurements were obtained at different lateral positions on the sample surface by translating the sample using a digital micrometer stage. The surface-displacement signals acquired at each lateral position were stored and combined to form a tomographic image. The incident radiant exposures employed range from 0.26 to 2.5 J/cm 2. 2.2.Imaging Tissue PhantomsWe interrogated several systems to simulate the presence of a blood vessel embedded within a tissue. The “surrounding tissue” in these phantoms was composed of either pure water or 7 Intralipid solution, the latter of which was prepared by diluting 10 Intralipid solution (Pharmacia Incorporated, Clayton, North Carolina). The reduced scattering coefficient of the Intralipid solution was μs ′=3.55 mm −1 at λ=1064 nm27 and approximates the reduced scattering coefficient of a highly scattering tissue such as dermis at visible wavelengths.28 The blood vessel phantoms consisted of polyimide tubes with diameters ranging from 200 to 1000 μm and wall thicknesses ranging from 19 to 50 μm (Cole-Parmer, Vernon Hills, Illinois). The polyimide tubes did not absorb significant laser energy and possessed walls that can be considered acoustically thin. A dilute solution of black India ink (Higgins, Bellwood, Illinois) was used to simulate the absorption properties of blood. The absorption coefficient of whole blood at 1064 nm is approximately μa=0.5 mm −1 and a 0.125 India ink solution (by volume) with an absorption coefficient of μa=0.45 mm −1 was used in all experiments.27 29 30 A syringe was used to flow the dilute India ink solution through the polyimide tubes after each measurement to prevent any ink particle sedimentation. 2.3.Imaging of a Human ForearmTo demonstrate the use of this technique in vivo, a vessel in the forearm of a human volunteer was measured. The experimental setup was similar to that used in the phantom experiments. Single measurements were made at spatial locations either directly over or approximately 5-mm adjacent to a blood vessel. The vessel location was determined visually by the presence of a faint blue-green line. A thin layer of water was added on top of the skin surface to simplify alignment. Because no scanning was employed, the Q-switched Nd:YAG laser was not focused onto the surface of the skin. The resulting incident radiant exposure was 482 mJ/cm 2. For comparison, an optical coherence tomography system operating at λ=1310 nm with Δλ=75 nm31 was used to image the same location. 3.Results3.1.Tissue Phantoms3.1.1.Nonscattering phantomSample surface displacement traces acquired from vessel phantoms with water as the surrounding “tissue” are shown in Fig. 2. Each trace corresponds to a phantom composed of a single 1000-μm-diam vessel located at depths of 3.80, 5.83, and 7.22 mm. The depths were obtained using a digital micrometer.32 The incident pump laser and interferometric probe beam was centered directly above each tissue-blood vessel phantom. The surface displacements that begin at 0 ns were due to absorption of laser radiation by the surrounding water. The surface displacements caused by the submerged phantom blood vessels begin at 2.53, 3.78, and 4.84 μs. These time delays represent the time necessary for the stress waves generated by the phantom vessels to reach the surface. The vessel depths were calculated by multiplying the delay time by the speed of sound in pure water33 and resulted in calculated vessel depths of 3.78, 5.79, and 7.24 mm. These calculated depths were within 45 μm of the actual depths. The upper axis of Fig. 2 represents depth as computed from the delay time. Surface displacement traces obtained at adjacent lateral locations across the phantom model were assembled side by side to form a tomographic image of the time-dependent surface deformation. A tomographic image of a 495-μm-diam phantom blood vessel placed at a depth of 1.53 mm is shown in Fig. 3(a), with a corresponding contour plot in Fig. 3(b). In these figures, the x axis represents the lateral position relative to the center of the vessel, and the y axis represents the depth into the phantom. Figure 4 displays tomographic images for phantom vessels of diameters 1000, 495, and 198 μm, respectively, all placed at a depth of ∼1.5 mm within the phantoms. Figure 2Sample surface displacement traces of a 1000-μm phantom vessel placed at depths of 3.80, 5.83, and 7.22 mm. Incident radiant exposure ϕ0=280 mJ/ cm 2; pump laser beam diameter ds=6.7 mm. The surrounding medium was pure water. 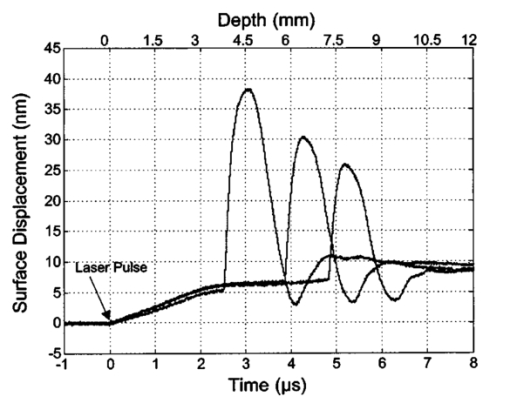 Figure 3Sample (a) topographic and (b) contour images of a 495-μm-diam phantom vessel placed within pure water at a depth of 1.53 mm. Incident radiant exposure ϕ0=300 mJ/ cm 2; pump laser beam diameter ds=1.5 mm. 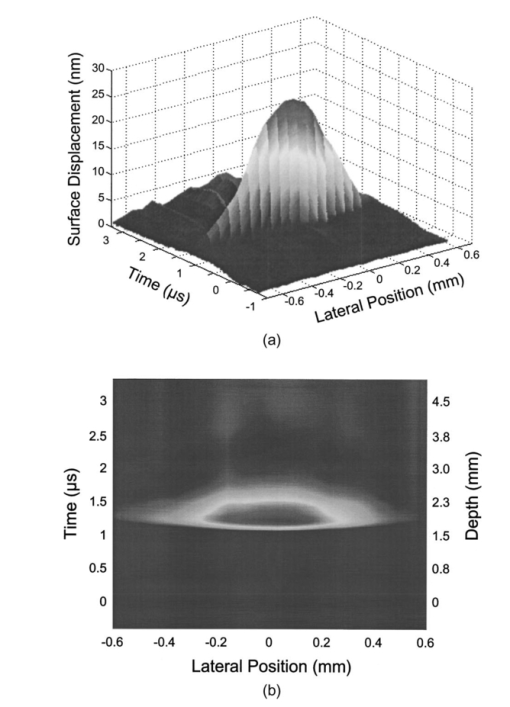 Figure 4Sample contour images of (a) 1000, (b) 495, and (c) 198-μm phantom vessels in pure water. The vessels were placed at an approximate depth of 1.5 mm. For 1000 and 495-μm-diam vessels: ϕ0=300 mJ/ cm 2 and ds=1.5 mm. For 198-μm vessel: ϕ0=260 mJ/ cm 2 and ds=0.8 mm. The maximum displacements are 37, 25, and 6 nm for 1000, 495, and 198-μm-diam vessels, respectively. Scale bar=500 μm. 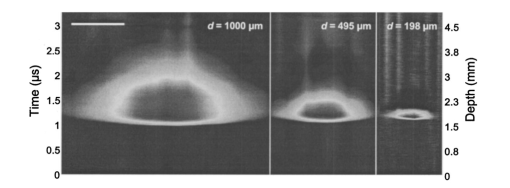 A quantitative measure of vessel size was obtained by plotting the maximum surface displacement as a function of lateral probe beam position, as illustrated in Fig. 5. The surface displacement profiles were normalized and fit to a Gaussian function. The width of the three profiles calculated at 60 of the maximum displacement are 970, 510, and 230 μm corresponding to phantom vessel diameters 1000, 495, and 198 μm, respectively. The width of maximum surface displacement versus lateral position provides a good indicator of vessel size in nonscattering media. Figure 5Normalized surface displacement as a function of lateral position for phantom vessels of 1000, 495, and 198-μm-diameter placed in pure water at a depth of approximately 1.5 mm. For 1000 and 495-μm-diam vessels: ϕ0=300 mJ/ cm 2 and ds=1.5. For 198-μm-diam vessel: ϕ0=260 mJ/ cm 2 and ds=0.8 mm. Gaussian curves have been fit to the data. 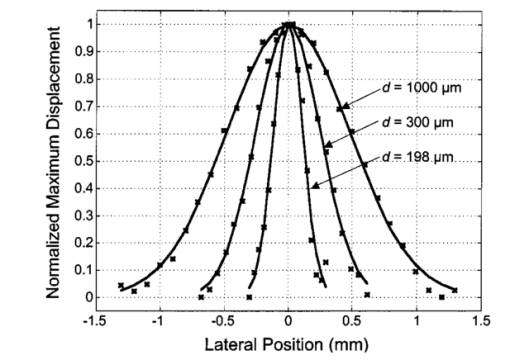 3.1.2.Scattering phantomSample surface displacement traces of tissue-blood vessel phantoms with 7 Intralipid as the surrounding tissue are shown in Fig. 6. Each trace corresponds to a measurement taken of a scattering tissue phantom with a 300-μm-diam vessel located at depths of 1.07, 1.70, 2.09, 2.76, 3.30, and 3.87 mm. The calculated vessel depths were found to be 1.04, 1.65, 2.13, 2.72, 3.27, and 3.82 mm by multiplying the delay time with the speed of sound in 7 Intralipid (1508 m/s).32 These calculated depths were within 50 μm of the actual depths. For highly scattering media, penetrance of the pump laser beam may be a limiting factor when imaging subsurface absorbers. Figure 6Sample surface displacement traces acquired from a 300-μm-diam phantom vessel placed within a 7 Intralipid solution at depths of 1.07, 1.70, 2.09, 2.76, 3.30, and 3.87 mm. ϕ0=280 mJ/ cm 2 and ds=6.7 mm. 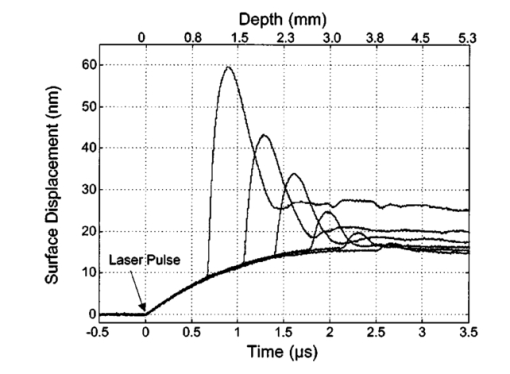 Surface displacement traces obtained at adjacent lateral positions across the phantom surface were assembled side by side to form a tomographic image of the time-dependent deformation. A sample tomographic image of a 1000-μm-diam phantom blood vessel placed at depth of 1.36 mm is shown in Fig. 7(a), with a corresponding contour plot shown in Fig. 7(b). In these figures, the x axis represent the lateral position relative to the center of the vessel, and the y axis represents the depth into the phantom. The initial surface displacement beginning at t=0 ns is due to laser absorption of the Intralipid and is clearly visible. Figure 7Sample (a) tomographic and (b) contour images of a 1000-μm-diam vessel placed at a depth of 1.36 mm with a 7 Intralipid solution. ϕ0=2.5 J/cm 2 and ds=1.5 mm. 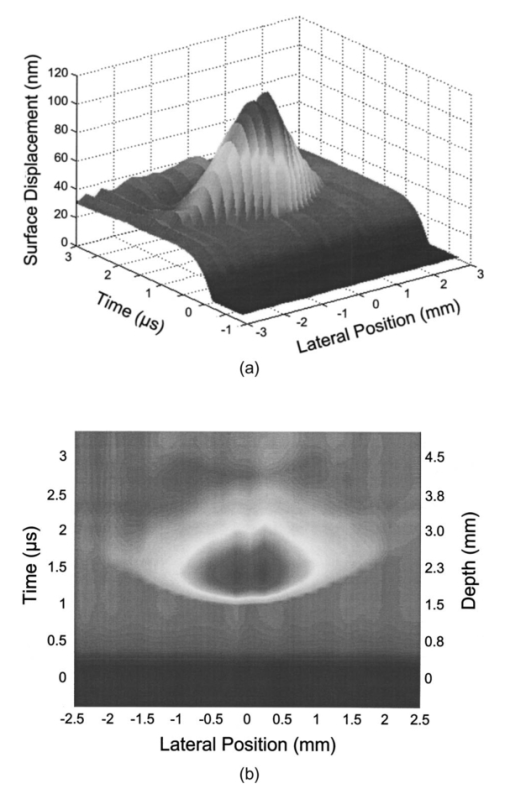 Figure 8 compares tomographic images for phantom vessels of diameters 1000, 495, and 198 μm, respectively, placed in scattering phantoms in which the vessel depth was ∼1.4 mm. While the vessel images are significantly broadened in the lateral direction, the temporal profile of the vessels with depth has not been significantly affected by optical scattering within the phantom medium. Figure 8Sample contour images of three phantom vessels in a 7 Intralipid solution. The vessels were placed at an approximate depth of 1.4 mm. ϕ0=2.5 J/cm 2 and ds=1.5 mm. The maximum displacements are 78, 42, and 22 nm for 1000, 495, and 198-μm-diam vessels, respectively. Scale bar=500 μm.  Normalized surface displacement profiles are shown in Fig. 9. The width of the three profiles calculated at 60 of the maximum displacement were 1810, 1800, and 1730 μm for phantom vessel diameters 1000, 495, and 198 μm, respectively. Although the variation of maximum surface displacement with lateral position across the vessel is not a good indicator of vessel size in a highly scattering medium, the surface displacement as a function of time remains a good indicator of vessel size. Figure 10 depicts temporal profiles of phantom vessels with diameters 1000, 300, and 198 μm, in which the vessel depth was held fixed at ∼2.2 mm. The temporal profile and amplitude of the measured surface displacement is significantly different for each phantom vessel, and both provide information useful to extract vessel size. The exact temporal profile is a function of vessel size and wave propagation properties, including diffraction and attenuation. 3.2.Human Forearm In VivoFigure 11 illustrates two sample surface displacement traces produced by the adsorption of pulsed 1064-nm laser radiation within the forearm of a human volunteer. The top trace was obtained with pump and probe beams centered over a blood vessel, while the bottom trace was obtained with pump and probe beam placed approximately 5-mm adjacent to the vessel. The surface displacement that occurred immediately after the pump-pulse irradiation was due to optical absorption by the water layer. At a delay of 1.6 μs, an increase in surface displacement was seen due to absorption within the forearm skin. The water thickness was estimated to be 2.4 mm from the transit time of 1.6 μs. The displacement in the top trace caused by the submerged blood vessel begins at 2.2 μs. Using a speed of sound of 1.5 mm/μs for skin,34 the vessel depth was estimated to be 0.9 mm. This appears to be a realistic estimate, as the vessel was faintly visible from the surface. Figure 11Two sample surface displacement traces obtained from the forearm of a human volunteer. The top trace was obtained directly above the vessel, and the bottom trace was obtained 5 mm to the side of the vessel. ϕ0=480 mJ/cm 2 and ds=6.7 mm. The vessel depth is estimated to be 0.9-mm below the skin surface. 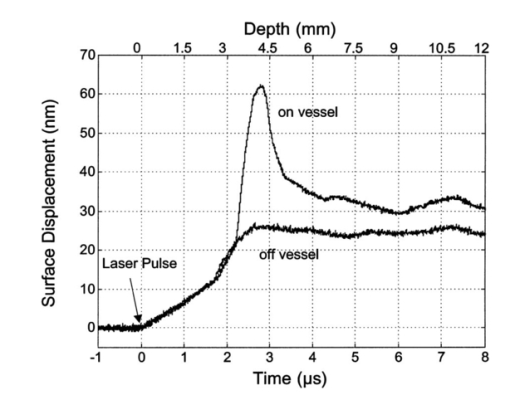 An OCT image was acquired directly over the same vessel using a linear-scanning clinical OCT system.31 The resulting image is shown in Fig. 12. The bar within the image represents 500 μm. Although the image has some texture, there is no indication of a blood vessel. 4.DiscussionAn interferometric system designed to provide time-resolved measurements of surface displacements generated by thermoelastic stresses was used to image artificial blood vessels in absorbing and highly turbid media, and for the detection of a blood vessel in a human forearm in vivo. Images of subsurface vessel phantoms were obtained by displaying side by side the time-resolved surface displacement at several adjacent locations on the sample surface. In nonscattering media, the tomographic images were faithful to the location and size of the optical heterogeneities probed. Specifically, a quantitative measure of vessel size was obtained by plotting the maximum surface displacement as a function of lateral position across the sample. The lateral resolution in a nonscattering medium is a function of the pump laser spot size. For turbid media, multiple scattering of the pump laser beam radiation degrades significantly the lateral resolution. In this case, the variation of the maximum surface displacement with lateral position is broadened significantly and can no longer be used to extract vessel size. However, the temporal profile of the surface displacement is not significantly affected by scattering and can be used to obtain an accurate measure of vessel size. This illustrates an advantage of using stress wave propagation over light scattering to obtain high-resolution images in scattering media. The results that we have presented are not indicative of the best spatial resolution that can be achieved using this technique. In this preliminary study, we scanned the pump and probe laser beams in tandem and have simply assembled the individual displacement traces side by side to form an image. Displacement traces acquired at different locations on the tissue surface were not analyzed or processed to localize the source of the detected laser-induced thermoelastic displacement. Image reconstruction algorithms tailored for optoacoustic imaging based on the detection of thermoelastic stresses would considerably improve the lateral and axial resolution.11 12 14 16 35 In the absence of an image reconstruction algorithm, an improvement in lateral resolution was achieved by reducing the beam diameter of the pump laser pulse. The use of small spot sizes for interrogating turbid tissue phantoms significantly reduced the optical penetrance of the pump laser radiation, and therefore greatly reduced the efficiency with which we could excite the buried phantom vessel.36 To compensate, we employed incident radiant exposures as large as 2.5 J/cm 2; exceeding by 25 times the ANSI standard of 100 mJ/cm 2 for nanosecond laser pulses in the visible and near infrared.37 However, it is important to note that in the cases where these large radiant exposures were used (Figs. 7 8 9), the pump laser beam diameter (1.5 mm) was just over five times larger than the transport mean free path (l*=[μa+μs ′]−1=0.28 mm) of the turbid phantom. Monte Carlo and optical diffusion calculation simulations indicate that the radiant exposure that reaches a phantom vessel placed at a depth of 1.5 mm is only 6 to 7 of that it would receive if a pump laser beam with a diameter of 30 l* or 8.4 mm were used.38 Thus, to implement the interferometric system proposed here using a clinically acceptable radiant exposure, a pump laser beam of large diameter should be used to maximize the penetrance of the laser beam. The thermoelastic surface displacement should be measured at several locations on the tissue surface with the pump laser beam fixed in position rather than moving the pump and probe beams in tandem across the tissue surface. An optoacoustic reconstruction algorithm would then be used to form an image from the displacement traces detected at various locations on the tissue surface. In fact, this is the strategy that is presently used in some optoacoustic imaging techniques that employ the detection of the thermoelastic stresses rather than displacement.11 12 17 39 The interferometric system was used successfully to detect the presence of a blood vessel in vivo within a human forearm. Although the vessel depth was estimated to be less than 1 mm, the vessel was not visible using a high-resolution clinical OCT system. This is likely due to the fact that the coherent penetration depth in highly scattering dermis is on the order of 1 mm, and there may be poor scattering contrast between the vessel and surrounding tissue at the infrared wavelength (λ=1310 nm; Δλ=75 nm) used in the OCT system. This has also been observed in the upper gastrointestinal tract, where blood vessels are not readily detected using OCT despite typical imaging depths of 2 to 3 mm.40 It is useful to compare the relative sensitivities of the time-resolved interferometric measurement to surface displacement with piezoelectric sensors often used to provide time-resolved measurements pressure (or stress) for optoacoustic topography. Polyvinylidene difluoride (PVDF) is a highly sensitive piezoelectric material commonly used for such measurements.14 16 18 20 A circular 25-μm-thick PVDF sensor of 1 mm diam can detect a minimum pressure of ∼30 kPa with a temporal resolution of ∼12 ns on a single shot basis.18 20 By comparison, the interferometric system employed here probes a surface area 104 times smaller and is capable of detecting a minimum displacement of no worse than 0.16 nm with 4-ns temporal resolution.26 To compare the sensitivities of these two measurement modalities, let us examine the following highly simplified test case. Consider the signal emanating from the first 0.1-cm layer of a hypothetical nonscattering tissue possessing μa=0.3 cm −1 and irradiated by an instantaneous laser pulse with an incident radiant exposure of 100 mJ/ cm 2. Given the low absorption of the tissue, the average temperature rise ΔT in this surface layer is given by ΔT=μaΦ0/ρcv=0.007 °C, where values for the density (ρ=1.0 g/cm 3) and specific heat capacity (cv=4.2 J/g °C) are taken identical to that of water. Note that the presence of tissue scattering will increase this temperature change, as backscattered light will increase the internal fluence rate, and thus also the absorbed energy density. The maximum pressure Δp generated by this instantaneous temperature change is given by Δp=ρβcL 2ΔT=5.7 kPa, where values for the volumetric temperature coefficient of thermal expansion (β=3.62×10⁻⁴ /°C) and longitudinal sound speed (cL=1500 m/s) are taken identical to that of water. This pressure is more than five times smaller than the 30 kPa sensitivity of the PVDF sensor considered before. The surface displacement Δz in this case is given by Δz=βLΔT/3=0.8 nm, where L=0.1 cm, the thickness of the layer that expands. This displacement is five times larger than the 0.16-nm displacement sensitivity of the interferometer. Therefore in this test case, interferometry offers 25 times more sensitivity than the piezoelectric sensor. Of course, a piezoelectric element of larger area can possess a higher sensitivity, but this is achieved at the expense of a reduction in lateral spatial resolution. Thus, in terms of sensitivity, the interferometric method of surface displacement measurement presented here should compare favorably with current techniques for the time-resolved measurement of pressure in biomedical optoacoustic tomography. 5.ConclusionsOptoacoustic tomography using intererometric detection of surface displacement has promise as a noncontact technique for detecting subsurface absorbers in highly scattering media. The design of the interferometric system could be implemented as a fiber optical system and used as a clinically valuable minimally invasive diagnostic tool. AcknowledgmentsThe authors wish to thank Hans Ludemann, Brett Bouma, Gary Tearney, and Andrew Yablon for advice and technical assistance. This research was made possible by the DOD Medical Free Electron Laser Program N00014-94-1-0927, the Office of Naval Research DAAH04-95-1-0216, U.S. Army grant USAMRAAD DAMD 1794C4009, and Laser Microbeam and Medical Program NIH-P41-RR-01192. REFERENCES
M. Rajadhyaksha
,
S. Gonzalez
,
J. M. Zavislan
,
R. R. Anderson
, and
R. H. Webb
,
“In vivo confocal scanning laser microscopy of human skin II: advances in instrumentation and comparison with histology,”
J. Invest. Dermatol. , 113 293
–303
(1999). Google Scholar
J. M. Schmitt
,
M. J. Yadlowsky
, and
R. F. Bonner
,
“Subsurface imaging of living skin with optical coherence microscopy,”
Dermatology , 191 93
–98
(1995). Google Scholar
C. Cullander
,
“Light microscopy of living tissue: the state and future of the art,”
J. Invest. Dermatol. Symp. Proc. , 3 166
–171
(1998). Google Scholar
S. Gonzalez
,
M. Rajadhyaksha
, and
R. R. Anderson
,
“Non-invasive (real-time) imaging of histologic margin of a proliferative skin lesion in vivo [letter],”
J. Invest. Dermatol. , 111 538
–539
(1998). Google Scholar
M. E. Brezinski
and
J. G. Fujimoto
,
“Optical coherence tomography: High-resolution imaging in nontransparent tissue,”
IEEE J. Sel. Top. Quantum Electron. , 5 1185
–1192
(1999). Google Scholar
D. Y. Paithankar
,
K. T. Schomacker
, and
N. S. Nishioka
,
“Frequency-domain optical detection of subsurface blood vessels: experimental and computational studies using a scattering phantom,”
IEEE J. Sel. Top. Quantum Electron. , 5 1032
–1039
(1999). Google Scholar
D. A. Boas
,
M. A. O’Leary
,
B. Chance
, and
A. G. Yodh
,
“Detection and characterization of optical inhomogeneities with diffuse photon density waves: a signal-to-noise analysis,”
Appl. Opt. , 36 75
–92
(1997). Google Scholar
R. O. Esenaliev
,
A. A. Karabutov
, and
A. A. Oraevsky
,
“Senstivity of laser opto-acoustic imaging in detection of small deeply embedded tumors,”
IEEE J. Sel. Top. Quantum Electron. , 5 981
–988
(1999). Google Scholar
A. A. Oraevsky
,
S. L. Jacques
, and
F. K. Tittel
,
“Measurement of tissue optical properties by time-resolved detection of laser-induced transient stress,”
Appl. Opt. , 36 402
–415
(1997). Google Scholar
A. A. Karabutov
,
I. M. Pelivanov
,
N. B. Podymova
, and
S. E. Skipetrov
,
“Direct measurement of the spatial distribution of light intensity in a scattering medium,”
JETP Lett. , 70 183
–188
(1999). Google Scholar
K. P. Ko¨stli
,
M. Frenz
,
H. P. Weber
,
G. Paltauf
, and
H. Schmidt-Kloiber
,
“Optoacoustic topography: time-gated measurement of pressure distributions and image reconstruction,”
Appl. Opt. , 40 3800
–3809
(2001). Google Scholar
K. P. Ko¨stli
,
D. Frauchiger
,
J. J. Niederhauser
,
G. Paltauf
,
H. P. Weber
, and
M. Frenz
,
“Optoacoustic imaging using a three-dimensional reconstruction algorithm,”
IEEE J. Sel. Top. Quantum Electron. , 7 918
–923
(2001). Google Scholar
R. A. Kruger
and
P. Liu
,
“Photoacoustic ultrasound: Pulse production and detection in 0.5 Liposyn,”
Med. Phys. , 21 1179
–1184
(1994). Google Scholar
C. G. A. Hoelen
,
F. F. M. de Mul
,
R. Pongers
, and
A. Dekker
,
“Three-dimensional photoacoustic imaging of blood vessels in tissue,”
Opt. Lett. , 23 648
–650
(1998). Google Scholar
C. G. A. Hoelen
and
F. F. M. de Mul
,
“A new theoretical approach to photoacoustic signal generation,”
J. Acoust. Soc. Am. , 106 695
–706
(1999). Google Scholar
C. G. A. Hoelen
and
F. F. M. de Mul
,
“Image reconstruction for photoacoustic scanning of tissue structures,”
Appl. Opt. , 39 5872
–5883
(2000). Google Scholar
G. Paltauf
and
H. Schmidt-Kloiber
,
“Pulsed optoacoustic characterization of layered media,”
J. Appl. Phys. , 88 1624
–1631
(2000). Google Scholar
J. A. Viator
,
G. Au
,
G. Paltauf
,
S. L. Jacques
,
S. A. Prahl
, and
H. Ren
,
“Clinical testing of a photoacoustic probe for port wine stain depth determination,”
Lasers Surg. Med. , 30 141
–148
(2002). Google Scholar
A. A. Karabutov
,
E. V. Savateeva
,
N. B. Podymova
, and
A. A. Oraevsky
,
“Backward mode detection of laser-induced wide-band ultrasonic transients with optoacoustic transducer,”
J. Appl. Phys. , 87 2003
–2014
(2000). Google Scholar
J. A. Viator
,
S. L. Jacques
, and
S. A. Prahl
,
“Depth profiling of absorbing soft materials using photoacoustic methods,”
IEEE J. Sel. Top. Quantum Electron. , 5 989
–996
(1999). Google Scholar
C. Kopp
and
R. Niessner
,
“Optoacoustic sensor head for depth profiling,”
Appl. Phys. B: Lasers Opt. , 68 719
–725
(1999). Google Scholar
G. Paltauf
and
H. Schmidt-Kloiber
,
“Measurement of laser-induced acoustic waves with a calibrated optical transducer,”
J. Appl. Phys. , 82 1525
–1531
(1997). Google Scholar
P. C. Beard
and
T. N. Mills
,
“Characterization of post mortem arterial tissue using time-resolved photoacoustic spectroscopy at 436, 461 and 532 nm,”
Phys. Med. Biol. , 42 177
–198
(1997). Google Scholar
Q. X. Chen
,
R. J. Dewhurst
,
P. A. Payne
, and
B. Wood
,
“A new laser-ultrasound transducer for medical applications,”
Ultrasonics , 32 309
–313
(1994). Google Scholar
P. C. Beard
and
T. N. Mills
,
“Extrinsic optical-fiber ultrasound sensor using a thin polymer film as a low-finesse Fabry-Perot interferometer,”
Appl. Opt. , 35 663
–675
(1996). Google Scholar
B. P. Payne
,
Vasan Venugopalan
,
B. B. Mikic´
, and
N. S. Nishioka
,
“Optoacoustic determination of optical attenuation depth using interometric detection,”
J. Biomed. Opt. , 8 264
–272
(2003). Google Scholar
D. D. Royston
,
R. S. Poston
, and
S. A. Prahl
,
“Optical properties of scattering and absorbing materials used in the development of optical phantoms at 1064 nm,”
J. Biomed. Opt. , 1 110
–116
(1996). Google Scholar
W. F. Cheong
.
S. A. Prahl
, and
A. J. Welch
,
“A review of the optical-properties of biological tissues,”
IEEE J. Quantum Electron. , 26 2166
–2185
(1990). Google Scholar
S. Takatani
and
M. D. Graham
,
“Theoretical analysis of diffuse reflectance from a two-layer tissue model,”
IEEE Trans. Biomed. Eng. , 26 656
–664
(1979). Google Scholar
B. E. Bouma
and
G. J. Tearney
,
“Power-efficient nonreciprocal interferometer and linear-scanning fiber-optic catheter for optical coherence tomography,”
Opt. Lett. , 24 531
–533
(1999). Google Scholar
S. A. Goss
,
R. L. Johnston
, and
F. Dunn
,
“Comprehensive compilation of empirical ultrasonic properties of mammalian tissues,”
J. Acoust. Soc. Am. , 64 423
–457
(1978). Google Scholar
F. F. M. de Mul
and
C. G. A. Hoelen
,
“Three-dimensional imaging of blood vessels in tissue using photo-acoustics,”
J. Vasc. Res. , 35 192
(1998). Google Scholar
M. Keijzer
,
S. L. Jacques
,
S. A. Prahl
, and
A. J. Welch
,
“Light dis-tributions in artery tissue: Monte Carlo simulations for finite-diameter laser beams,”
Lasers Surg. Med. , 9 148
–154
(1989). Google Scholar
G. Paltauf
,
H. Schmidt-Kloiber
,
K. P. Ko¨stli
and
M. Frenz
,
“Optical method for two-dimensional ultrasonic detection,”
Appl. Phys. Lett. , 75 1048
–1050
(1999). Google Scholar
J. A. Izatt
,
M. D. Kulkarni
,
S. Yazdanfar
,
J. K. Barton
, and
A. J. Welch
,
“In vivo bidirectional color Doppler flow imaging of picoliter blood volumes using optical coherence tomography,”
Opt. Lett. , 22 1439
–1441
(1997). Google Scholar
|
CITATIONS
Cited by 71 scholarly publications and 1 patent.
Tissues
Natural surfaces
Interferometry
Tomography
Blood vessels
Scattering
Tissue optics


