1.IntroductionAny disease process is accompanied by changes in the metabolism of the affected cells or organs. This justifies the quest for fast in situ on-line information on metabolic alterations for both better biological process understanding and earlier medical diagnosis. In this sense, local in situ vibrational spectroscopy is a powerful tool, which operates at a molecular level in giving access to the infrared (IR) fingerprints of the biomolecules through their fundamental functional chemical groups.1 This contribution presents a new approach based on the general concept of fiber evanescent wave spectroscopy (FEWS)2 3 4 5 using an original design based on a new generation of infrared glass fibers which have been tapered, allowing remote, sensitive, and in situ measurements in the 3000–800 cm−1 spectral range. Mice liver tissues have been used as test materials and their medium IR (MIR) spectra recorded from the mere contact between the tissues and the surface of the fiber. For the first time, it is clearly shown that biochemical differences reflecting metabolic alterations can be assigned in liver tissues after their inherent IR signatures acquired by FEWS. 2.Experimental SetupAs represented in Fig. 1 the experimental setup consists in a Fourier-transform infrared (FTIR) spectrophotometer coupled with an IR glass optical fiber and a mercury cadmium telluride (MCT) detector which is sensitive in the 3–13 μm spectral window. The principle of evanescent wave spectroscopy is based on the fact that the light propagates in an optical fiber by total reflections at the interface between the glass, which exhibits a high refractive index, and the air. At each reflection, a part of the energy is absorbed by any chemical or biological species having absorption bands in the IR spectral region. In this attenuated total reflection mechanism, both theory and experimental results have evidenced that the absorbency is inversely proportional to the fiber diameter,6 7 due to multiplication of reflections as zoomed on Fig. 1. Therefore, to increase the sensitivity of the sensor it is crucial to taper the fiber to ensure good control of its diameter. This goal can be achieved by two routes. The first one consists in accelerating on-line, the drawing speed during the fibering process, and the second in using an original chemical etching process which congruently dissolves the glass and thereby allows one to accurately control the diameter and to obtain a fiber surface having low roughness and excellent optical quality. Figure 1 represents the final device with a zoom on the sensing zone of the fiber which corresponds, for instance, to a diameter of 100 μm while the rest of the fiber exhibits a diameter of 400 μm. This fiber design offers three major advantages: high sensitivity, which exponentially increases with the diameter reduction, great flexibility, allowing a bending radius of a few millimeters, and an excellent optical quality surface due to the chemical polishing. In using ethanol absorption bands in the 1100 cm−1 region, it has been shown that the sensitivity was drastically increased when the fiber diameter was reduced down to 75 μm.7 It is expected that the sensitivity will be at the maximum in a quasisingle mode configuration, in others words, when the fiber diameter will be around 20–30 μm which will require a special design of the fiber holder to ensure mechanical stability. The IR glass corresponds to an original composition of the Te–As–Se (TAS) ternary system. It has been selected by keeping a good balance between the glass temperature Tg, around 140 °C, and the IR transparency domain (3000–800 cm−1 region) which encompasses the IR signatures of most of the chemical or biochemical species. This glass is remarkable by its viscosity-temperature dependence which permits easy fiber drawing since rapid changes in the drawing speed are allowed. Also, it exhibits excellent durability in moisture, water, and solvents, as deduced from tests performed after prolonged contacts with chemical or biological materials which have ascertained that no modification of the glass surface occurs, if one excepts an acidic attack in oxidizing conditions. All these experiments have been conducted in order to fulfill the requirements related to any toxicity in situation of in vivo experiments. Figure 1Schematic representation of the experimental setup used for FEWS measurements. It is composed of an IR source, a tapered chalcogenide glass fiber and a MCT detector. (a) Is a zoomed schematic of the fiber tapering zone in which the optical beam path is shown. The number of reflections per length at the interface between the fiber and the air is greater in the tapered part. (b) Shows the mice liver tissues in contact with the optical fiber. 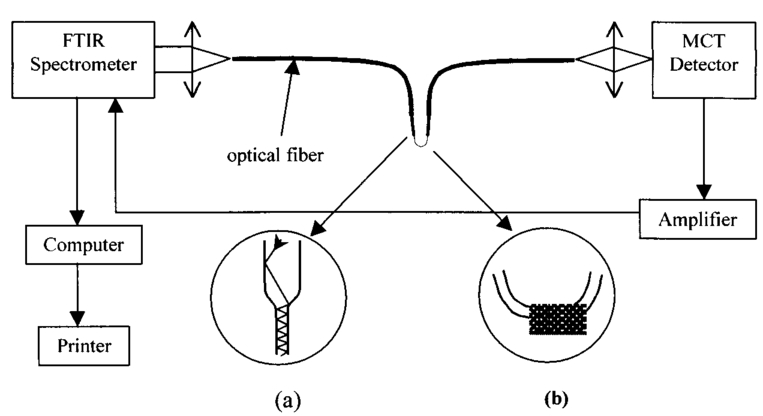 3.Results and DiscussionThe biological materials used for testing are mice liver tissues since liver participates in most metabolic pathways and is particularly involved during metabolic diseases. Therefore, we chose this organ to investigate the efficiency of FEWS to identify metabolic abnormalities. All animals used in this study were maintained according to French laws and regulations. Liver samples were sliced (10 μm) by cryogenic microtome cutting and, then, deposited on the tapered fiber ensuring an optimal contact between the glass and the sample as shown in Fig. 1. In this experimental configuration the evanescent wave penetration depth allows the probing of only the very first microns of the sample. In order to qualify this spectroscopy based on tapered fiber versus the traditional transmission method using CaF 2 windows, dehydrated mice liver sections have been examined by both methods. Figure 2 displays for comparison the MIR spectrum of a mouse liver sample collected either in the transmission mode (solid line) or in the ATR mode using the optical fiber as the transducer (dashed line). Indeed, the MIR domain contains most of the vibrational modes observed in biomolecules. Figure 2FEWS and transmission spectra of mice liver. MIR spectra of mice liver tissues have been collected in both the current transmission mode, the sample being deposited on a CaF 2 window, and in the FEWS mode in order to compare the sensitivity and resolution attained with the fiber-optic sensor. Most of the vibrational modes observed in biomolecules arise in the 4000–800 cm−1 frequency domain, the 2000–2800 cm−1 range being usually featureless. MIR spectra have been collected on dehydrated tissues with a 4 cm−1 resolution at room temperature. The sole difference observed between the transmission mode through a CaF 2 window (solid line) and the FEWS mode (dashed line) is a difference in the bands intensities which arise from the wave number-dependent depth penetration of the evanescent wave in the low refractive index medium. 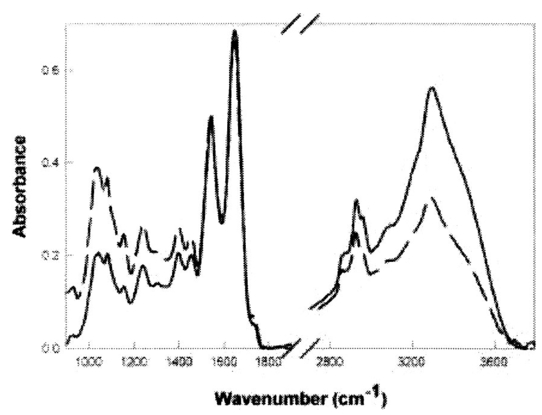 If one expects the wavelength dependent distortion of the absorbencies that arises from the wavelength dependence of the evanescent wave penetration in the sample, it is clear that the two spectra essentially convey the same information (Fig. 2). The results also clearly show that the spectral resolution attained in the case of the FEWS method is as good or even better than with the transmission mode. TAS optical fibers are, hence, well suited to collect both qualitative and semiquantitative data as obtained in the more current transmission mode. Biochemical imaging through infrared spectroscopy is attained by assigning vibrational frequencies to specific chemical groups which in turn go back to the very nature of the corresponding biomolecules like proteins, lipids, or nucleic acids. Sophisticated mathematical computing methods8 9 now allow resolving overlapping bands and interactively subtracting the strong absorption due to liquid water. Then, we studied IR signatures modifications in liver tumors. For this purpose, three C3He male mice received an injection of both diethylnitrosamine, a liver tumor inductor,10 and iron–dextran which induces a liver iron overload.11 12 The iron load of the liver was used to reveal microscopical proliferative lesions that exclude iron classically.13 After a few months all animals developed macroscopic liver tumors. One tumor from mice was selected and isolated from a macroscopically nontumoral area and both were directly frozen in liquid nitrogen. Histological studies indicate that selected tumoral areas were benign (adenoma) and that the nontumoral area contains only a few microscopic proliferative lesions (which represent a negligible part of the studied samples). Tumoral and nontumoral areas were then examined with our fiber sensor. Figure 3 displays the MIR spectra of nontumoral (solid line) and tumoral (dashed line) zones in the 1750–1600 and 3000–2800 cm−1 frequency domains corresponding to the carbonyl (proteins, lipids) and methylene, methyl (fatty acids) stretching vibrations, respectively. Figure 3FEWS IR spectra of tumoral and nontumoral mice liver tissues. MIR spectra of nontumoral (solid line) and tumoral (dashed line) tissues were collected in the FEWS mode in order to screen the spectral markers which must reveal the biochemical alterations characterising the tumoral process. The 1800–1700 cm−1 frequency domain (left) features the large carbonyl protein amide I band often used to resolve protein secondary structure along with a small peak showing up at 1735 cm−1 which arises from the membrane phospholipids ester bonds (see Ref. 14). In tumoral areas, the latter is drastically increased and shifted to 1746 cm−1 which corresponds to the C=O vibration in triglycerides (see Ref. 15). Besides, the 3000–2800 cm−1 frequency domain (right) features the fatty acids methylene and methyl symmetric and asymmetric vibrational bands. In normal tissues, the most prominent contribution to these bands arise from the membrane phospholipids. The large intensities observed in tumoral areas indicate that hepatocytes do accumulate lipids as a result of the tumoral process. Hence, the triglycerides accumulation within tumoral hepatocytes can warrant for the occurrence of strong absorbencies at 1746, 2850, and 2950 cm−1.  The CH 2 and CH 3 vibrations featured in the MIR spectrum (3000–2800 cm−1) of normal tissues mainly arise from membrane fatty acids whereas the slight shoulder occurring at ≈1735 cm−1 arises from the C=O ester bond which links the fatty acid chains to their charged moiety in phospholipids. The most prominent effects observed in the cells which have undergone the tumoral process are: (i) a dramatic increase in the fatty acids CH 3 and CH 2 vibrational bands, (ii) a 10 cm−1 upshift and a large increase in the C=O ester band showing up now at 1746 cm−1, which corresponds to the C=O vibration observed in triglycerides.15 Altogether, these two spectral alterations strongly suggest that a hepatic triglycerides accumulation, reflecting metabolic changes, has occurred during the tumoral process. Indeed, the presence of steatosis, suspected on hemalun eosin staining, was confirmed by O-red oil staining performed on a frozen liver section.16 Moreover, to assess that steatosis originates the observed spectral modifications, steatotic livers were investigated. They were obtained from three (18 weeks old) spontaneously obese male mice (ob/ob) which present a mutation in the leptin gene. Control nonsteatotic livers were obtained from two heterozygote (ob/+) mice, and three wild type mice, C57BL6, which both do not develop obesity and steatosis. The three steatotic livers exhibited similar modifications in their MIR spectra as observed in the tumoral samples. 4.ConclusionThis contribution is aimed at demonstrating that accurate local spectroscopic information can be obtained by FEWS technique as long as the design of the tapered fiber sensor is possible. This goal can be achieved by chemically and mechanically shaping the fiber in order to obtain a high sensitivity and a short (i.e., few millimeters) bending radius. Such a finger shape device may allow the physician to receive in vivo, on-line, local spectroscopic diagnosis at early stages of the disease. The use of unsupervised methods (principle component analysis) of analysis has also been successfully tested in identifying particular samples in the biomedical and microbiology domains. REFERENCES
U. Binding
,
W. Waesche
,
K. Liebold
,
H. Winter
,
U. M. Gross
,
P. Frege
, and
G. Mueller
,
“Tissue diagnostics using fiber optic FTIR Spectroscopy,”
Proc. SPIE , 3568 38
–45
(1999). Google Scholar
H. M. Heise
,
L. Kupper
,
W. Pittermann
, and
L. N. Butvina
,
“New tool for epidermal and cosmetic formulation studies by attenuated total-reflection spectroscopy using a flexible mid-infrared fiber probe,”
J. Anal. Chem. USSR , 371 753
–757
(2001). Google Scholar
J. Lucas
,
X. H. Zhang
,
K. Le Foulgoc
,
G. Fonteneau
, and
E. Fogret
,
“Non-oxide glasses for optical waveguide applications,”
J. Non-Cryst. Solids , 203 127
–134
(1996). Google Scholar
S. Hocde´
,
C. Boussard-Pledel
,
G. Fonteneau
,
D. Lecoq
,
H.-L. Ma
, and
J. Lucas
,
“Recent developments in chemical sensing using infrared glass fibers,”
J. Non-Cryst. Solids , 274 17
–22
(2000). Google Scholar
H. Dong
,
P. Huang
, and
W. S. Caughey
,
“Protein secondary structures in water from the second derivative amide I infrared spectra,”
Biochemistry , 29 3303
–3308
(1990). Google Scholar
D. Cameron
and
D. J. Moffat
,
“A generalized approach to derivative spectroscopy,”
Appl. Spectrosc. , 41 539
–544
(1987). Google Scholar
A. Buchmann
,
K. W. Bock
, and
M. Schwarz
,
“Enzyme and immunohistochemical phenotyping of diethylnitrosamine-induced liver lesion of male C3H/He, B6C3F1 and C57BL/6J mice,”
Carcinogenesis , 13 691
–697
(1992). Google Scholar
P. Carthew
,
R. E. Edwards
,
A. G. Smith
,
B. Dorman
, and
J. E. Francis
,
“Rapid induction of hepatic fibrosis in the gerbil after the parenteral administration of iron-dextran complex,”
Hepatology (Philadelphia, PA, U. S.) , 13 534
–539
(1991). Google Scholar
B. Turlin
,
D. Le Quilleuc
,
P. Leroyer
,
P. Brissot
,
Y. Deugnier
, and
O. Loreal
,
“High vascular endothelial growth factor (VEGF) expression in chemically-induced hepatic microcancers in mice,”
J. Hepatol , 37 620
–624
(2002). Google Scholar
N. Hirota
and
G. Williams
,
“The sensitivity and heterogeneity of histochemical markers for altered foci involved in liver carcinogenesis,”
Am. J. Pathol. , 95 317
–328
(1979). Google Scholar
M. Jackson
and
H. H. Mantsch
,
“Biomembrane structure from FT-IR spectroscopy,”
Spectrochim. Acta Rev. , 15 53
–69
(1993). Google Scholar
M. Jackson
,
J. R. Mansfield
,
B. Dolenko
,
R. L. Somorjai
,
H. H. Mantsch
, and
P. H. Watson
,
“Classification of breast tumors by grade and steroid receptor status using pattern recognition analysis of infrared spectra,”
Cancer Detect. Prev. , 23 245
–253
(1999). Google Scholar
|


CITATIONS
Cited by 70 scholarly publications and 2 patents.
Liver
Tissues
Tumors
Infrared spectroscopy
Glasses
Infrared radiation
Spectroscopy


