
|
|
1.IntroductionOne central goal in high-resolution light microscopy for biological and biomedical studies is to generate and enhance contrast between background signals and regions of biological interest. One important tool is to use fluorescent labels to produce this kind of contrast. With fluorescence microscopy, static and structural properties, as well as highly dynamic processes (e.g., calcium regulation or action potentials of excitable cells), can be imaged and measured. Various highly effective and specific techniques like confocal laser scanning microscopy, two- and three-photon microscopy,1 2 fluorescence resonant energy transfer (FRET),3 fluorescence recovery after photo bleaching (FRAP), and many more are now available and represent to some extent standard methods for a broad field of applications. These methods offer a detailed view of biological tissue with high spatiotemporal resolution, and have enabled a much deeper insight and understanding of intra- and intercellular signaling pathways and regulation processes. Recently, it has been shown that nonlinear optical effects like coherent antistokes Raman scattering (CARS)4 5 and second harmonic generation (SHG)6 7 8 9 provide powerful tools for biological light microscopy. In contrast to fluorescence, which is based on resonant transitions between electronic energy states of the fluorophore, CARS and SHG are nonlinear polarization effects of the illuminated matter, where photons are emitted without the need for a matched resonant electronic transition. However, the efficiency can be greatly enhanced if the energy of the transition is close to the energy difference of two electronic energy states of the illuminated matter. CARS and SHG have the same advantages as two-photon excitation. As they are nonlinear effects, they have an intrinsic high resolution in the axial direction, and are therefore capable of imaging slices in a 3-D volume with a very high axial and lateral resolution. Also, photobleaching and phototoxicity are confined to the focal spot, and much work is done to design and synthesize new chromophores with large cross sections for nonlinear optical effects. In the biomedical field, applications of SHG are of increasing interest. For example, many membrane-bound dyes are known to generate strong SHG signals. These dyes are designed to follow the potential across biological membranes with high dynamic resolution by a strong dependency of the SHG signal6 8 on the membrane potential. With this method it is possible to image the spatiotemporal changes and distribution of membrane potentials. Furthermore, potentials of intracellular membrane systems that are not accessible by other techniques like microelectrodes can be measured. Interestingly, it has been shown that strong intrinsic SHG signals are generated at highly ordered cellular structures,9 mostly originating from collagen and myosin. One major advantage of using these intrinsic SHG signals for imaging is the possibility to obtain structural information in living cells without the necessity to use exogenous labels for staining. Thus, if no other nonlinear effects like two-photon autofluorescence occur, the homeostasis of the cell is not biased by intrinsic SHG imaging. For example, when studying diseases that affect the structural properties of the cells, it is now possible to image structural pathological alterations in a fast and accurate way. Recently, it has been shown that myosin as an important intracellular structural protein complex generates a strong intrinsic SHG signal in preparations of whole muscle of mouse leg and C. elegans.,9 and in functionally intact and isolated single-muscle fibers.10 11 Thus, intrinsic SHG signals cannot only be recorded from extracellularly located collagen, but also from the intracellularly located structural protein complex actomyosin. Here we present the quantitative analysis of the intrinsic SHG signals recently demonstrated in physiologically intact isolated single mammalian skeletal muscle cells and isolated single myofibrils from M. extensor digitorum longus (edl) from BALB/c mice.10 11 Skeletal muscle cells have a highly ordered structure, as schematically shown in Fig. 1. They consist of many parallel cylindrical myofibrils with a diameter of about 1 μm, which are formed by the serial arrangement of many sarcomeres spanning from tendon to tendon. One sarcomere is the smallest contractile unit in a muscle cell. It is confined at both ends by the so-called Z disk and surrounded by the sarcoplasmic reticulum (SR), a membrane system that acts as a local calcium ion store.12 The physiological length of a sarcomere is about 2 to 3 μm, depending on the type of muscle. Force is produced by the adenosine triphosphate (ATP) consuming interaction of the contractile proteins actin and myosin. The actin filaments are connected to the Z disk and spread into the interior of the sarcomere. The myosin filaments are located between the actin filaments and consist of several hundred single myosin molecules, the motor proteins, that are ordered such that their heads are positioned at both ends of the bipolar filament. Actin and myosin form a hexagonal symmetry (see Fig. 1). During force production, the myosin filaments slide along the actin filaments in a manner where two opposing Z disks are moved toward each other. Thereby, the sarcomere length and the length of the whole muscle are shortened. To activate contraction, action potentials travel as electrical excitations of the surface membrane, the sarcolemma, via the transverse tubular system (TTS) consisting of tubular membrane invaginations into the interior of the muscle fiber, releasing Ca 2+ ions from the SR. In mammalian muscle, the TTS is located at both ends of the myosin filaments. Figure 1Structure of a mammalian skeletal muscle cell. Muscle cells consist of many parallel myofibrils composed of continuous serial chains of sarcomeres. The sarcomeres, the smallest physiologically intact contractile units, are confined by the Z disks and mainly consist of the contractile proteins actin and myosin. The myosin filaments are formed by several hundred myosin molecules, the motor proteins. The sarcomeres are surrounded by the sarcoplasmic reticulum (SR), the intracellular Ca 2+ -ion store. Contraction of the muscle cell is initiated by the release of Ca 2+ from the SR. To get a synchronized contraction of the whole muscle cell, invaginations of the outer cell membrane, the transverse tubular system (TTS), transmit the activation signal, the action potential, into the interior of the muscle cell. 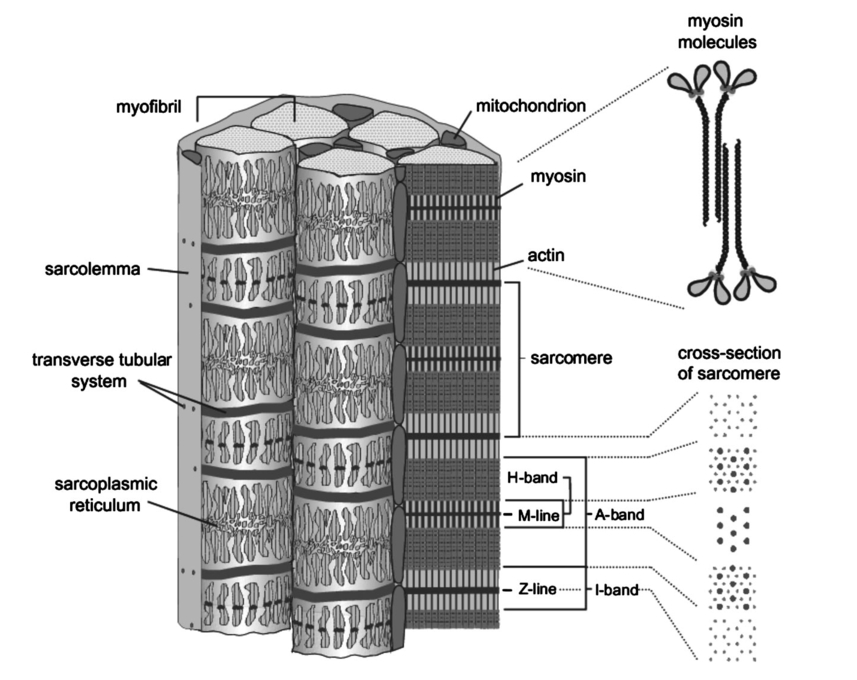 2.Physical BackgroundAs stated earlier, SHG is a nonlinear polarization effect in the illuminated matter. The incident light wave, as it is an oscillating electromagnetic field, polarizes the illuminated matter. The resulting oscillating dipoles emit a new lightwave. In the linear case, the generated lightwave has the same frequency as the incident lightwave, and both lightwaves are coherent. At high photon densities, nonlinear contributions for the polarization of matter have to be taken into account. The components of the resulting polarization P with the frequency ω can be expressed as13 14 where χ(n) is the n’th -order susceptibility, and the Ei are the components of the electrical field vector E of the incident light. Note that χ(n) is a tensor of the (n+1)’th order that describes how the incident and resulting electrical fields interact with each other. The summation over different ωn, ωm, and so on, indicate that several different incident lightwaves with different frequencies can be involved.For the most simple case with an isotropic medium (i.e., j=k) considering only one incident lightwave with frequency ω (i.e., no summation over ωn and ωm) , the second-order polarization P (2) can be obtained from Eq. (1) as This equation shows that for an incident optical wave with frequency ω, the resulting second-order polarization has a frequency component of 2ω. The oscillating polarization is the driving force for the generation of a new optical wave with frequency 2ω. This coherent upconversion is called second harmonic generation (SHG).One physical constraint can be directly seen from Eq. (1). As P and E are vector quantities, an inversion of all coordinates of the second-order term in Eq. (1) would lead to Equation (3) only holds for χijk (2)=0. That means that no SHG signal can be generated in a medium with spatial inversion symmetry. However, the symmetries allowing SHG are met for biological membranes, when only one leaflet is stained. Also, all helical molecules like α helices of proteins and nucleic acids meet this requirement. In particular, myosin molecules in skeletal muscle cells that consist of long α helices seem to have a large χ(2) generating a strong SHG signal.For a quantitative analysis of the SHG signal behavior in the direction of the incident polarization, we take an approach similar to Freund, Deutsch, and Sprecher.15 In particular, for the cylindrical symmetry that can be assumed for muscle fibers (C∞ symmetry), and the use of Kleinman symmetry, i.e., χijk can be permuted over all indices,16 the second-order polarization reduces to: Here, the direction of propagation of the laser beam is along the z axis, the y axis is the polar symmetry axis, and the x axis is perpendicular to the y-z plane. For relative measurements, the ratio is sufficient to describe the induced polarization. As this ratio is a property of a SHG emitting molecule and thereby structurally sensitive, it can in principle be used to distinguish between different molecular structures and arrangements.17 18In our experiments we measured the total intensity I SHG,total (which is proportional to P 2) of the second harmonic signal while varying the angle α between the fiber axis and the incident direction of polarization. From Eq. (4) one can obtain the following relation: This equation is used to fit the experimental results.Additionally, it can be found that the signal intensity per laser pulse i SHG scales as8 9 so that the total signal intensity I SHG is expected to scale as where p is the pulse energy, a is the area of the focused spot, τ is the laser pulse width, N is the number of scattering molecules, P avg is the average laser power, and f rep is the laser pulse repetition rate. From Eq. (8) it can be seen that a lower signal intensity by use of a picosecond (ps)-pulsed laser in contrast to a femtosecond (fs)-pulsed laser can be compensated by a larger average laser power.3.Methods and Materials3.1.Sample PreparationFor the experiments, muscle from male BALB/c and C57-SV129 mice was used. For biomedical relevance it should be noted that these strains are used as control animals for muscular disorders (e.g., Friedrich et al.;19). Animals were sacrifical according to the guidelines of the local ethics committee. Two preparations were examined: single dissected muscle fibers from extensor digitorum longus (edl) muscle and single isolated myofibrils from the same muscle. Single dissected edl fibers were fixed to silken threads on both ends. Within an experimental chamber, one thread was attached to a micrometer screw and the other one to a force transducer. The preparation was carried out in rigor solution (see next). For the experiments, permeabilized fiber preparations that allow strictly defined intracellular conditions (see also Uttenweiler et al.;20 and Kirsch et al.;21) were used. The fibers were chemically skinned inside the experimental chamber by a 2-min exposure to 100-μg/ml saponin in rigor solution (see next). After careful washing, the fibers were equilibrated with a solution mimicking the physiological intracellular ionic environment. During experiments, the sarcomere length could be adjusted by the micrometer screw from physiologically unstretched lengths of about 2.2 μm to more than 3 μm, depending on the individual fiber. For the preparation of single isolated myofibrils the following procedure was used. A whole edl muscle was fixed with insect pins on a petri dish coated with Sylgard (Dow Corning Corporation, Wiesbaden, Germany). All membranes were removed by a treatment of 1 Triton X100 (Boehringer Mannheim, Germany) in rigor solution (see next) for 4 h at 4°C. After washing in rigor solution, the muscle was homogenized with a mixer (Ultra-Turrax, IKA, Staufen, Germany) and single myofibrils were taken from the suspension and transferred to the experimental chamber. For preparations with labeled actin filaments, permeabilized cells were stained in intracellular solution with 6.5-μM BODIPY FL phallacidin (Molecular Probes Inc., Eugene, Oregon) for 20 min at room temperature. After staining and careful washing, the fibers were equilibrated with intracellular solution. Physiological solutions used were as follows. Mouse intracellular solution (mM): 5 glucose, 5 ATP, 5 creatine phosphate, 0.5 ethylene glycol-bis(2- aminoethylether)-N,N,N′,N′-tetracetic acid (EGTA), 10 Hepes, 140 potassium glutamate, 0.1 CaCl 2, and 5.5 MgCl 2. Mouse rigor solution (mM): 1 EGTA, 10 Hepes, 140 potassium glutamate, and 10 MgCl 2. For both solutions, the pH was adjusted to 7.0 with KOH. 3.2.Optical SystemOur SHG imaging system consists of a modified inverted microscope (Leica DM IRBE) with a confocal and multiphoton laser scanning unit (Leica SP2 MP). As an excitation source for SHG measurements and multiphoton excitation, we used a mode-locked ps-pulsed Ti:Sa-laser (Tsunami, Spectra Physics, Mountain View, California) that was tuned to 880 nm. The average laser power at the sample was chosen between 50 and 100 mW, and pulse duration was around 2 ps with a repetition rate of approximately 80 MHz (according to the specification supplied by the manufacturer), so that a peak power of 500 to 1000 W can be estimated for a Gaussian wave packet. According to Eqs. (7) and (8), we have compared these values to those that use fs-pulsed lasers (e.g., Campagnola et al.;,9 where τ=100 fs, P avg =1–50 mW, f rep =76 MHz, and λ=800 to 900 nm) , and thus expect the SHG signals to be of the same order of magnitude. The polarization of the beam at the back aperture of the objective was measured with a power meter (BeamMaster Si-7, Coherent Incorporated, Santa Clara, California) and a standard polarization filter, and was found to be at least 30:1. To ensure that different orientations of the scanning unit mirrors did not influence the linear polarization, this measurement was made in two orientation settings, one corresponding to a central spot in the object plane, the other corresponding to a spot at the border of the object plane. As SHG is a coherent process due to phase-matching conditions, the direction of the generated SHG signal has a strong dependency on the direction of the incident laser beam and the size of the sample.7 22 In the majority of cases, most of the generated SHG signal copropagates with the excitation laser beam. Therefore, the SHG signal is detected in a transmitted light configuration. For this purpose, two 63× water immersion objectives (PL APO 63×/1.20W CORR, Leica) were used in a symmetrical configuration on the excitation and transmission sides. A bandpass filter [450 nm, 50 nm full width at half maximum (FWHM)] was inserted into the transmission light path to block multiphoton (auto-)fluorescence. As there was no effective autofluorescence detected in unstained cells at 880-nm excitation wavelength, this filter was only necessary in experiments where the cells were stained with exogenous dyes. Also, a short-pass filter (650 nm) was inserted to block the incident laser beam. The SHG signal was detected by the standard nondescanned transmission photomultiplier tube (PMT) of the Leica SP2 MP setup (R6357, Hamamatsu). Potential backscattered second harmonic signal and stoke-shifted multiphoton fluorescence was imaged with the standard spectral detection unit in the descanned light path. The experimental setup is shown in Fig. 2. Figure 2Experimental setup for laser scanning SHG imaging. The setup is a modified Leica TCS SP2 confocal system, based on an inverted Leica DM IRBE microscope with a multiphoton extension. A second objective was inserted into the transmitted light path in a symmetric configuration to collect the SHG signal that is mainly generated in the forward direction. Also, a bandpass filter was inserted in the transmitted light path to block multiphoton excited fluorescence and a short-pass filter was inserted to block the incident laser beam. On the descanned light path, fluorescence and backscattered SHG were simultaneously acquired with the forward signal. The excitation laser was a ps-pulsed Ti:Sa laser (Tsunami, Spectra Physics) that was tuned to 880 nm. 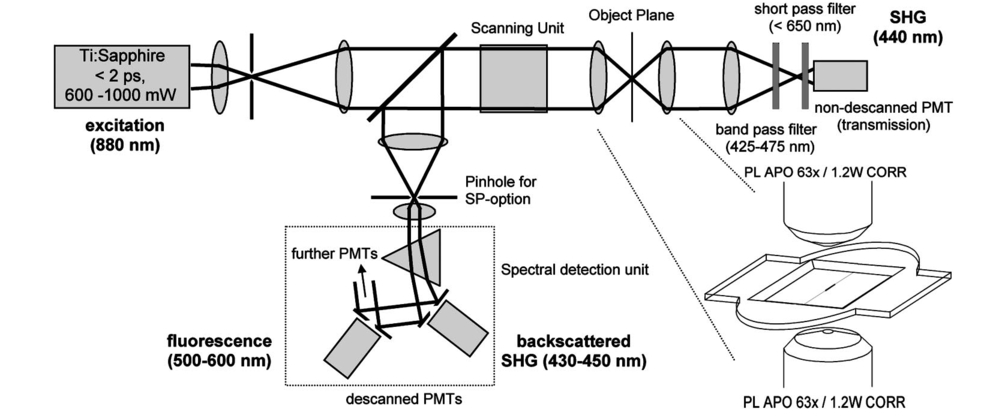 Images were acquired by x-y scanning. The dimensions of the x-y images were 512×512 pixels. The pixel size is 0.1163 μm using a zoom factor of 4 and 0.0145 μm using a zoom factor of 32, respectively. Acquisition times for an SHG image were around 1 s. We determined the point spread function (PSF) for two-photon excitation fluorescence at 880 nm of the setup experimentally using subresolution fluorescent beads (FluoSpheres, Molecular Probes) with a diameter of 100 nm. The fluorescence signal was collected on both sides, on the descanned light path and on the transmitted light path. The lateral and axial resolutions were measured as 397 nm±13 nm and 1251 nm±38 nm, respectively. As expected, no significant difference in magnitude and sensitivity could be determined between the two detection light paths. As the active volume, i.e., the volume in which SHG and two-photon excitation take place, may be defined identically,8 the PSF of SHG is not larger than the PSF measured before. From these considerations, we assume that the PSF of SHG has the same magnitude. 3.3.Image Analysis and ReconstructionScion Image software (Scion Corporation, Frederick, Maryland) was used to quantify the raw image data, e.g., intensity profiles used to derive the normalized maximum intensities. The 3-D reconstruction of a muscle fiber has been carried out with the Bitplane Imaris software (Bitplane AG, Zurich, Switzerland). The images shown in last in this work are based on a z stack of 105 SHG images, in total covering a volume of approximately 120×120×33.5 μm 3. The software reconstruction parameters (e.g., artificial light intensity, camera viewpoint) have been set so that the structural striation pattern of the original image data is not blurred or destroyed. 4.ResultsIn Fig. 3, three representative SHG images of unstained muscle cells at different magnifications are shown. To verify that the measured signal was subject to a nonlinear optical process, the laser was taken out of the pulsing mode, where no signal could be detected. Also, backscattered SHG signal and potential autofluorescence was monitored in all experiments on the descanned light path of the confocal scan head. In no experiment could a backscattered SHG signal be detected under our experimental conditions. Also, no autofluorescence could be observed. In experiments where exogenous dyes were used, two wavelength ranges (410 to 470 nm and 500 to 600 nm) were monitored on the descanned light path. The lower wavelength range was monitored to ensure that the signal measured on the transmission light path was entirely due to SHG and not due to two photon excited fluorescence (TPEF). The upper wavelength range was used to detect the fluorescence signal of the exogenous dye. In no experiment could cross talk between SHG and TPEF be observed. Figure 3Sample images of intrinsic SHG signals of skeletal muscle fiber preparations. Scale bars: (a) 25, (b) 10, and (c) 10 μm. The cell in (a) has a diameter of 63 μm and a sarcomere length of 3.8 μm. The cell in (b) has a diameter of 56 μm and a sarcomere length of 2.5 μm. (c) is a magnification of (b). Axial resolution is about 1.25 μm. The intrinsic signal periodically follows the striation pattern and reflects the intracellular structural properties of the muscle cells. Verniers, staircase-like structures [arrow in (c)] and interrupts are clearly resolvable even at low magnification and in the highly scattering thick samples. The arrowheads in (c) indicate a vernier: ten sarcomeres are positioned between the single arrowheads, whereas only nine sarcomeres are positioned between the double arrowheads.  The muscle cell in Fig. 3(a) has a diameter of 63 μm and the SHG signal has a periodicity of 3.85 μm. The muscle cell in Fig. 3(b) has a diameter of 56 μm and a periodicity of 2.53 μm. The intrinsic SHG signal appears to have a striation pattern similar to that of the sarcomeric structure of the skeletal muscle cell (see Fig. 1). Also, the distances between the bands are the same as between the sarcomeres. It turns out that the signal is positioned between the Z disks (compare Fig. 1) and originates from the actomyosin complex and/or the myosin molecules. This could be identified by comparing the location of the SHG signal with the location of the actin filaments, stained with BODIPY FL phallacidin (see Fig. 4). In Fig. 4(a) the fluorescence image of the stained actin filaments in a skinned muscle fiber is depicted. Figure 4(b) is an image of the intrinsic SHG signal at the same location. In Fig. 4(c) an overlap image of Figs. 4(a) and 4(b) is shown. The actin filaments are displayed in red, and the intrinsic SHG signal is displayed in green. Colocalization of the two signals at overlapping regions is indicated by the yellow color. The sarcomere length is 2.4 μm, the width of the intrinsic signal is 1.3 to 1.4 μm, and the width of the fluorescence signal is 0.6 and 0.9 μm, depending on where in the sarcomere it originates. This can be explained as follows. In intact myofibrils and whole muscle cells, phallacidin binds especially well at the tips of the actin filaments. This results in an effective staining of the Z line and the center of the sarcomere. From the sketch in Fig. 4(d) it can be seen that the signal from the center of the sarcomere is a little broadened, depending on the sarcomere length. To further confirm the location of the intrinsic signal, we compared the location of the A band of a myofibrillar sample in a laser scanning transmitted light mode [Fig. 5(a)] with the location of the intrinsic SHG signal [Fig. 5(b)]. The A band represents the location of the thick filaments23 24 and appears dark in Fig. 5(a). Figure 4(a) Image of phallacidin-stained actin filaments in a skinned muscle fiber. (b) Intrinsic SHG image at the same location of the preparation shown in (a). (c) Overlay image of image (a) (shown in red) and image (b) (shown in green). The sarcomere length of the cell is 2.4 μm, and the scale bar is 5 μm. The actin filaments were stained with phallacidin, which results in labeling the tips of the filaments. A relatively sharp signal (FWHM 0.6 μm) arising from the location of the Z line (arrow) and a somewhat blurred signal (FWHM 0.9 μm) originating from the center of the sarcomere (arrowhead) can be identified. The location of the intensity profile shown in (a) is marked by the double arrowhead. The explanation for the different FWHM values is shown in panel (d). At the given sarcomere length of 2.4 μm, the end tips of the actin filaments both at the Z disk and the center of the sarcomere are in close vicinity, so that the signals of the point-like chromophores (described by the PSF) overlap. The resulting image (red envelope) is different for the inner and the outer end tips of the actin filaments and yields the observed signal width. The intrinsic SHG signal originates from the location of the myosin filaments. FWHM of the intrinsic signal varies from 1.3 μm to 1.4 μm.  Figure 5Comparison between transmission light image and intrinsic SHG signal. (a) Laser scanning transmitted light image of isolated myofibrils. Note that the A bands representing the thick filaments appear dark. (b) intrinsic SHG image of the myofibrils. (c) Overlay image of Figs. 5(a) and 5(b). The intrinsic SHG signal is shown in green, and the inverted transmission image is shown in red. The inversion was done to obtain a yellow color at regions where the SHG signal is colocalized with the A band. The scale bar is 2.5 μm.  From the overlay image in Fig. 5(c) it is clear that the intrinsic SHG signal arises from the location of the thick filament. Similar results were found by Campagnola et al.;,9 who showed that the intrinsic SHG signal in C. elegans muscle is due to myosin by genetic studies and image analysis. From Fig. 3 it can also be seen that the SHG signal reflects the sarcomeric structure in an accurate way. Thus, using SHG imaging allows us to image structural properties of living skeletal muscle cells with high spatial and temporal resolution and without any exogenous label (see also Campagnola et al.;9). In the images, typical structural features of skeletal muscle cells can be seen. For example, several verniers are visible in both images, i.e., areas where a certain number of sarcomeres face one additional sarcomere.25 The physiological relevance of these verniers is still not fully understood, but intrinsic SHG imaging now offers a new and powerful tool to study their properties within living cells. Additionally, other structural features like interrupts in the Z-line morphology are visible even at low magnifications. Even in the thick and highly scattering sample of a whole muscle cell, subcellular and subsarcomeric details can be resolved by SHG imaging. In Fig. 3(a), an interruption can be seen, where the Z disks between two sarcomeres are separated. In Fig. 3(b), structures that resemble the side view of a staircase can be identified [see also Fig. 3(c)]. Because the intrinsic SHG signal is highly interesting for structural and functional physiological experiments and is modulated by specific properties of the specimen, the dependency of the signal on the sarcomere length of the muscle cell and on the direction of the polarization of the incident light beam was examined. Signal intensities and morphological characteristics of the signal were quantified and compared between whole cells and single myofibrils. In whole cell preparations, the signal intensity is strongly dependent on the sarcomere length. Starting from the unstretched physiological sarcomere length for mouse edl muscle of about 2.2 μm, the intensity of the signal shows a linear dependency on the sarcomere length and is saturated at sarcomere lengths greater than 3.3 μm (see Fig. 6). Over the entire range of sarcomere lengths studied, the signal amplitude increases by a factor of 4. In Fig. 6, areas of 5.6×22.0 μm within the same muscle cell at different sarcomere lengths are depicted. The width of the individual bands does not change with the sarcomere length and has an average FWHM of 1.31 μm±0.14 μm. The normalized maximum intensities of several muscle cells at different sarcomere lengths are plotted in the graph in the right part of Fig. 6. Additionally, the signal is strongly dependent on the polarization of the incident light beam. To quantify the dependency of the SHG signal on the polarization of the incident laser beam, images were taken with the cell arranged at different angles with respect to the linear polarized laser beam. The behavior of the signal intensity follows the relation derived in Eq. (6). The experimental results have been fitted with this equation and a relative strength of the two independent values of the χ(2) tensor was determined to be γ=0.39. Figure 6Effects of sarcomere lengths on the intrinsic SHG signal intensity. In the left part, areas 5.6×22.0 μm within the same muscle cell at different sarcomere lengths are shown. The FWHM of the individual bands does not change with the sarcomere length, but the total signal intensity shows a linear dependency on the sarcomere length, starting from unstreched sarcomere lengths of about 2.2 μm, and is saturated for sarcomere lengths greater than 3.3 μm. Over the whole range, the intensity increases four fold. In the right part of the figure, normalized intensities of five individual muscle cells are plotted against the sarcomere length.  Physically, the gamma factor describes how the x and y components of the incident laser light contribute to the emitted y component of the SHG signal. With a gamma factor smaller than 1, incident light polarized in the x direction contributes more to the y component of the emitted SHG signal than does the incident y component itself, similar to the different effect of linear birefringence. The gamma factor itself is a property of the scattering molecules and can, in principle, be derived from their structure.17 Furthermore, together with structural models, it can help to explore the orientation distribution in the sample.9 18 For muscle preparations, this will be part of future investigations. In Fig. 7 areas of 5.60×22 μm within the same muscle cell at different angles from −1 to 180 deg are depicted. Again, only the maximum intensities change but not the width of the signal. The normalized maximum intensities and the fit from Eq. (6) are plotted in the right graph of Fig. 7. Figure 7Effects of polarization angles on the SHG signal intensity. In the left part, areas 5.6×22.0 μm within the same muscle cell at different angles of the incident polarization with respect to the fiber axis are shown. The definition of the angle α is given in the image on the lower left. The FWHM of the individual bands does not change with the angle, but the total signal intensity shows the dependency derived in Eq. (6). In the right part of the figure, the normalized total signal intensities and the fit from Eq. (6) are plotted against the angle. From the fit, the ratio of the two independent values of the χ(2) tensor was determined to be γ=0.39.  To further investigate the source of the SHG signal, we imaged single isolated myofibrils. The myofibrils show a similar striation pattern to the whole cell preparation, but an additional loss in signal intensity at the center of each SHG band can be observed, which can only rarely be observed in whole cell preparations. This is due to less scattering in the far smaller sample, so that the resulting effective optical resolution is better for single myofibrils compared to entire cells. The central stripe was also found in C. elegans muscle.9 In single myofibrils from mouse edl muscle, this dip has a width of 0.35 μm±0.04 μm and an average signal loss to 64±10 of the maximum intensity. The average diameter of the myofibrils was 0.89 μm±0.19 μm. The average width of the SHG signal in all imaged myofibrils was 1.40 μm±0.06 μm. Interestingly, single isolated myofibrils show a marked difference in signal behavior compared to whole cell preparations. Their dependency on both the sarcomere length and the polarization angle is strongly suppressed. The sarcomeres of the myofibril in Fig. 8(b) have different sarcomere lengths. Nevertheless, there is no significant difference in signal intensities between the sarcomeres. Also, the shape of the signal does not change. Different signal intensities between different myofibrils or sarcomeres seem to be rather due to the diameter of the individual myofibrils, and therefore due to the amount of proteins within the imaged volume, than their sarcomere length. As the diameter of a myofibrillar sample (typically around 0.9 μm) is smaller than the axial dimension of the PSF (∼1.25 μm), the signal intensity is highly dependent on the amount of SHG generating proteins within the myofibrils. This fact is even more pronounced as the SHG signal intensity is proportional to the square of the number of scatterers. This can be seen by comparing the right myofibril in Fig. 8(c) and the myofibril in Fig. 8(d). The diameter of the right myofibril in Fig. 8(c) is 0.60 μm, and the diameter of the myofibril in Fig. 8(d) is 0.81 μm. As the FWHM of the signal parallel to the fiber axis in Fig. 8(c) is 1.45 μm and 1.42 μm in Fig. 8(d), the volume is roughly quadratically dependent on the diameter, and therefore the signal intensity should go with the fourth power of the diameter. Thus, we have compared the signal intensities of the individual myofibrils at the points where the signal is maximal. Our rough estimate yields a theoretical ratio of 3.32. However, a smaller value should be expected because of the diffraction-limited intensity distribution of the illumination spot. The measured signal at the maximum is due to the convolution of the PSF with the density distribution of the scattering molecules. As the illumination PSF has a Gaussian-like profile in all three dimensions, scatterers that are further away from the center of the illumination spot contribute less to the total signal than scatterers located at the center. Thus, the additional volume of the thicker sample contributes less to the total signal intensity, and a ratio of less than 3.32 is expected, which is in good accordance to the measured ratio of 1.97. Figure 8SHG signals from single isolated myofibrils. (a) The dimensions of a myofibril within a whole cell (between the arrows) and a single isolated myofibril are depicted. (b) through (e) show four individual single isolated myofibrils. All scale bars are 2.5 μm. The myofibrils have an average diameter of 0.89 μm±0.19 μm (N=33). The intensity distribution of the signal parallel to the myofibril axis has an average FWHM of 1.40±0.06 μm (N=33). In the center of the signal, a loss in signal intensity can be observed (see arrow). This dip has a FWHM of 0.35 μm±0.04 μm and an average signal loss to 64±10 of the maximum signal intensity.  That means that the signal behavior on sarcomere lengths in whole cell preparations is rather due to the structure on the level of the myofibrils and their arrangement with respect to each other than on the sarcomeric level. One possibility is that the structure of the myofibrils works as a grating leading to diffraction and interferences, and thus affects the measured SHG signal intensities. Also, as the axial FWHM of the PSF is large enough to include two or more myofibrils, the rise in signal intensity with larger sarcomere lengths might reflect structural differences between unstretched and stretched whole cell preparations. Another explanation would be due to the known fact that the packing of the thick filaments is denser in stretched muscle cells. As an example, one of the fibers used for the plot in the right panel in Fig. 6 shows a decrease in diameter from 60 μm (at 2.2-μm sarcomere length) to 51 μm (at 3.3-μm sarcomere length). The concentration of scatterers per volume is therefore increased by 1.38 and the signal intensity should raise by a factor of 1.92. However, this alone is not sufficient to explain the measured raise by a factor of 4. This is an indication that there are several effects involved in the dependency of the signal intensity on the sarcomere length. The intrinsic signal can also be used as a basis for a reconstruction of the structure of a physiologically intact muscle cell. In Fig. 9(a) the reconstruction of a whole muscle cell based on its intrinsic SHG signal is depicted. The acquisition time for the stack of 105 images was less than 5 min. As can be seen from the figures, all the structural features inherent to muscle cells can be clearly observed in the 3-D view, and can be analyzed in their native context. As an example, Figs. 9(b) and 9(c) show details of these structural features—staircase-like structures and a spiral staircase structure—as previously described by Peachey.25 Figure 93-D reconstruction of a muscle cell. The reconstruction has been carried out using a z stack of 105 xy images of intrinsic SHG. The distance between individual xy planes was 0.33 μm. Scale bars are (a): 10 μm; (b): 5 μm; and (c): 5 μm. (a) The reconstruction volume was 120×120×33.5 μm 3. The image shows a section of 20 sarcomeres each 2.0 μm in length. The diameter of the cell is 20 μm at the center of the image. (b) Magnified section of the same cell as in (a). The clipping focuses on the staircase-like structure (see text for details). (c) Magnified section of the same cell as in (a). The clipping focuses on a spiral staircase-like structure. The 3-D character of the data is much clearer than in the 2-D representations (compare Fig. 3).  5.DiscussionModern high-resolution linear and nonlinear techniques for optical microscopy offer novel methods for probing functional and structural properties of living cells. One important goal is to improve the existing techniques and to develop new ones. We have presented a detailed description of the instrumentation and application of a high-resolution laser scanning SHG microscope for the cellular and subcellular structural study of muscle cells using intrinsic SHG signals. The SHG microscope is modified from a multiphoton laser scanning microscope with a picosecond Ti:Sa laser as an excitation source. The forward SHG signal and both backscattered SHG and backward two-photon excited fluorescence are recorded simultaneously with a symmetric configuration of two 63×1.2 NA water immersion objectives. Image acquisition time was around 1 s for images of 512×512 pixels. From our measurement of the intrinsic SHG signal at different sarcomere lengths, from measurements of the location of the signal with respect to stained actin filaments and from transmitted light microscopy images, we conclude that the signal is generated at the location of the thick filaments. Similar results were found by Campagnola et al.;9 for muscle in C. elegans. Thick filaments consist of the motor protein myosin. In whole cell preparations, the intrinsic SHG signal is strongly dependent on the sarcomere length and on the orientation of the cell symmetry axis with respect to the direction of the polarization of the incident light. As SHG is highly dependent on orientation and symmetries, this might reflect structural properties of the contractile proteins. The orientation of the motor domains of the myosin molecules are dependent on their physiological state26 and might modulate the generated SHG signal and/or the values of the two independent second-order susceptibilities, and thereby the gamma factor [see Eq. (5)]. This would be a powerful tool to noninvasively probe the functional state of motor proteins in situ. With SHG it is now possible to image the structural properties of skeletal muscle cells in a fast and accurate way. The acquisition of image stacks used for a complete 3-D reconstruction of the intracellular structures can be done within minutes, and morphological features like verniers and staircase structures can be imaged even at low magnification and in highly scattering thick samples. Other techniques for structural imaging used so far have certain disadvantages. Using electron microscopical techniques, the sample has to be fixed and sliced into fine or ultrafine sections for transmission electron microscopy (TEM), or frozen or fractured for scanning electron microscopy (SEM). Obviously, TEM or SEM do not allow direct time-resolved functional imaging or physiological measurements in situ. With fluorescence microscopy, exogenous labels have to be introduced, which disturb the cellular environment and are subject to photobleaching and phototoxic effects. Transmitted light microscopy does not have these drawbacks, but lacks axial resolution to give a detailed 3-D view of the cell. Thus, intrinsic SHG imaging can be used as a complementary method to fluorescence imaging to allow a colocalization of intracellular structure and function without adding additional exogenous labels that would further alter the homeostasis of the cell. As the acquisition times for the intrinsic SHG signals are in the same range as fluorescence, even fast dynamic processes in the submillisecond range can be studied. Further, 3-D SHG imaging of sarcomeric structures can directly be combined with quantitative cellular electrophysiological recording techniques, e.g., patch clamp and microelectrode voltage clamps, or with high-resolution fluorescence imaging of subcellular processes like, e.g., elementary calcium release events (ECRE)21 or the longitudinal spread of excitation in the TTS of mammalian skeletal27 or cardiac28 muscle cells. A particular advantage is also the possibility to combine 3-D SHG of muscle tissue with the subcellular release of caged compounds, e.g., caged Ca 2+, which is another powerful multiphoton application.29 Such simultaneously acquired datasets of high spatial and temporal resolution are absolutely essential for a quantitative analysis and mathematical modeling of complex intracellular regulatory processes30 involving anisotropic diffusion, compartmentalization, and specific binding of ions during excitation-contraction coupling and Ca 2+ regulation of muscle in general.12 Furthermore, cellular and subcellular structural morphological alterations due to, e.g., neuromuscular disorders or cardiomyopathies, could be detected with 3-D SHG imaging of muscle samples without the need of exogenously applied fluorescent labels or elaborate fixation and sectioning techniques, e.g., for immunofluorescence microscopes and TEM. 6.ConclusionIn summary, laser scanning SHG microscopy is a powerful tool that allows structural imaging of unstained living heart and skeletal muscle cells and tissues. In combination with laser scanning confocal or two-photon microscopy, it generates signals that yield complementary information to the fluorescence data. Due to its strong dependency on symmetries, it provides information about orientation and organization of the contractile proteins, and might therefore even yield functional information of the physiological state of the specimen. Additionally, this method applies very well to studies where the knowledge of the subcellular 3-D structure is crucial for the quantitative analysis of the experimental data, e.g., experiments in conjunction with mathematical modeling that strongly rely on the underlying intracellular geometry. Also, SHG imaging can be used for studies involving anomalous structures that can be expected in certain myopathies. AcknowledgmentsThis study was supported by BMBF 13N7871 and partly by DFG FOR 240/3-1. Author Both is a scholarship holder at the Post Graduate School of Biotechnology (GK 388) funded by the DFG. Authors Both and Vogel contributed equally to this work. REFERENCES
W. Denk
,
J. H. Strickler
, and
W. W. Webb
,
“Two-photon laser scanning fluorescence microscopy,”
Science , 248 73
–76
(1990). Google Scholar
S. Maiti
,
R. M. Williams
,
J. B. Shear
,
W. R. Zipfel
, and
W. W. Webb
,
“Measuring serotonin distribution in live cells with three-photon excitation,”
Science , 275 530
–532
(1997). Google Scholar
T. Fo¨rster
,
“Zwischenmolekulare Energiewanderung und Fluoreszenz,”
Ann. Phys. (N.Y.) , 437 57
–75
(1948). Google Scholar
M. D. Duncan
,
J. Reintjes
, and
T. J. Manuccia
,
“Scanning coherent anti-Stokes Raman microscope,”
Opt. Lett. , 7 350
–352
(1982). Google Scholar
A. Zumbusch
,
G. R. Holtom
, and
X. S. Xie
,
“Three-dimensional vibrational imaging by coherent anti-Stokes Raman scattering,”
Phys. Rev. Lett. , 82 4142
–4145
(1999). Google Scholar
P. J. Campagnola
,
M. Wei
,
A. Lewis
, and
L. M. Loew
,
“High-resolution nonlinear optical imaging of live cells by second harmonic generation,”
Biophys. J. , 77 3341
–3349
(1999). Google Scholar
W. R. Zipfel
,
R. M. Williams
,
R. Christie
,
A. Y. Nikitin
,
B. T. Hyman
, and
W. W. Webb
,
“Live tissue intrinsic emission microscopy using multiphoton-excited native fluorescence and second harmonic generation,”
PNAS , 100
(12), 7075
–7080
(2003). Google Scholar
L. Moreaux
,
O. Sandre
,
S. Charpak
,
M. Blanchard-Desce
, and
J. Mertz
,
“Coherent scattering in multiharmonic light microscopy,”
Biophys. J. , 80 1568
–1574
(2001). Google Scholar
P. J. Campagnola
,
A. C. Millard
,
M. Terasaki
,
P. E. Hoppe
,
C. J. Malone
, and
W. A. Mohler
,
“Three dimensional high-resolution second-harmonic generation imaging of endogenous structural proteins in biological tissues,”
Biophys. J. , 82 493
–508
(2002). Google Scholar
M. Both
,
W. G. Kirsch
,
D. Uttenweiler
, and
R. H. A. Fink
,
“An intrinsic SHG-signal in adult amphibian skeletal muscle fibers,”
Pfluegers Arch. , 443 5336
(2002). Google Scholar
M. Both
,
M. Vogel
,
R. H. A. Fink
, and
D. Uttenweiler
,
“Second harmonic generation imaging in muscle fibers,”
Proc. SPIE , 5139 112
–120
(2003). Google Scholar
I. Freund
,
M. Deutsch
, and
A. Sprecher
,
“Optical second-harmonic, cross-beam summation, and small-angle scattering in rat-tail tendon,”
Biophys. J. , 50 693
–712
(1986). Google Scholar
D. A. Kleinman
,
“Nonlinear dielectric polarization in optical media,”
Phys. Rev. , 126 1977
–1979
(1962). Google Scholar
V. Ostroverkhov
,
K. D. Singer
, and
R. G. Petschek
,
“Second-harmonic generation in nonpolar chiral materials: relationship between molecular and macroscopic properties,”
J. Opt. Soc. Am. B , 18
(12), 1858
–1865
(2001). Google Scholar
S. Roth
and
I. Freund
,
“Second harmonic generation and orientational order in connective tissue: A mosaic model for fibril orientational ordering in rat-tail tendon,”
J. Appl. Crystallogr. , 15 72
–78
(1982). Google Scholar
O. Friedrich
,
T. H. Ehmer
, and
R. H. A. Fink
,
“Calcium currents during contraction and shortening in enzymatically isolated murine skeletal muscle fibres,”
J. Physiol. (London) , 517
(3), 757
–770
(1999). Google Scholar
D. Uttenweiler
,
C. Weber
, and
R. H. A. Fink
,
“Mathematical modelling and fluorescence imaging to study the
Ca2+
-turnover in skinned muscle fibres,”
Biophys. J. , 74 1640
–1653
(1998). Google Scholar
W. Kirsch
,
D. Uttenweiler
, and
R. H. A. Fink
,
“Spark- and ember-like elementary
Ca2+
release events in skinned fibres of adult mammalian skeletal muscle,”
J. Physiol. (London) , 537
(2), 379
–389
(2001). Google Scholar
J. Mertz
and
L. Moreaux
,
“Second-harmonic generation by focused excitation of inhomogeneously distributed scatterers,”
Opt. Commun. , 196 325
–330
(2001). Google Scholar
H. E. Huxley
and
J. Hanson
,
“Changes in the cross-striations of muscle during contraction and stretch and their structural interpretation,”
Nature (London) , 173 973
–976
(1954). Google Scholar
J. Hanson
and
H. E. Huxley
,
“Structural basis of the cross-striations in muscle,”
Nature (London) , 172 530
–532
(1953). Google Scholar
L. D. Peachey
,
“The sarcoplasmic reticulum and transverse tubules of the frog’s sartorius,”
J. Cell Biol. , 25 209
–232
(1965). Google Scholar
C. Ruegg
,
C. Veigel
,
J. E. Molloy
,
S. Schmitz
,
J. C. Sparrow
, and
R. H. A. Fink
,
“Molecular motors: Force and movement generated by single myosin II molecules,”
News Physiol. Sci. , 17 213
–218
(2002). Google Scholar
G. S. Posterino
,
G. D. Lamb
, and
D. G. Stephenson
,
“Twitch and tetanic force responses and longitudinal propagation of action potentials in skinned skeletal muscle fibres on the rat,”
J. Physiol. (London) , 527 131
–137
(2000). Google Scholar
M. M. Kirk
,
L. T. Izu
,
Y. Chen-Izu
,
S. L. McCulle
,
W. G. Wier
,
C. W. Balke
, and
S. R. Shorofsky
,
“Role of the transverse-axial tubule system in generating calcium sparks and calcium transients in rat atrial myocytes,”
J. Physiol. (London) , 547 441
–451
(2003). Google Scholar
P. Lipp
and
E. Niggli
,
“Fundamental calcium release events revealed by two-photon excitation photolysis of caged calcium in Guinea-pig cardiac myocytes,”
J. Physiol. (London) , 508 801
–809
(1998). Google Scholar
D. Uttenweiler
,
W. G. Kirsch
,
E. Schulzke
,
M. Both
, and
R. H. A. Fink
,
“Model based analysis of elementary
Ca2+
-release events in skinned mammalian skeletal muscle fibres,”
Eur. Biophys. J. , 31 331
–340
(2002). Google Scholar
|


