
|
|
1.IntroductionImportant achievements in magnetobiology and biomedical physics during last decades have changed our understanding of the biophysical mechanisms of processes in living systems. Recently, the particle-separation biotechnology was developed and has become an important branch of immunodiagnostics. Magnetic separation and magnetophoresis had been applied mainly in cellular assays for removing in gradient magnetic fields of labeled particles, immunomagnetic beads, and targeted antigens.1 For weakly magnetic particles, diamagnetic and paramagnetic ones, the high gradient magnetic separation was developed for industrial purification2, 3, 4, 5, 6 and the technological analysis of particles and cells.4, 5, 6, 7, 8 The other important application of high magnetic fields is an alignment method for macromolecules and biomicroparticles, combined with other techniques,9 which enables the detection of the diamagnetic structure of anisotropic particles. In both directions, the physical-chemical backgrounds of methods are connected with the concentration processes of biomacromolecules, which are the subject of research also using the methods of colloidal chemistry, and optical methods, namely, polarization microscopy and light scattering.10, 11, 12, 13, 14, 15, 16 In this paper, the high-gradient magnetic separation (HGMS) method shows the concentration process of macromolecules of nucleoprotein, ferritin, and blood cells, and the approach developed with polarization microscopy reveals phase transitions for DNA protein granules. Nucleoprotein granules (DNA granules called Bonghan granules) investigated in this study are suggested as messengers in the acupuncture meridian system and sensitive biosensors working on the basis of optical changes under physical acts.17, 18 The separation accumulation of biological particles in HGMS enables the determination of diamagnetic susceptibility.19, 20, 21 The coexistence of isotropic, cholesteric, and smectic phases introduced for colloidal suspensions studies,9, 10, 11 appeared in our study as the coexistence of a sign variety in magnetic susceptibilities. The protein affinity adsorption and the nucleoprotein alignment during a magnetic aggregation in a high-gradient magnetic field are analyzed. Magnetic drifts, shifts, and vibrations of micro-objects such as cells, organelles, and cellular depositions with respect to other always occur in an organism under even weak magnetic fields, which penetrate inside the body almost without distortion.5, 21 In magnetotherapy treatments, alternative gradient magnetic fields (with value of the order of to ) enforce ferritin cores, hemosiderin, etc. to aggregate inside the human body followed by vibrations, increasing the oxidative exchange. Ferritin inside mitochondria, hemosiderin bound with macrophages, FeS clusters bound with mitochondria or sideroblasts—all these complexes may possibly vibrate and drift under the magnetotherapy procedure. Measurements were performed for magnetic drifts of ferritin near to hemosiderin depositions will be useful for modeling magnetotherapy. 2.Methods2.1.Observation SystemTo observe the concentration phase transitions in cells and nucleoprotein particles (granules) and their aggregates in a high-gradient magnetic field, ferromagnetic wires were positioned in the visual field of the inverted and reflected microscopes supplied with a CCD camera. The external field intensity was , with a gradient value on the wire surface . The HGMS observation chamber was made of a very thin rectangular glass tube or plastics cuvette . A very thin capillary was used for the observation of blood cell sedimentation in a dense medium such as diluted (by a factor 10 to 100) whole blood. In the sample hermetic cell, a ferromagnetic nickel wire with a radius of 10, 15, 50, 163, or was mounted in the axial configuration (gravity force parallel to wire axis, and field perpendicular to flow and wire19, 20, 21) as Fig. 1(a) demonstrates. Fig. 1Experimental system of permanent magnets combined with ferromagnetic wires to create a localized high-gradient magnetic field: (a) scheme of the experiment, mutual displacement of the observed cell and the magnetized wire in the external magnetic field ; (b) simulated magnetic field intensity for the magnets by size ; (c) the polarization microscopy combined with a high-gradient magnetic field.  The external steady magnetic field created by the structure of permanent pieces containing the “open domain boundary” is presented in Fig. 1(b). The distribution of magnetic field intensity was simulated according to the equation: , where is the length of a single permanent magnet piece. The movement of single particles was observed using a microscopy system combined with a CCD camera shown in Fig. 1(c). The process of time measurements on successive radial coordinate intervals from the initial position of the particle to the end point (where is the radius of the wire), enabled to the capture motion parameter—the traveling time on intervals. The viewing field in the vicinity of the wire was calibrated using NI Vision Assistant 7.0 software to provide the particles size dimensions, the luminance intensity, and a coordinate scale along the particles trajectory. The magnetic susceptibility of single cells was calculated from experimental dependence of the coordinate function via the capture time near a ferromagnetic wire, a saturation magnetization of wires consisted . The nucleoprotein granules (Bonghan granules, or DNA granules) of a rabbit were extracted by the method described in Ref. 17. Human red blood cells (RBCs) diluted by a factor of 100 by phosphate buffer (PBS) (pH 7.4) were separated by a settling procedure to obtain small cells in diameter. The ferritin particles were horse spleen ferritin commercially produced by “Reanal,” and the buffer used was10 PBS. Shrimps eggs (from Russian lakes) were incubated in 0.5% NaCl solution for . 2.2.Affinity ProceduresThe successive procedures of the present method were described in Ref. 20 to obtain Sepharose 4B beads (control 1 and control 2) and to immobilize the macromolecular ligands in their meshes, which included the incubation of beads with the ligand samples or the injection of a sample through an affinity minicolumn; the submerging of the loaded beads into the glass cell containing the Ni wire or a narrow gap of magnetic poles; and the obtaining of the magnetic parameters: capture traveling time (using HGMS), initial buildup radius , capture radius , and saturation accumulation radius (Refs. 8, 19, 20, 21). Table 1 demonstrates the used ranges of the biotechnological procedure values used for tests of the macromolecular ligand concentration within the meshes of porous agarose beads.8, 14, 20 Table 1Methods of affinity ligand detection.
2.3.Preparation of Agarose Immuno-BeadsSepharose 4B beads with 4% (volumetric percent) of adsorbent net particles (“Pharmacia”) crashed to diameters of were prepared for the ligand immobilization according to the conventional Br-CN-activated procedure.8, 14, 20 The adjusted optimization of the magnetic susceptibility values was reached by the shaking of clear beads in HCl solution for 5 and to obtain control 1 and control 2, respectively, at . The immobilized single macromolecular layer was covalently bound to agarose beads after incubation in saline solution PBS . Such ligands were bovine serum albumen (BSA), egg albumen (Alb), human immunoglobulin G (Ig G), and “Serva.” Double layers were presented by antigen (Ag) to antibody (Ab) pairs: IgG and goat antihuman immunoglobulin G or as prepared.8, 14 To prevent the nonspecific binding processes, which are less common for an affinity sorbent such as agarose, BSA and 0.02% Tween 20 were added to the samples. Micro-enzyme-linked immunosorbent assay14 (micro-ELISA) enabled us to determine the content of the linked protein on the beads to calibrate the suggested method. Thus, of freshly prepared conjugates of diluted peroxidase-labeled secondary antibodies were added to tested suspension of beads in saline buffer on a micro-ELISA plate. After shaking for , the reaction with peroxidase substrate (o-phenylenediamine) and 0.5% was run and interrupted by of 50% after . The yellow color of the probes was measured by a micro-ELISA plate reader MR 580 at . The absorption measurements of protein concentrations in liquid were carried out with the Hitachi spectrophotometer at . 3.ResultsThe buildup process on the wire was theoretically and experimentally studied for new particles: nucleoprotein granules, ferritin aggregates, and blood cells. The saturation accumulation radius of buildup layer on the wire was independent of particles sizes8 in an axial configuration and a vertical wire. In the axial case, the cylindrical symmetry imposed parallel to a wire produces equations with analytical solutions for the motion of the particle with the plane of the wire magnetization,2, 8 as Fig. 1(a) shows. The equations of motion in the plane are whereHere is for para/ferromagnetic capture and for diamagnetic capture; a and b are the wire and particle radii, respectively.Integrating the second motion Eq. 1 along a trajectory from point to one can get the time of particle movement: where for , is determined from the equation of trajectory, as in the following.The equation describing the trajectory obtained from the equations of the motion of Eq. 1 is where and are determined by the initial position of the particle in the plane. For a given trajectory, all particles passing the same distance interval demonstrated the reverse dependence of their magnetic susceptibility; two trajectories are indicated in Fig. 1(a).The magnetic susceptibility can be obtained from the equality of the ponder-motive force and the Stokes drag force: where and are the susceptibility of the particles and the fluid; is the viscosity coefficient; and and are the velocity and volume of the particle, respectively. For a cylinder magnetized in the field, the solution of the scalar potential equation by Laplace gives wherewhere and are azimuth angle coordinates for initial and ending positions, and and are found according to Eq. 2. Assuming the azimuthal angle of the particle with the plane of the wire’s magnetization to be zero, the equations of motion can be integrated using Eq. 2, which can be written aswhere ; is the normalized coordinate; is the traveling time of the particle from position to ; and is the saturation magnetization of the wire in an applied magnetic field perpendicular to the axis of the wire having radius . The relative magnetic susceptibility can be calculated from the magnetic velocity by2The magnetic moments of single red blood cells in oxygenated, met-hemoglobin, and deoxygenated states of containing hemoglobin can be determined with 10% error, as Table 2 shows. The magnetic movement speeds of red blood cells in oxygenated state near wires are shown in Fig. 2 . Fig. 2Human red blood cells used for single cell measurements under diamagnetic capture along diamagnetic trajectories; values are proportional to magnetic susceptibility values.  Table 2Magnetic moments of bioparticles in H0=1kOe .
One can estimate the molar magnetic susceptibility of oxyhemoglobin assuming a contamination of red blood cells , a hemoglobin density of , and a molecular weight value : , for deoxy-Hb: , for MetHb: . Using the Curie law, so for high-spin (five unpaired electrons) states of -hemes in methemoglobin: , in deoxy-hemoglobin: .Figure 2 shows capture time measurements for red blood cells moving along one trajectory to diamagnetic region of the wire. The linear dependencies of the coordinate function on time were used to determinate the magnetic susceptibility of single cells. Experimentally measured capture time for immunoparticles moving on the same trajectories are presented in Fig. 3 via the concentration of bound protein BSA, immunoglobulin, and antigen-antibody complexes (immunoglobulin G goat antibody). Fig. 3Capture time for immunoparticles moving on the same trajectories via the concentration of bound-protein BSA, immunoglobulin, and antigen-antibody complexes; the immunoglobulin G is goat antibody. 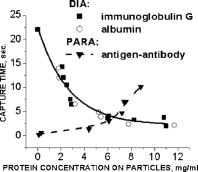 Figure 4 illustrates typical curves of diamagnetic capture of immunobeads with concentration of bound protein as a parameter, capture time via particle diameters, followed an exponential fitting dependence. Fig. 4Typical curves of diamagnetic capture of immunobeads with the concentration of bound protein as a parameter.  The nucleoprotein granules submerged in a high-gradient magnetic field appeared to aggregate under accumulation to the wire (Fig. 5 ). The fact of saturation accumulation of the build-up process on the wire is illustrated by the curve in Fig. 5, obtained for cylindrical droplet growth (photo in Fig. 5). Fig. 5Magnetic accumulation of nucleoprotein granules (nucleosome core particles) droplet on a wire. The buildup process is fitted by a third-order polynomial and a sigmoid dependence: a dependence of the accumulation radius on time during growth of the rodlike granule droplet; the photo is of a DNA granule droplet accumulated on a -diam wire. 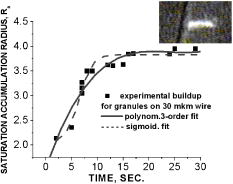 The initial equation for the growth of a cylindrical droplet (with mass and the base area ) for time along the radial coordinate direction is where the velocity of particles is described by the first equation in Eq. 1 with . Because the exact Stokes drag force12 is given by , where represents spherical particles and is 1, and is the velocity of the particle, the growth of a cylinder of nucleoprotein granules on wire is described byWith , we getThe obtained parameter value reflects the nonspherical shape of the DNA granules. The good sigmoid fitting shown in Fig. 5 could mean the cooperative behavior of granules having induced diamagnetic moments and attracting each other, but the polynomial fitting was the best. The sensing principle for the biosensor was defined by Cullum and Vo-Dinh15 as a device that consists of a receptor and a transducer, placed in the sample environment, where the target molecules, particles, or cells bind to the receptors. In the result of interaction between the analyte and the receptor, the effect can be measured by the transducer, which transforms this effect into the detected signal. The magnetic biosensor developed in this study is based on the magnetic attraction of micrometer and submicrometer bioparticles to magnetized ferromagnetic wire and the accumulation of bioparticles in the detected region. For high-gradient magnetic separation of submicrometer particles of nucleoprotein and ferritin we detected the growth with the saturation kinetics of the flocculating center of accumulated particles.21 The process can be described through an equation of continuity for particle flow in a gradient magnetic field, and the concentration distribution follows an exponential dependence, the argument for which contains the coordinate-independent coefficient , which is proportional to the average effective magnetic moment of separated submicron particles. The buildup radius for submicrometer particles can be obtained from equation of continuity and for a steady state, , solution iswhere is the initial particle volume concentration, and assuming13 , yields for submicrometer particles:3.1.Polarization Microscopy Study of Magnetic Accumulated StructuresPhase changes were proved by measurements in polarization microscopy studies using CCD camera and LabView 7.0 software. The phase transitions of particles that accumulated on the wire were detected for nucleoprotein granules, but we could not determine the brightness at the same level in polarized light for ferritin and red blood cells. We obtained completely new method to detect isotropic-cholesteric-smectic phase transitions recording the orientation of DNA granule aggregation in a high-gradient magnetic field. The photos in Figs. 6(a), 6(b), 6(c), 6(d), 6(e), 6(f), 6(g), 6(h), 6(i) demonstrate the gradual growth of liquid crystalline aggregate of nucleoprotein granules in a high-gradient magnetic field in a suspension and the same aggregate in a dried state. The transformation from an ellipsoid form to a cylindrical form and then to a conic form was completely according to theoretical and experimental research of the “Web-DNA-Collection group,” observing isotropic-nematic-cholesteric-smectic transitions in higher density crystalline states of DNA solutions. Measurements were carried out to determine the distribution of nucleoprotein and ferritin submicrometer particles along the radial coordinate. Images of the buildup process on wire were treated with LabView 7 software to get , as Figs. 5, 6, 7 show. Using the luminance distribution values obtained along a radial coordinate direction near the wire, one can use exponential decay fitting to get the parameter , which is independent of the wire radius and reflects a logarithmic relation between the saturation concentration of accumulated particles and the initial concentration of them for : Figure 7 shows the luminance intensity (proportional to concentration) distribution along the radial coordinate direction with exponential fitting. One can obtain magnetic moment values for particles using Eq. 4 and get from exponential fitting, as for , . For the parameters used in the experimental setting, we obtained for the magnetic moment of the particles in a magnetic field intensity of :For submicron granules with diameters of , one can estimate the magnetic susceptibility for the available interval (0.98 to 2.7) as (CGS volumetric units), where the lower value is for .Fig. 6Growth of one DNA granules aggregate in a high-gradient magnetic field. Granules can be induced to aggregate irreversibly by placing them in suspension in HGMS: (a) isotropic-precholesteric phase; (b) to (g) cholesteric-smectic coexistence of phases; (h) and (i) dried aggregate in polarized light. 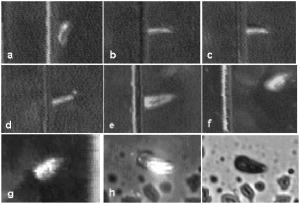 Fig. 7Logarithmic plot of luminance profile of DNA granule accumulation via dimensionless radial coordinate. The procedure of magnetic moment calculation by linear fitting was used to determine .  The magnetic moments of bioparticles are shown in Table 2. They have a large spread of values, and change sign and magnitude considerably between diamagnetic and superparamagnetic (ferritin cores form hemosiderin) conditions. Our light reflection and polarization microscopy studies have shown that granules in aggregates have persistence lengths of , while bacteriophage aggregate is . The aggregation of granules growing in the manner shown in Fig. 6 was irreversible, as confirmed by observation under strong magnification with an inverted microscope, as Figs. 8(a) and 8(b) show for the dried granule aggregate in polarized and depolarized light, in the crystalline structure. The strong mechanical perturbations were applied to force all colloidal particles to vibrate vigorously, but the aggregate obtained [Figs. 6(f), 6(g), 6(h), 6(i)] remained accumulated and tended to orient along the external magnetic field being far from a wire. Typically, a permanent long nucleus axis was seen (Fig. 8) as evidence of DNA-continuum formation. Fig. 8Crystalline structure of DNA-granules, aggregated in a rod in HGMS, which formed in suspension and then was dried: (a) transmitted polarized microscopy, where the birefringence of the rod is seen; and (b) depolarized light scattering detection using a degree of polarization analysis, where the appearance of the optical axis of the crystalline structure is clearly seen.  Figure 9 shows the image analysis of a single first right granule of a chain depicted in Fig. 8(a). The image analysis software enabled us to detect a single DNA granule profile and dark diffraction bands, with a granule size of , as Fig. 9 demonstrates. Diffraction was detected only transverse to the optical axis of the crystalline structure from granules [see Fig. 9(a)]. Along the axis, the bands were absent [see Fig. 9(b)]. Image analysis enabled the recording of a microparticle profile near the wire shown in Fig. 10 . Fig. 10Image analysis enables detection of magnetic separation parameters of Bonghan granule accumulation in the high-gradient magnetic field of a magnetized wire.  Fig. 9Image analysis enabled detection of a single DNA granule profile and dark diffraction bands, where the size of the granule is : (a) diffraction detected only transversely to the optical axis of the crystalline structure from the granules and (b) the profile is carried out along the crystalline axis, and the bands were absent. 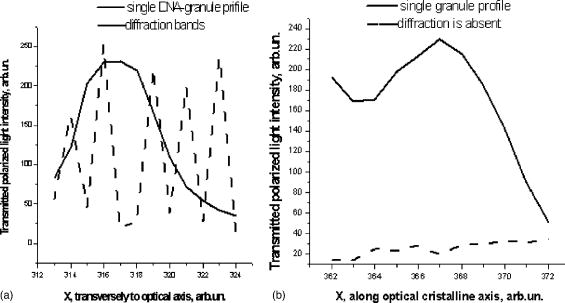 Threadlike structures (collagen tubes) containing DNA granules conferred diamagnetic anisotropic properties to the crystalline optical anisotropic aggregates inside them. Such structures were observed in HGMS attached to the magnetized wire in a diamagnetic area perpendicularly to the wire and the external field direction (Fig. 11 ). Fig. 11CCD photo of a threadlike tube (Bonghan duct) containing DNA granules in a gradient magnetic field obtained by a polarization microscope. The duct contains the crystalline aggregates of aligned granules.  Based on the observed processes and reported models,17, 18 we concluded that the mechanism of light penetration into the threadlike structures in acupuncture points could be such as is shown in the schematic of Fig. 12 . Fig. 12Influence of gradient magnetic field (pressure, vibrations, stress, an apoptosis) on granule crystalline phase forming in a threadlike tube [Bonghan (BH)duct]. Areas of crystals arise in ducts due to the magnetic alignment in a high-gradient magnetic field and remain there irreversibly, as previous long-time experiments have shown.  3.2.Ferritin Effects in Developing Artemia Shrimp EggsWe obtained new data on the magnetic properties of developing eggs. In the initial stage of embryos, the developing eggs were found to have a diamagnetic effect with respect to the solution that was revealed in a gradient magnetic field near a magnetized ferromagnetic wire surface, while in the late stages of shrimp eggs, the development changed to paramagnetic eggs [Fig. 13(a) ]. Because iron-deficient eggs are restricted in their development,5 we proposed that magnetic transformation of developing cysts might be due to the change at the amounts of hemoglobin and ferritin amounts during development of the embryo into a nauplius. When the cyst crashed, the nauplius head was first seen, then a new shrimp began to swim, but was caught by the gradient magnetic field, which easily stopped an animal attracted to the wire surface [Fig. 13(b)], revealing its paramagnetic properties even in an oxygen-excessive solution (when the hemoglobin was diamagnetic, and ferritin was ferromagnetic). In several experiments showing the immediate response of the ferritin-containing system on the external influences, the gradient magnetic field was pulsating with frequency . At this frequency, the tested eggs synchronically vibrated, showing the shrimp eggs’ ferromagnetic property—a strong remanent of magnetization. Such a form of iron storage is known in magnetic bacteria containing the magnetite microparticles. Fig. 13(a) Phylum Arthropoda, brine shrimp eggs: Artemia salina. Developing eggs of 100- size were attracted to a magnetized ferromagnetic wire, is , and (b) although repulsed from a magnetized wire when eggs are in earlier stages or when empty, the new shrimps were caught by the gradient magnetic field.  3.3.Concentration Effects of Ferritin and HemosiderinFigure 14 demonstrates ferritin molecules in gradient field of order to . Ferritin cores (hemosiderin) formed a dense layer of about . The magnetized in external field and attracted ferritin molecules and aggregates in our model, imitating the depositions of organisms. The ferritin cores were separated by a black layer on the wire surface [Fig. 14(b)] and remained on the wire after the external field was turned off, while apoferritin (protein of ferritin) aggregates diffused immediately. The theoretical curve of feritin deposition on the magnetized wire would differ from the experimental one, mainly due to the high magnetization of ferritin cores (hemosiderin) collected close to the wire surface. 3.4.Simulation of Deposition in Gradient FieldsA Langevin equation for magnetization of noninteracting superparamagnetic particles is where is the saturation magnetization of the particle, and and are the particle volume and concentrations. Magnetization of superparamagnetic particles such as ferritin cores or FeS clusters of mitochondria (sideroblasts) given by integrating of the Langevin equation follows the functionwhere is the number of particles in the aggregate or cluster; is the magnetic moment of the aggregate; ; and is a function of the distribution that depends on the magnetic polarization of a particle due to the aggregation:In the case of particles interacting under their aggregation or clustering, the magnetization value became proportional to in weak magnetic fields. A simulation of the deposition of aggregates of super-paramagnetic particles near the magnetized collector [for example, ferritin molecules near a magnetite crystal rod of cylindrical form (radius )] was calculated based on the equation , where is the concentration obtained as a function of , the normalized distance from the cylinder axis; and is the particle volume concentration for . The pattern obtained for weak fields is demonstrated in Fig. 15 , which shows dependence on concentration for ferritin molecules attracted to a cylinder in weak fields. A 3% increase in took place on the surface of the cylinder. For particles of sizes with ferritin cores, , the equality of the value and magnetic energy takes place for . Since the earth magnetic field is , the steady component, note that the magnetization in the permanent field of the earth for particles can be significant in living organisms. In strong industrial fields of more than , living organisms may become “magnetized” when ferritin and hemosiderin crystals in an organism become aligned, creating many ordered local centers inside the body. 4.DiscussionThe magnetic concentration of diamagnetic granules and super-paramagnetic ferritin aggregates5, 17, 21 occur in points of gradient magnetic applications. Then optical transformations like the phase crystalline transitions could facilitate the penetration of light considered in works also by Karu18 through the tubes of a collagen acupuncture network. Polarization microscopy of reflected, transmitted, and scattered light combined with CCD recording of static and dynamic patterns, and image view analysis have given rise to a new method for the observation and measurements of magnetic separation processes in gradient magnetic fields, and of the magnetic alignment of biological microparticles, nucleoprotein granules, invertebrate eggs, and macromolecular aggregates of ferritin. A nucleoprotein granular suspension from the blood capillary system of a rabbit was studied in connections with the problem of the medical treatments of acupuncture points by polarized light, steady and gradient magnetic fields, and acoustic stimuli.17, 21 The liquid crystalline arrangement, magnetic susceptibility changes, the appearance of optical and magnetic anisotropy in gradient magnetic fields, concentrating, light illumination, and other influences under time evolution were revealed. The orientation behavior of tubuline,9 invertebrate eggs,5 retinal and colloidal core-shell rods,10 and DNA molecules16 is becoming of particular interest. The relatively rigid DNA double helix with the base pairs stacked coplanar to each other and perpendicular to the long filament axis splits into two statistical, flexible, random coils, where the bases are free to rotate. In the denaturation phase transition region around the melting temperature, the magnetic orientation decreases to zero, and the observed decrease of optical and diamagnetic anisotropy led to the assumption that the base pairs are responsible for the magnetic alignment of DNA (Ref. 16). These base pairs in part consist of aromatic, i.e., diamagnetically anisotropic, rings and consequently tend to orient their planes parallel to field. The DNA coils in nucleosome supra-molecular condensed chromatin structures tend to orient their planes parallel to , which is in agreement with our observation. The use of HGMS combined with polarization microscopy, CCD recording, and image analysis of arising the ordered crystalline structures enabled detection of small amounts of sample, and so localization of the visual field on the gradient magnetic areas. The magnetic field caused the alignment of nucleoprotein granules, their concentrating, phase transitions, and magnetic susceptibility sign changes in the forming structures. Mechanical stimulation combined with HGMS facilitated liquid crystalline transitions, and caused resonant mechanical vibrations of aggregates.21 During the oxidative and aging processes, the fragmentation of samples led to the formation of a liquid crystalline state with completely new magnetic properties, in particular, diamagnetic crystalline clusters were revealed in a gradient magnetic field. New methods were developed to detect isotropic-crystalline phase transitions while recording the orientation of DNA granule aggregate in a high-gradient magnetic field. In the first step (see Fig. 6), granules were detected as aggregates having a discoid form and revealing positive diamagnetic anisotropy, orienting themselves with their plane along the magnetic field in diamagnetic separation on the wire. The second orientation of aggregates changed their form to a cylindrical-rod-like form, then to conic forms, which were oriented perpendicular to the field and to the wire, thus manifesting negative diamagnetic anisotropy, which is the characteristic behavior, in our case, of nucleoprotein and DNA molecules. A new method was presented for the liquid phase state testing of a DNA-granule colloidal suspension of a nucleus containing microcells, whose aggregates are based on high-gradient magnetic separation and microscopic screening of magnetic accumulation with time evolution. Birefringence properties of the crystals that result from the DNA granules concentrated by high-gradient magnetic separation were studied with image analysis. Our study demonstrated various applications of a magnetic separation analysis of bioparticles moving or collecting in a gradient magnetic field with the value by three orders more than for technical systems without wires reported by other authors,22, 23, 24, 25, 26, 27, 28 who measured the red blood cell iron and hemoglobin through the oxidation of iron ions irreversibly into third-valence states. One group observed the migration of lymphocytes for several hours in a weak gradient, while we can measure the magnetic susceptibility of native cells for several seconds. The diamagnetic capture of live bioparticles in the gradient magnetic field in our method lasted , providing measured values such low as (SI units) and a standard deviation 5%. Other magnetophoretic reported data26 suggested the possibility to be applied for biotechnology using fluorescent immunomagnetic sorbent beads containing superparamagnetic cores for the collection of particles in a visual field. Our purpose was to understand the role of magnetic and optical changes that occur permanently and play the main role in biosensory mechanisms of living systems. Recent new studies have shown the existence of the acupuncture meridian threadlike structures in the human body.17, 29 After light stimulation of the body, “light channels” appear to be identical to meridians in traditional Chinese medicine. 5.ConclusionsTo measure the magnetic susceptibility and magnetic moments of small numbers of weakly magnetic particles, both diamagnetic and paramagnetic, we performed measurements in a high-gradient magnetic field (HGMF), which was realized with portable, inexpensive devices, mounted in the visual field of inverted or reflected microscopes. The study of magnetic materials in living systems is very appropriate for the development of new methods for magnetic diagnostics and magnetotherapy. Living systems contain the full interval of magnetic substances (Table 3 ), from ferromagnetic crystals and superparamagnetic nanoparticles to diamagnetic anisotropic macromolecular structures. Table 3Magnetic susceptibilities of bio-particles.
The accuracy of magnetic measurements relatively environmental fluid having susceptibility value
−0.72×10⁻⁶
(CGS units)
=−4π×0.72×10−6
(SI units) reached
0.5×10⁻¹¹
(CGS units). Immunocomplex assays, which are very important in diagnostics and cancer immunology, are developed on magnetic separation principles. The suggested method could detect a protein antigen within several seconds. All these branches of investigation are the subject the great interest in the world. AcknowledgmentsThis work was supported in part by MOST (NRL, M1-0302-00-0007). One of the authors (S. Norina) expresses gratitude to the Brain Pool Grant of Korea, and for the hospitality of the School of Physics. ReferencesS. Reddy,
L. R. Moore,
L. Sun,
M. Zborovski, and
J. J. Chalmers,
“Determination of the magnetic susceptibility of labeled particles by video imaging,”
Chem. Eng. Sci., 51
(6), 947
–956
(1996). 0009-2509 Google Scholar
J. H. P. Watson,
“Magnetic filtration,”
J. Appl. Phys., 44 209
–213
(1973). 0021-8979 Google Scholar
F. J. Friedlaender,
M. Takayasu,
J. R. Rettig, and
C. P. Kentzer,
“Particle flow and collection process in single wire HGMS studies,”
IEEE Trans. Magn., 14 1158
–1164
(1978). https://doi.org/10.1109/TMAG.1978.1060024 0018-9464 Google Scholar
F. Paul,
D. Melville, and
S. Roath,
“Inviscid approximation trajectories in high gradient magnetic separation,”
IEEE Trans. Magn., 18 792
–795
(1982). https://doi.org/10.1109/TMAG.1982.1061823 0018-9464 Google Scholar
S. Norina,
K. S. Soh,
Y.-Z. Yoon, and
V. Ogay,
“Magnetic separation process in living organisms and embryo development,”
J. Int. Soc. Life Inf. Sci., 22
(2), 606
–609
(2004). Google Scholar
A. Shalygin,
S. Norina, and
E. I. Kondorsky,
“Behaviour of erythrocytes in high gradient magnetic field,”
J. Magn. Magn. Mater., 31–34 555
–556
(1983). 0304-8853 Google Scholar
Y. Svoboda,
“Magnetic flocculation and treatment of fine weakly magnetic minerals,”
IEEE Trans. Magn., 18
(2), 796
–801
(1982). https://doi.org/10.1109/TMAG.1982.1061815 0018-9464 Google Scholar
S. B. Norina and
S. F. Rastopov,
“Gradient magnetic biosensor for weak dia- or paramagnetic shifts in magnetic susceptibility of porous beads or surrounding fluid,”
Non-Linear Electromagnetic Systems, 333
–336 IOS Press, Amsterdam (1998). Google Scholar
W. Bras,
G. P. Diakun,
J. Diaz,
G. Maret,
H. Kramer,
J. Bordas, and
F. J. Medrano,
“The susceptibility of pure tubulin to high magnetic fields: a magnetic birefringence and x-ray fiber diffraction study,”
Biophys. J., 74 1509
–1521
(1998). 0006-3495 Google Scholar
M. P. V. van Bruggen,
“Preparation and properties of colloidal core-shell rods with adjustable aspect ratios,”
Langmuir, 14
(9), 2245
–2255
(1998). https://doi.org/10.1021/la971175y 0743-7463 Google Scholar
M. P. B. van Bruggen,
J. K. G. Dhout, and
H. N. Lekkerker,
“Morphology and kinetics of the isotropic-nematic phase transition in dispersions of hard rods,”
Macromolecules, 32
(7), 2256
–2264
(1999). https://doi.org/10.1021/ma981196e 0024-9297 Google Scholar
C. F. Lapple, Fluid and Particle Mechanics, 234 Ann Arbor, Michigan,1951). Google Scholar
F. J. Friedlaender,
M. Takayasu,
J. B. Rettig, and
C. P. Kentzer,
“Studies of single wire stream type HGMS,”
IEEE Trans. Magn., 14 404
–406
(1978). https://doi.org/10.1109/TMAG.1978.1059864 0018-9464 Google Scholar
P. D. G. Dean,
W. S. Johnson, and
F. A. Middle, Affinity Chromatography, 44
–154 IRL Press Limited, Oxford-Washington, DC (1985). Google Scholar
B. M. Cullum and
T. Vo-Dinh,
“Nanosensors for single-cell analyses,”
Biomedical Photonics Handbook, 60-1
–60-19 SPIE Press, Bellingham, WA (2002). Google Scholar
G. Maret,
M. Schickfus,
A. Mayer, and
K. Dransfeld,
“Orientation of nucleic acids in high magnetic fields,”
Phys. Rev. Lett., 35
(6), 397
–400
(1982). https://doi.org/10.1103/PhysRevLett.35.397 0031-9007 Google Scholar
K. S. Soh,
“Qi as biophotonic information flux of DNA in the Bonghan system,”
J. Int. Soc. Life Info. Sci., 22
(2), 36
(2004). Google Scholar
T. I. Karu,
“Low-power laser therapy,”
Biomedical Photonics Handbook, 48-1
–48-25 SPIE Press, Bellingham, WA (2002). Google Scholar
S. B. Norina,
A. N. Shalygin, and
S. F. Rastopov,
“Optical study of magnetic sedimentation and orientable properties of blood cells,”
155
–162
(2000). Google Scholar
S. B. Norina,
“Optical magnetic biosensor for immunocomplexes on beads,”
106
–115
(2000). Google Scholar
S. B. Norina,
“Magnetophoretic and optical study of anisotropic magnetic properties of biomicroparticles containing reactive oxygen species or ferritin,”
126
–133
(2003). Google Scholar
Y. A. Plyavin and
E. Y. Blum,
“Magnetic parameters of blood cells and high gradient paramagnetic and diamagnetic phoresis,”
Magnetohydrodynamics (N.Y.), 19 349
–359
(1983). 0024-998X Google Scholar
J. Svoboda,
“Separation of red blood cells by magnetic means,”
J. Magn. Magn. Mater., 220 103
–105
(2000). https://doi.org/10.1016/S0304-8853(00)00479-0 0304-8853 Google Scholar
S. Winoto-Morbach,
V. Tchikov, and
W. Müller-Ruchholtz,
“Magnetophoresis: I. Detection of magnetically labeled cells,”
J. Clin. Lab Anal, 8 400
–406
(1994). 0887-8013 Google Scholar
S. Winoto-Morbach,
V. Tchikov, and
W. Müller-Ruchholtz,
“Magnetophoresis: II. Quantification of iron and hemoglobin content at the single erythrocyte level,”
J. Clin. Lab Anal, 9 42
–46
(1995). 0887-8013 Google Scholar
V. Tchikov,
S. Schütze, and
M. Krönke,
“Comparison between immunofluorescence and immunomagnetic techniques of cytometry,”
J. Magn. Magn. Mater., 194 242
–247
(1999). https://doi.org/10.1016/S0304-8853(98)00567-8 0304-8853 Google Scholar
M. Zborowski,
G. R. Ostera,
L. R. Moore,
S. Milliron,
J. J. Chalmers, and
A. N. Schechter,
“Red blood cell magnetophoresis,”
Biophys. J., 84 2638
–2645
(2003). 0006-3495 Google Scholar
V. Tchikov,
A. Kuznetsov, and
A. Shapiro,
“Single cell magnetophoresis and its diagnostic value,”
J. Magn. Magn. Mater., 122 367
–370
(1993). 0304-8853 Google Scholar
K. P. Schlebusch,
W. Maric-Oehler, and
F. A. Popp,
“Biophotonics in the infrared spectral range reveal acupuncture meridian structure of the body,”
J. Altern Complement Med., 11
(1), 171
–173
(2005). https://doi.org/10.1023/A:1011113320414 1075-5535 Google Scholar
|


