|
|
1.IntroductionChanges in the biochemistry of cells and tissues have been studied by utilizing Fourier transform infrared (FTIR)-spectroscopy and FTIR-microspectroscopy.1, 2, 3, 4 The occurrence of different cancers has been attributed to various causes, and thus their diagnosis and prevention have different approaches. It is therefore highly desirable to search for natural intrinsic parameters, which can have universal diagnostic capacities irrespective of the type of cancer or its manifestation. In this regard, FTIR spectroscopy shows promise, as it is dependent not on single specific molecules but gives detailed information on gross changes that are common to different forms of cancer, such as abnormal growth and metabolism. The differences in the absorbance spectra in the mid-IR region between normal and abnormal tissues have been shown to be a possible criterion for detection of cancer.5, 6 However, the utility of lipids and phospholipids as biological markers for cancer in FTIR-microspectroscopy (MSP) has not been probed into in detail, though there was a mention of the changes in the absorbance due to and vibrations during carcinogenesis.7, 8 The phospholipids/lipids/triglycerides and proteins predominantly absorb in the wavenumber region from 2800 to ,9 with minor contributions from carbohydrates and nucleic acids. The lipoproteins are involved in the formation of the membrane of cells, and thus they are an important component in the cell cycle. Absorbance in the region between 1700 and has been attributed to the lipoproteins present in the cells and tissues.10 However, this region has low intensities and is often noisy, making it difficult for utilization in diagnosis. Thus, there should exist a similarity in the variation between normal and cancerous tissues of different organs with reference to the lipoproteins, which is observable in the FTIR spectra. Previous work in this laboratory had identified important feature combinations in the region between 2465 and for utilization in artificial neural networks (ANNs) for distinction of cancer, normal and polyps, in colonic tissues.5 Earlier works done on the distinction of normal and abnormal tissues based on spectral differences in the mid-IR region have focused on the wavenumbers from 600 to .11, 12, 13 However, it is also obvious that the altered rate of multiplication of cancer cells will result in the alteration of lipid profiles and total biochemical composition in the tissues, as these are constituents of the membranes and cell organelles that divide during cancer.14, 15 Some workers have reported variations in intensities in the region 2800 to in studies of cell/tissues, and derived parameters from these intensities for their studies,16, 17 among which the / ratio is prominent. In the present work, we use data from colon and cervical biopsies as well as normal and transformed cell lines to substantiate our observations that certain changes in biochemical compositions are global features during carcinogenesis and can be monitored through FTIR spectroscopy. The cell lines are not subjected to biochemical processes like the biopsies, and hence would help to account for any artifacts in the lipid profile arising due to the treatment of biopsies by formalin, xylol, and paraffin during their standard treatment. We also study the reverse process in white blood cells (WBCs) of child leukemia patients, who are successfully treated by chemotherapy, to show that the same parameters are also valid and may indicate the return of the WBC population to normal once the leukemia is successfully treated. Thus, we aim to prove that the biochemical variations during carcinogenesis may give a remarkable universal feature in the higher wavenumber region, and therefore can be used for disease identification. 2.Materials and Methods2.1.Sample PreparationBiopsies were retrieved with the consent of cancer patients from the histopathology files of Soroka University Medical Center, Beer-Sheva (SUMC). The biopsies were processed following routine methods of pathological laboratories. Samples were carefully selected to include both normal as well as cancer regions on the same biopsies or different biopsies from the same patient by an expert pathologist to avoid individual variations. Consecutive sections of 10- thickness5 were prepared from biopsies for FTIR-MSP and histopathological studies and were practically identical. The first slide was deparaffinized using xylol and alcohol and was used for FTIR measurements. The second slide, after similar processing along with the first slide, was stained with haematoxylin and eosin for online parallel histology review by an expert pathologist, who also assigned the cancer stage whenever necessary. Balb/c 3T3 murine fibroblasts were transfected with H-ras oncogene cloned into the selectable plasmid pSV2neo.18 The resultant clones were tumorigenic in vitro and had altered morphology. Control cell lines that were transfected with vector plasmid were not tumorigenic and showed normal morphology in vitro.19 Tissue culture media, fetal calf serum (FCS), trypsin, and antibiotics were purchased from Biological Industries (Beth Haemek, Israel). Cells were grown in an incubator at , 95% humidity and 8% , in Dulbecco's modified eagle medium (DMEM) supplemented with 10% fetal calf serum (FCS), glutamine (2mM), and antibiotics (penicillin , streptomycin , and gentamycin ). The details of these studies, such as synchronization of cell lines at G1 phase by sodium butyrate treatment20 and the monitoring by FTIR-MSP, are detailed in an earlier report.21 Primary rabbit cells obtained from the bone marrow of 1.5-kg rabbits were grown at in Roswell Park Memorial Institute (RPMI) medium supplemented with 10% newborn calf serum (NBCS) and the antibiotics penicillin and streptomycin. Clone 124 of TB cells chronically releasing Moloney MuSV-124 was used to prepare the appropriate virus stock. The normal rabbit bone marrow fibroblasts were designated as BM cells, and those transformed by MuSV as BMT cells. The cells were synchronized separately at the G1 phase by sodium butyrate treatment.20 A monolayer of NIH/3T3 cells grown in 9- tissue culture plates was treated with of polybrene (a cationic polymer required for neutralizing the negative charge of the cell membrane) for before infection with the virus. Excess polybrene was then removed, and the cells were incubated at for with the infecting virus (MuSV-124) at various concentrations in RPMI medium containing 2% of NB. The unabsorbed virus particles were removed, fresh medium containing 2% NBCS was added, and the monolayers were incubated at . After 2 to 3 days, the cell cultures were examined for the appearance of malignant transformed cells. The cells were studied by FTIR-MSP as detailed in earlier reports.21 Both normal and transformed cells were washed in normal saline to remove any debris or extraneous material from the media. Then they were spotted on the zinc selenide slides and allowed to air dry in a laminar air flow. The air dried samples were used for FTIR-MSP. The blood samples were collected from child leukemia patients with consent of their parents and from an adult leukemia patient with his consent. Blood from volunteers were collected with their consent to serve as control. The WBCs were separated within 22 of the collection of the blood samples from patients/controls. The cells and the WBCs were washed with normal saline to remove any adhering media and extraneous materials. They were then placed on zinc selenium slides and allowed to dry for several hours in a laminar airflow chamber to remove any extra water. These air-dried samples were used for microscopy. In parallel, normal HE staining was done for the previous cell lines and WBCs to morphologically assess their condition as normal or transformed. 3.FTIR MicrospectroscopyAt least five randomly selected spots were measured on biopsies, cell lines, or WBCs fixed on zinc selenide slides using the FTIR microscope IRscope II with a liquid nitrogen cooled mercury-cadmium-telluride (MCT) detector, coupled to the FTIR spectrometer (Bruker Equinox model 55/S, OPUS software, Bruker Optics) in a circular area of diam in transmission mode. The band pass was . Background spectra obtained from a remote region of the slide were used to automatically subtract background spectra from any contribution and artifacts residing on the slide during processing. To achieve high signal-to-noise ratio (SNR), 128 co-added scans were collected in each measurement in the wavenumber region 600 to . The average spectrum of the different sites was calculated and used for further processing. To eliminate any background contribution, the spectra were selected in the region 2800 to and baseline corrected using a 24-point rubberband method using OPUS software. The average spectra for different samples were then normalized to the antisymmetric absorbance band at (min-max normalization), followed by offset correction and were used for subsequent calculations and analyses. Vector normalization for the cut spectra was also tested and did not significantly alter the results obtained using the min-max normalization. The same method of analysis was carefully followed throughout, giving higher accuracy in the deduced spectral parameters. The dataset employed in the present study is summarized in Table 1 . In the case of colonic tissues, circular crypts were measured,5 and in the case of cervical tissues, the measurements were made in the intermediate layer,23 as described earlier. Measurement in these regions had shown encouraging results for FTIR-MSP-based diagnosis. For cervical tissues, the measurements in the intermediate layer were undertaken close to the superficial layer or close to the lumen of the cervix, as in many instances the superficial layers were absent and thus the measurements were performed at the next outermost layer near the lumen. (In most cases under study, the common clinical symptoms were excessive bleeding in women, and thus, the presence of the superficial layer was very limited.) Moreover, the intermediate layers are, most of the time, homogeneous in composition23 unless there is a contamination with blood. The contaminated areas can be easily avoided by studying the parallel hematoxin-eosin (HE) slide. In the case of cell lines and WBC, assuming a homogeneous preparation, randomly selected spots were measured. The values for the calculation of intensities from the second derivative (after nine points smoothing) were obtained by a method similar to Shen 24: asym , asym , sym , and sym . Table 1Changes in the CH3 / CH2 ratio from normal to cancer/transformed conditions. The corresponding value from second derivative calculations is 3.9 and still significant for the 5.88 value of colon t-test.
4.Effect of ParaffinThe tissue samples in the present study were prepared for measurements from paraffin-embedded biopsies. The paraffin can have significant absorbance in the region of interest. Thus, a careful experiment was done to study the effect of paraffin in the tissues, and also verify its successful removal in the deparaffinized samples. A colonic biopsy was selected and a 10- slice of the paraffin-embedded tissue was mounted on a zinc selenide slide (a consecutive section was placed on a glass slide). The colonic crypts are visible as circular entities, though not very clear when embedded in paraffin. The background of the slide was measured in a clear region. Then, the spectra at five different spots of the tissue with the paraffin itself were measured. Similarly, spectra of pure paraffin layers were measured. The slides were then washed with xylol (10-min wash with three changes) with mild shaking to hasten the removal of paraffin. At each step of the washing, the slide was removed, allowed to dry, and then selected areas were measured, including the areas where only pure paraffin was present in the initial section. Each time, the background was measured in a clear region. After this process, the slides were washed briefly in alcohol and another set of measurements was taken. The slide was then left in 70% alcohol overnight and the next day the measurements were done again. The data were analyzed to verify the complete removal of paraffin from tissues. The glass slide was processed and stained to see the tissues and absence of any paraffin (residual paraffin would prevent proper HE staining of tissues). Spectra were carefully examined for indication of the slightest absorbance from paraffin (at wavenumbers from 1426 to ) and were found to be devoid of such impurities. 5.ResultsThe spectrum in the presence of traces of paraffin show strong absorbance peaks at wavenumbers where paraffin absorbs [wavenumbers 1426 to , Fig. 1(a) ]. In addition, the region between 2800 and has a very high absorbance for paraffin due to and stretching vibrations [Fig. 1(b)]. The spectra of the tissue section embedded in paraffin are shown for comparison, to indicate the dominance of signals in the region 2800 to when paraffin is present. It is noted that when the sections are treated with xylol, the paraffin is rapidly removed, and after two washes, there is complete paraffin removal. The changes are nonsignificant after a third wash, showing further that there is no residual paraffin. At this point, the signals at also become clear, indicating that the signals of lipids are from the constituents of the tissues [Fig. 1(a)]. There are minor differences due to washing with alcohol and also decrease in signals at , which may be due to the removal of some more lipids, especially those soluble in alcohol/formalin.25 At the same time, signals in the region between 800 and that are due to paraffin vanish in the spectra, giving a consistency in the intensities between 1426 and , which indicates the removal of paraffin. The changes in the region 900 to due to washing with alcohol could be due to removal of the xylol and some sugars that are dissolved. This in turn would also partly contribute to minor changes observed in the region 2800 to due to alcohol effects [Fig. 1(b)]. Fig. 1Area normalized spectra of colonic sections treated with xylol and alcohol during processing of biopsies for FTIR measurements to show the removal of paraffin: region between 600 to and region between 2700 to . The labels indicate E as the paraffin embedded section, X1 is after the first wash with xylol, X2 is after the second wash with xylol, X3 is after the third wash with xylol, A1 is after the first wash with alcohol, and A2 is after the second wash with alcohol. Note that the very high absorbance of paraffin in the embedded sections has made the other peaks relatively very small and thus not clearly visible. 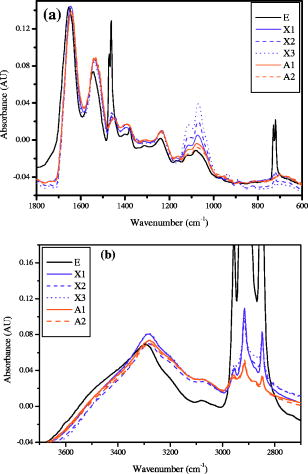 The histological studies of HE stained slides showed that the tissues were not greatly damaged and showed clear outlines of cells, indicating the integrity of structures and presence of lipids in complex forms (membranes), even after processing with xylol and other reagents. The representative spectra of normal and cancerous colonic tissues in the mid-IR region are presented in Fig. 2(a) . The expanded region 2800 to from the same patients are displayed in Fig. 2(b) along with the second derivative spectra in Fig. 2(c). The spectra are baseline corrected, normalized to the asym stretching peak at . It is seen that the cancer tissue has different absorbance patterns than the normal tissues. The four relevant bands are labeled and assigned by numbers such as peaks 1, 2, 3, and 4 for further discussions. Similar results were also observed in the case of cervical cancer tissues compared to the respective normal tissues (data not shown). It can be noted that these two patients were selected to represent a small difference (patient 18) and a large difference (patient 20) between normal and cancer for the ratio studied, as shown in Fig. 3(a) . This indicates that the variation in the ratio is dependent on individual differences between patients. Fig. 2Spectra of colonic tissues in the mid-IR region 800 to after baseline correction and normalization to the amide 1 band. The spectra were obtained from different regions of the same biopsy of two patients represented in Fig. 3 (patients 18 and 20). Expanded region between 2800 to , indicating the prominent bands observed in the spectra (inset: after rubberband baseline correction for this region). Second derivative spectra displaying the minima and the wavenumbers selected for calculation of the parameters. 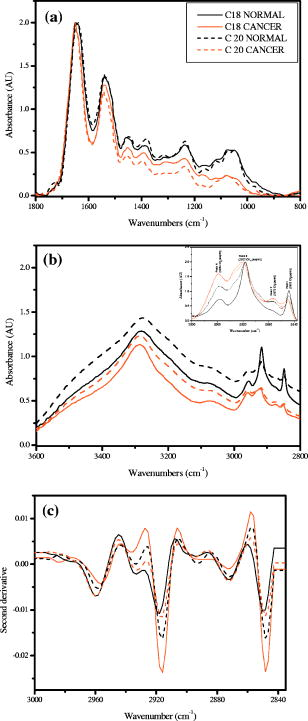 Fig. 3Variations in absorbance due to and (total of symmetric and antisymmetric stretching vibrations) of lipids in normal and malignant colonic tissues. Variations in the absorbance due to symmetric and antisymmetric stretching vibrations of normal and cancerous tissues. Each histogram is the average ratio of ten different measurements on the same biopsy. The error bars indicate the standard error within a biopsy. Spectra of the colonic tissues considered as normal and cancerous region by the pathologist from patient 16 (N1,C1) compared to a representative spectra (N2, C2) and spectra of red blood cells (dotted line) on the same slides. 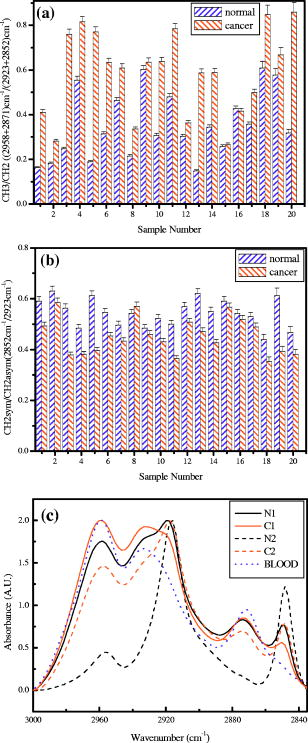 The spectra from biopsies of 20 colon cancer patients show that there is an increase in absorbance ratio due to total symmetric and antisymmetric vibrations of groups compared to total of groups in cancer tissues [Fig. 3(a)]. The ratio presented in the figure gives the absorbance intensity ratio at the specified channels (wavenumbers). The figure indicates that there is a significant consistent alteration in the lipid metabolism in the cancer tissues. Figure 3(b) displays the absorbance intensity ratio sym/ asym for the same group of colon cancer patients. In this case, the ratio for cancer is consistently lower than the ratio for the corresponding normal tissue from the same patient. The absorbance at has been ascribed mainly to the changes in membrane lipid levels.4, 26, 27 Thus, we derive two parameters based on the spectral intensities ratios [Figs. 3(a) and 3(b)], which can be tested as biological markers to distinguish between normal and cancerous tissues. These ratios were statistically different between the cancer and normal colonic tissues as seen from the paired t-test values listed in Table 1. The / ratio was increased by 8 to 66% in cancerous tissues compared to the corresponding normal tissues as seen from Table 1. The mean values for this ratio when derived from the second derivatives were also significantly different at 95% level of confidence, though the t-value was smaller respectively when the second derivative method was used. In the case of direct intensities and baseline subtraction, it was 5.88, while the second derivative gave only 3.9 (Table 1). The outlier cases of patients 15 and 16 were reinvestigated to understand the deviation from the normal trend. The spectra in the higher region were grossly different from those of normal colonic tissues. One possible reason could be the presence of contaminant material like blood (hemoglobin), which would be difficult to identify in the slide. The second HE stained slide was re-examined and there were large patches of red blood cells in the tissues. To verify if such contamination could result in alteration of the spectra, the spectra of regions in the slide without colonic tissues but only blood (red blood cells) were measured. The spectra showed that inclusion of red blood cells could markedly affect such measurements, as seen from Fig. 3(c). Thus, it is necessary to avoid such regions in the FTIR measurements by careful study of the histology in parallel. In the case of patient 16, even the normal tissues had contamination with blood and gave a different type of spectra in the higher region. Moreover, location of cancer and normal tissues were in close proximity in these cases, possibly leading to very small differences in the spectral features in FTIR, as seen in Fig. 3(c). We include these results to show the possible sources of error that may arise during such measurement of the spectral data. Similar trends were obtained for 13 sets of cervical tissues (Table 1). The results indicate that the cancer tissue has a higher absorbance ratio of / but a lower ratio for the sym/ asym. The decrease in absorbance of sym and a concomitant increase in are possibly responsible for these remarkable features (changes in both ratios). It is evident from the figure that in the case of cancer, lipid metabolism is greatly altered. The decrease in the ratio of the total absorbance due to symmetric and antisymmetric stretching vibrations is an indication of decreased membrane lipid content in cancer compared to the normal lipid content [Fig. 3(a)]. The lipids form an important source of energy as well as part of the membrane, whose permeability is important for easier transportation of metabolites during rapid cell growth and division. If these arguments are valid, the same feature should also be present in the case of cell lines when they are transformed to be carcinogenic. The ratios obtained for normal NIH 3T3 cells and those transformed with murine sarcoma virus (MuSV) are presented in Figs. 4(a) and 4(b). Similarly, the / ratio increases for the cancerous (transformed) cells with respect to controls, and the (sym)/ (asym) decreases in cancer, as observed earlier in the cases of colon and cervix, though the magnitude of the differences became less, as discussed later. In some cases, the difference was not very large as expected, and this could be due to either incomplete transformation or slight variation in the growth stage of the cells, as shown by Mourant 4 The other possibility is that both normal and transformed cells are perpetually growing (considering both as immortal or abnormal and fast growing), the lipid composition would not vary strongly in some instances as expected, leading to a lowering of these differences. Nevertheless, in the majority of cases (9/15), we found this trend indicating abnormal cells could give rise to these patterns observed in tissues. Fig. 4Variations in absorbance due to and (total symmetric and antisymmetric stretching vibrations) in NIH 3T3 cell line and MuSV transformed cell lines, as calculated from the region 2800 to . The histograms represent the normal and the transformed cells. Variations in absorbance due to symmetric and antisymmetric stretching vibrations. Each data point represents the average ratio of ten different measurements, and the individual sample number represents replications on different days. The error bars indicate the standard error. 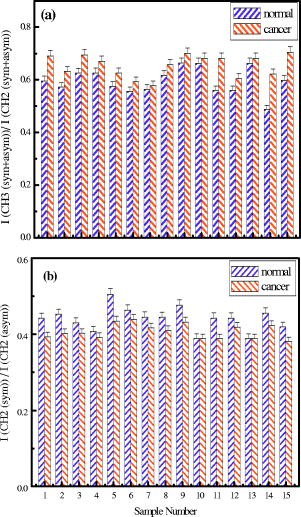 To further verify these features, other cell lines were studied. Fibroblasts cells that are transfected with H-ras oncogene were compared with normal fibroblasts. Indeed, the ratio of H-ras transfected mouse fibroblasts showed similar trends (Table 1). The same observations are also seen in the case of the primary rabbit bone marrow cells, which extend the observations to other mammalian systems (Table 1). The previous results indicate that during carcinogenesis, the metabolism is altered, and this can manifest as changes in the FTIR spectra in the wavenumber 2800 to , indicating the possible universality of these features. It is most interesting also to examine the inverse process, namely, when the reverse happens and the process of carcinogenesis is stopped and cells/tissues return to normal, the prior parameters should also return to normal values. This is an additional stringent test that such universal features are valid. In the case of a successful leukemia treatment, especially in children, the final WBC population returns to a normal condition. Thus, monitoring the WBC population during the treatment of children as a model system would prove that this parameter is indeed a valid fingerprint of carcinogenesis in cells and tissues. It has already been shown that the WBCs in a leukemia patient are different from those in a normal person.28 Figure 5(a) presents the WBC spectra from a child patient on four different days of treatment (days 0, 1, 7, and 12), where day 0 represents the spectra before induction of chemotherapy. The dotted line shows the spectra of a healthy person for comparison. Similarly, the values obtained from averaged FTIR spectra of WBCs from healthy persons were compared with WBCs of the leukemia patients (child and adult) on different days of treatment [Figs. 5(b) and 5(c)]. During treatment days, most values of / are above the normal level, and most values for the (sym)/ (asym) are below. It is observed that indeed the / ratio returns to a normal level after chemotherapy for most patients and becomes at par with those for the healthy persons (represented by the dashed horizontal lines in Fig. 6). The values obtained from the second derivative also displayed the same pattern, indicating that the contribution of the baseline correction procedure to the data was negligible [Fig. 5(d)]. Fig. 5Spectra of WBCs in the region between 2800 to showing the absorbance due to symmetric and antisymmetric stretching vibrations in lipids (phospholipids) at different days of the chemotherapy treatment of a ALL child (T-cell type) undergoing treatment for leukemia compared with an age-matched control (dotted line), / , and sym/ asym. The (gray) circles and lines [in (b) and (c)] indicate the treatment response for an adult, and the black circles and line represent a child. The / values obtained with intensities calculated from the second derivative spectra. Each data point was the average of five different sampling measurements. The open circles represent the values obtained for the group of control persons. The error bars are the standard error. 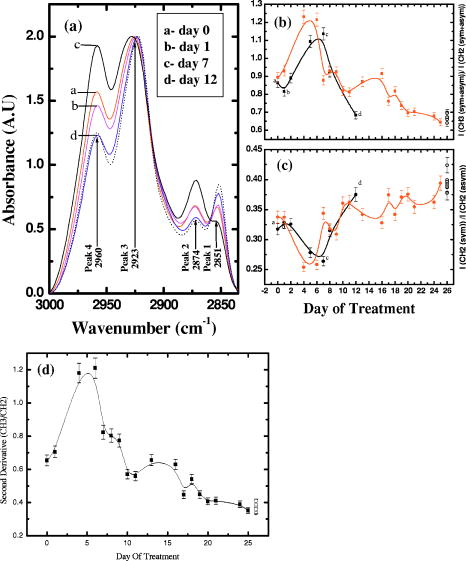 Fig. 6Variation in / ratio in seven children and one adult patient before and after treatment compared with controls. (Patients C1 and C4 are still under treatment.) 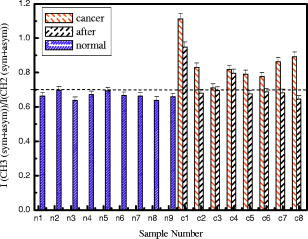 The / parameters calculated for additional children undergoing successful treatment for leukemia are displayed in Fig. 6 . The figure illustrates the differences before and after treatment. The values obtained from a control group of nine healthy volunteers are presented to show the efficiency of the treatment and the disappearance of leukemia for patients C1 through C8. Figure 6 illustrates that the successful treatment of leukemia is indicated by the return to normal ratios of / and (sym)/ (asym). Patients C1 and C4 did not respond favorably and were under further treatment. To further show that even unsupervised methods give similar conclusions, cluster analysis (Fig. 7 ) of the spectra in the region 2835 to using Ward’s algorithm was performed to show the return of normalcy in the child patient on day 12 when the above ratios [Figs. 5(b) and 5(c)] reach the range of the normal group. Figure 7 indicates that as expected, the spectrum on day 12 (labeled LD12) is grouped together with the controls, whereas earlier days are grouped in a distinct cluster. Other techniques [cytogenetic and fluorescence activated cell sorter (FACS)] were used to confirm the status of the disease in these patients and they were taken just before the induction of chemotherapy. Fig. 7Dendrogram of the WBCs of control and child on different days using the spectral region shown in Fig. 5 and Ward’s minimum variance method of cluster analysis. LN indicates normal WBCs from controls and the number indicates the sequential number of control, and LD indicates WBC from a child leukemia patient at different days indicated by the numbers. Note the spectrum of day 12 (LD12) is clustered with the normal group rather than the diseased cluster. 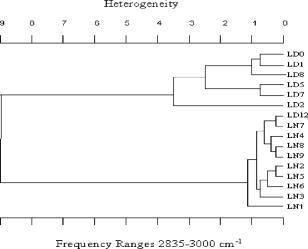 6.DiscussionIn the diagnosis of cancer using FTIR spectroscopy, the region between 2800 and was largely ignored because of the interference of water and also because other metabolites like phosphates and carbohydrates (the principal absorbing molecules) were considered to be of more diagnostic potential.12, 13 Though there was a mention of the changes in the absorbance due to and vibrations of lipids during carcinogenesis,6, 7 spectral absorbance in the 2800 to region has not been probed into in detail. Four prominent absorbance bands are located in this region: (symmetric stretching) of the methylene chains mostly in membrane lipids; (antisymmetric stretch); (antisymmetric stretching ); and (symmetric stretching).27, 28 We define two possible universal biomarkers in the FTIR-MSP spectra of various cancers (with different origin and character) for both diagnostic purposes as well as for development of imaging systems for in vivo (using methods to remove the influence of water, which can be developed in future) or ex vivo applications. The first is the / ratio and the second is the (sym)/ (asym) ratio. Earlier works have revealed that the lipid profile and cell permeability were altered due to carcinogenesis.29 The lipoproteins are involved in the formation of the membrane of cells and thus play an important role in the permeability of cells. Thus, the uptake of nutrients from surrounding cells and tissues by the rapidly proliferating cancer cells is enhanced. The observed phenomena of increased / reflect the formation of shorter fatty acid chains in cancer. Short-chain fatty acids are reported to promote cell migrations in colonic crypts30 that can lead to abnormal crypt proliferation, a precursor of colon cancer. The relative magnitude of and vibrations would thus be affected, as shorter fatty acids would have a larger / ratio, as actually observed in Figs. 3(a), 4(a) and 6. This would be especially true in tissues where the surrounding regions would have longer fatty acids, providing a contrast with cancer. Interestingly, the same features, though more uniform in cell lines, are less enhanced between transformed and control cell lines. This may arise from the similar divisional behavior of both (normal and cancer) cell lines. Both can be denoted as “immortalized” cells that can be cultured indefinitely. Thus, differences due to the effect of transformation do exist but are less pronounced. Moreover, these parameters are more uniform in the case of cell lines due to the better homogeneity of the samples compared with tissue samples, which contain extra cellular components where there is a chance of deposition of migrating lipids. In the case of tissues in spite of all precautions taken, there is a probability of some amount of contamination from the surrounding regions of sampling and due to the transport of molecules. The lipids may be present inside or outside the cells in the tissues; however, we ascribe these changes to metabolism within the cells, as both cells and tissues show similar trends. Thus, altered lipid metabolism and increased ratio of / within the cells and tissues seems to be a common feature of all carcinomas. Correlation between types of fatty acids and cancer has been well documented.31 Fatty acids have also been shown to vary the chemo sensitivity of the transformed cells.32 Accumulation of diacylglycerol during hepatitis and subsequent hepatoma in rats, which can influence this parameter, have been reported.33 Thus, the utilization of the absorbance in higher wavenumbers in the FTIR spectra of tissues can be an important parameter while studying malignancies by advanced optical techniques like pseudocoloring and image analysis. The absorbance in the higher region can be used in addition to the absorbance in the lower regions like 900 to , indicating complementary diagnostic capabilities through spectroscopic methods. The phenomenon of “enhanced permeability and retention effect,” observed in cancer tissue for macromolecules and lipids and coined the “EPR effect,” takes into account that most macromolecules are retained in the cancerous tissues. The tissue histology in the HE stained slides shows clear cell features, indicating intactness of cell membranes after processing. Thus, the lipids and macromolecules are not removed during the process of fixation and processing, enabling their detection in tissues and the utilization of such information for diagnosis. The levels of lipids are also affected by lipid mobilizing factors34 during tumor growth and cancer, which should manifest as variations in the absorbance between normal and malignant cells/tissues, as observed in the present work. Most solid tumors are known to exhibit highly enhanced vascular permeability, similar to or more than the inflammatory tissues, and it is well known that both proteins and lipids constitute the membranes that are the barriers affecting cell/tissue permeability. Currently, different markers are being used for different cancers. It is therefore desirable to define scientific parameters that may have universal diagnostic capacities irrespective of the type of cancer or its manifestation. This would help in designing infrared-based probes for ex vivo/in situ diagnosis of cancer with a universal application possibility without depending on specific markers or reagents. In the present study, for the first time we look into the variation in lipids and phospholipids of cancer tissues (colon and cervical) in FTIR spectra, focusing on the region between 2800 and . The similar trends observed in this study in both cells and tissues reflects that the earlier observations are not due to any artifacts, such as contamination of surrounding fluids, and probably suggest a universal feature of altered lipid metabolism and less rigid cell membrane organization during carcinogenesis. This is the scientific basis of our observation, which may have a powerful diagnostic potential. Though the absorbance in this region can be due to contributions from many macromolecules, the relative contribution of lipids is maximum, and therefore we assign these changes mainly to altered lipid metabolism. Moreover, the differences obtained for cervical cancer are less compared to colon cancer (Table 1), and it is well known that glycogen, which is abundant in normal cervical epithelium (intermediate and superficial layer), is absent in cancerous conditions, letting us conclude that the contribution from carbohydrates, if any, would be minimum. Similarly, the intensity of the amide 2 band was not significantly different between normal and cancerous tissues when normalized to the amide 1 band [Fig. 2(a)]. It indicates that we were possibly dealing with equivalent amounts of proteins in both types of tissues, while larger differences were seen in the lipids, in the region 2800 to , and in the , bending region between 1300 and . The processing of tissues could, of course, result in a differential extraction of small, easily removable lipids between normal and cancer tissues in the short time that they are exposed to xylol, and this could also be a minor factor contributing to the better diagnostics observed in tissues compared to cell lines. In summary, we evaluated common parameters derived from the mid-IR absorbance for understanding biochemical alterations during carcinogenesis, and for diagnosis of malignant and normal tissues, cell lines, and WBCs as common indicators of cancer. To further establish the utility of these ratios in cancer diagnosis and management, the same parameters have been tested to monitor the changes occurring in leukemia patients during chemotherapy. The results are encouraging, and indicate the possibility of identifying cancer cells in a tissue by ex vivo or in vitro studies, and the future use of imaging technologies to utilize these few simple parameters for diagnostic purposes.35, 36 Nevertheless, it becomes important that the deparaffinization process is checked carefully before such analysis to eliminate any contribution from residual paraffin, which may influence the spectra in this region. In addition, it is also noticed that contamination of samples by RBC in the slide can be cross-verified from the higher region, and such spectra can be discarded for further analysis, since the presence of significant amounts of RBC (hemoglobin) can alter spectral features. AcknowledgmentsWe thank S. Mark, A. Podshyvalov, M. Ben-Harosh, V. Erukimhovitch, M. Talyshinsky, Evgenia Berhnstain, Evgeny Bogomolny, and K. Kantarovich for their help during sample preparation and data collection. This research work was supported by the Israel Science Foundation (ISF grant 788/01), and the Israel Cancer Association (ICA). ReferencesE. Benedetti,
E. Bramanti,
F. Papineschi,
I. Rossi, and
E. Benedetti,
“Determination of the relative amount of nucleic acids and proteins in leukemic and normal lymphocytes by means of Fourier transform infrared microspectroscopy,”
Appl. Spectrosc., 51 792
–797
(1997). 0003-7028 Google Scholar
S. Boydston-White,
T. Gopen,
S. Houser,
J. Bargonetti, and
M. Diem,
“Infrared spectroscopy of human tissue. V. Infrared spectroscopic studies of myeloid leukemia (ML-1) cells at different phases of the cell cycle,”
Biospectroscopy, 5 219
–227
(1999). https://doi.org/10.1002/(SICI)1520-6343(1999)5:4<219::AID-BSPY2>3.3.CO;2-F 1075-4261 Google Scholar
L. Chiriboga,
H. Yee, and
M. Diem,
“Infrared spectroscopy of human cells and tissues. Part IV: A comparative study of histopathology and infrared microspectroscopy of normal, cirrhotic and cancerous liver tissue,”
Appl. Spectrosc., 54 1
–8
(2000). https://doi.org/10.1366/0003702001948204 0003-7028 Google Scholar
J. R. Mourant,
Y. R. Yamada,
S. Carpenter,
L. R. Dominique, and
J. P. Freyer,
“FTIR spectroscopy demonstrates biochemical differences in mammalian cell cultures at different growth stages,”
Biophys. J., 85
(3), 1938
–1947
(2003). 0006-3495 Google Scholar
S. Argov,
J. Ramesh,
A. Salman,
I. Silenikov,
J. Goldstein,
H. Guterman, and
S. Mordechai,
“Diagnostic potential of Fourier transformed infrared microspectroscopy and advanced computational methods in colon cancer patients,”
J. Biomed. Opt., 7
(1), 1
–7
(2002). 1083-3668 Google Scholar
L. M. McIntosh,
M. Jackson,
H. H. Mantsch,
M. F. Stranc,
D. Pilavdzic, and
A. N. Crowson,
“Infrared spectra of basal cell carcinomas are distinct from non-tumor-bearing skin components,”
J. Invest. Dermatol., 112 951
–956
(1999). https://doi.org/10.1046/j.1523-1747.1999.00612.x 0022-202X Google Scholar
P. T. Wong,
S. M. Goldstein,
R. C. Grekin,
T. A. Godwin,
C. Pivick, and
B. Rigas,
“Distinct infrared spectroscopic patterns of human basal cell carcinoma of the skin,”
Cancer Res., 53 762
–765
(1993). 0008-5472 Google Scholar
H. Y. N. Holman,
M. C. Martin,
E. A. Blakely,
K. Bjornstad, and
W. R. Mckinney,
“IR spectroscopic characteristics of cell cycle and cell death probed by synchrotron radiation based Fourier transform IR spectromicroscopy,”
Biopolymers, 57 329
–335
(2000). 0006-3525 Google Scholar
D. Naumann,
“FT-infrared and FT-Raman spectroscopy in biochemical research,”
Infrared and Raman Spectroscopy of Biological Materials, 323
–377 Marcel Dekker, New York (2001). Google Scholar
M. Nara,
M. Okazaki, and
H. Kagi,
“Infrared study of human serum very-low-density and low-density lipoproteins. Implication of esterified lipid stretching bands for characterizing lipoproteins,”
Chem. Phys. Lipids, 117 1
–6
(2002). 0009-3084 Google Scholar
L. Chiriboga,
P. Xie,
H. Yee,
V. Vigorita,
D. Zarou,
D. Zakim, and
M. Diem,
“Infrared spectroscopy of human tissue. I. Differentiation and maturation of epithelial cells in the human cervix,”
Biospectroscopy, 4 47
–53
(1998). https://doi.org/10.1002/(SICI)1520-6343(1998)4:1<47::AID-BSPY5>3.0.CO;2-P 1075-4261 Google Scholar
P. G. Andrus and
R. D. Strickland,
“Cancer grading by Fourier transform infrared spectroscopy,”
Biospectroscopy, 4 37
–46
(1998). https://doi.org/10.1002/(SICI)1520-6343(1998)4:1<37::AID-BSPY4>3.0.CO;2-P 1075-4261 Google Scholar
M. A. Cohenford,
T. A. Godwin,
F. Cahn,
P. Bhandare,
T. A. Caputo, and
B. Rigas,
“Infrared spectroscopy of normal and abnormal cervical smears: evaluation by principal component analysis,”
Gynecol. Oncol., 66 59
–65
(1997). https://doi.org/10.1006/gyno.1997.4627 0090-8258 Google Scholar
L. Louw,
A. M. Engelbrecht, and
F. Cloete,
“Comparison of the fatty acid composition in intraepithelial and infiltrating lesions of the cervix: part I, total fatty acid profiles,”
Prostaglandins, Leukotrienes Essent. Fatty Acids, 59 247
–251
(1998). 0952-3278 Google Scholar
A. M. Engelbrecht,
L. Louw, and
F. Cloete,
“Comparison of the fatty acid composition in intraepithelial and infiltrating lesions of the cervix: part II, free fatty acid profiles,”
Prostaglandins, Leukotrienes Essent. Fatty Acids, 59 253
–257
(1998). 0952-3278 Google Scholar
N. Jamin,
L. Miller,
J. Moncuit,
W. H. Fridman,
P. Dumas, and
J. L. Teillaud,
“Chemical heterogeneity in cell death: combined synchrotron IR and fluorescence microscopy studies of single apoptotic and necrotic cells,”
Biopolymers, 72 366
–373
(2003). https://doi.org/10.1002/bip.10435 0006-3525 Google Scholar
F. Gasparri and
M. Muzio,
“Monitoring of apoptosis of HL60 cells by Fourier-transform infrared spectroscopy,”
Biochem. J., 369
(Pt2), 239
–248
(2003). 0264-6021 Google Scholar
M. A. Tainsky,
F. L. Shamanski,
D. Blair, and
G. Vande Woude,
“Human recipient cell for oncogene transfection studies,”
Mol. Cell. Biol., 7 1280
–1284
(1987). 0270-7306 Google Scholar
T. Ehrlich,
O. Wishniak,
N. Isakov,
O. Cohen,
S. Segal,
B. Rager-Zisman, and
J. Gopas,
“The effect of H-ras expression on tumorigenicity and immunogenicity of Balb/c 3T3 fibroblasts,”
Immunol. Lett., 39 3
–8
(1994). 0165-2478 Google Scholar
M. Golzio,
J. Teissie, and
M. P. Rols,
“Cell synchronization effect on mammalian cell permeabilization and gene delivery by electric field,”
Biochim. Biophys. Acta, 1563 23
–28
(2002). 0006-3002 Google Scholar
M. Huleihel,
A. Salman,
V. Erukhimovitch,
J. Ramesh,
Z. Hammody, and
S. Mordechai,
“Novel spectral method for the study of viral carcinogenesis in vitro,”
J. Biochem. Biophys. Methods, 50 111
–121
(2002). https://doi.org/10.1016/S0165-022X(01)00177-4 0165-022X Google Scholar
L. Hudson and
F. C. Poplack, Practical Immunology, Blackwell Publication, London (1976). Google Scholar
S. Mark,
R. K. Sahu,
K. Kantarovich,
A. Podshyvalov,
H. Guterman,
J. Goldstein,
R. Jagannathan,
S. Argov, and
S. Mordechai,
“Fourier transform infrared microspectroscopy as a quantitative diagnostic tool for assignment of premalignancy grading in cervical neoplasia,”
J. Biomed. Opt., 9
(3), 558
–567
(2004). https://doi.org/10.1117/1.1699041 1083-3668 Google Scholar
Y. C. Shen,
A. G. Davies,
E. H. Linfield,
T. S. Elsey,
P. F. Taday, and
D. D. Arnone,
“The use of Fourier-transform infrared spectroscopy for the quantitative determination of glucose concentration in whole blood,”
Phys. Med. Biol., 48
(13), 2023
–2032
(2003). 0031-9155 Google Scholar
E. Gazi,
J. Dwyer,
N. P. Lockeyer,
J. Miyan,
P. Gardner,
C. Hart,
M. Brown, and
N. W. Clarke,
“Fixation protocols for subcellular imaging by synchrotron-based Fourier transform infrared microspectroscopy,”
Biopolymers, 77 18
–30
(2005). 0006-3525 Google Scholar
B. Rigas,
S. Morgello,
I. S. Goldman, and
P. T. Wong,
“Human colorectal cancers display abnormal Fourier-transform infrared spectra,”
Proc. Natl. Acad. Sci. U.S.A., 87 8140
–8144
(1990). 0027-8424 Google Scholar
F. S. Parker, Applications of Infrared Spectroscopy in Biochemistry, Biology, and Medicine,
(1971) Google Scholar
J. Ramesh,
M. Huleihel,
J. Mordehai,
A. Moser,
V. Erukhimovich,
C. Levi,
J. Kapelushnik, and
S. Mordechai,
“Preliminary results of evaluation of progress in chemotherapy for childhood leukemia patients employing Fourier-transform infrared microspectroscopy and cluster analysis,”
J. Lab. Clin. Med., 141 385
–394
(2003). 0022-2143 Google Scholar
C. Dombi,
J. Banoczy,
M. Kramer,
W. P. Wertz, and
A. C. Squier,
“Study of the permeability of oral leukoplakia,”
Fogorv. Sz., 92 137
–142
(1999). 0015-5314 Google Scholar
A. J. Wilson and
P. R. Gibson,
“Short-chain fatty acids promote the migration of colonic epithelial cells in vitro,”
Gastroenterology, 113 487
–496
(1997). 0016-5085 Google Scholar
N. Bakker,
P. Van’t Veer, and
P. L. Zock,
“Adipose fatty acids and cancers of the breast, prostate and colon: an ecological study. EURAMIC study group,”
Int. J. Cancer, 72 587
–591
(1997). 0020-7136 Google Scholar
W. S. Tsai,
H. Nagawa, and
T. Muto,
“Differential effects of polyunsaturated fatty acids on chemo sensitivity of NIH3T3 cells and its transformants,”
Int. J. Cancer, 70 357
–361
(1997). 0020-7136 Google Scholar
S. Yoon,
A. Kazusaka, and
S. Fujita,
“Accumulation of diacylglycerol in the liver membrane of the Long-Evans cinnamon (LEC) rat with hepatitis: FT-IR spectroscopic and HPLC detection,”
Cancer Lett., 151 19
–24
(2000). 0304-3835 Google Scholar
S. T. Russell and
M. J. Tisdale,
“Effect of a tumour-derived lipid-mobilising factor on glucose and lipid metabolism in vivo,”
Br. J. Cancer, 87 580
–584
(2002). 0007-0920 Google Scholar
P. Lasch,
W. Haensch,
D. Naumann, and
M. Diem,
“Imaging of colorectal adenocarcinoma using FT-IR microspectroscopy and cluster analysis,”
Biochim. Biophys. Acta, 1688 176
–186
(2004). 0006-3002 Google Scholar
P. Lasch and
D. Naumann,
“FT-IR microspectroscopic imaging of human carcinoma thin sections based on pattern recognition techniques,”
Cell Mol. Biol. (Paris), 44 189
–202
(1998). 0145-5680 Google Scholar
|

