|
|
1.IntroductionIntensive study of the effects of electric fields on biological cells commenced in the 1960s, when Sale and Hamilton first reported killing yeasts and bacteria with membrane-disrupting, kilovolt-per-centimeter, microsecond electric pulses.1 Later, reversible membrane breakdown (transient membrane permeability) under controlled pulse conditions was investigated by Zimmermann, Neumann, and Zimmermann. 2, 3, 4 This phenomenon, called electroporation or electropermeabilization, opened a new pathway for gene transfection and drug delivery.4, 5 In the following decades, the effects of pulsed electric fields on cells and tissues were explored experimentally and theoretically, with pulse durations decreasing from milliseconds to nanoseconds as advanced pulsed power technology was incorporated into biological investigations. Conventional electroporation∕electropermeabilization employs broad pulses (milliseconds to microseconds) and relatively low electric fields (kilovolts per centimeter) to open pores in the plasma membrane.3, 6, 7 More recently, it has been demonstrated that as the pulse width is reduced to nanoseconds and the electric field is increased above , intracellular structures, shielded from long, electroporation pulses by the cell membrane, respond to the nanosecond pulsed field while the cytoplasmic membrane remains unporated by conventional measure.8, 9, 10 This effect, electroperturbation, represents the basis for a technology with the potential for the remote, noninvasive manipulation of intracellular structures and processes. From an electrical engineering standpoint, a biological cell can be considered as a tiny capacitor since the cell membrane has a much lower electrical conductivity than the cytoplasm or the surrounding medium. For the dc or low-frequency case the membrane dielectric blocks the field from the cell interior. At higher frequencies or for very brief events, the membrane capacitor is bypassed. A mammalian cell with a diameter typically has11, 12 a charging time constant around . For an electric pulse width that is much less than the charging time of the external membrane, most of the applied voltage is expressed across intracellular organelles such as mitochondria and nuclei. Hofmann 13 reported apoptosis of malignant cells induced by short pulses ( pulses at 4.5 and ), including DNA fragmentation and cleavage of poly [adenosine diphosphate (ADP) ribose] polymerase. Further, the intracellular response (granule “sparkler”) triggered by nanoelectropulses ( , ) was demonstrated by Schoenbach 8 in 2001. Their studies suggested the possibility of triggering programmed malignant cell death by nanoelectropulses. Consistent with theoretical predictions and early studies, experimental results reported subsequently demonstrated that ultrashort, high-field electric pulses could induce intracellular responses in biological cells, including apoptosis of malignant cells, and even tumor growth inhibition.14, 15, 16 The ability to active apoptotic pathways and disturb intracellular processes noninvasively suggests applications for nanoelectropulse technology for both biological research laboratories and the clinic. Further investigations of electroperturbation must surmount technological challenges that include the flexible generation of shorter, higher field pulse patterns, and the assembly of visualization systems for high-resolution imaging of cellular structures and processes during pulse exposure. Here, we report the development of an integrated system consisting of a nanosecond high-voltage compact pulser, a micrometer electrode chamber, and a high-resolution fluorescence microscope. The imaging of dynamic biological responses triggered by nanoelectropulses in Jurkat T cells is also presented. 2.InstrumentationThe integrated experimental platform for electroperturbation dynamic imaging includes an epifluorescence microscope, two CCD cameras, a micropulser, a microchamber, supporting instruments, and two personal computers with image acquisition and processing software. Figure 1a illustrates the system schematically. Fig. 1(a) Scheme of the fluorescence microscopy imaging system for electroperturbation investigations, (b) micropulser mounted on the microscope stage, and (c) microchamber built on a glass slide. 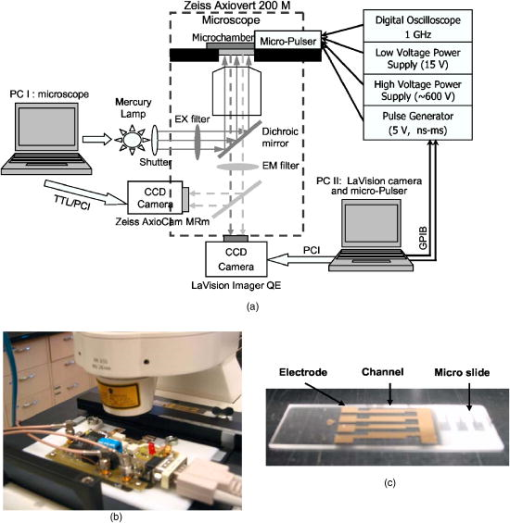 2.1.Microscopy Imaging PlatformA Zeiss 200M epifluorescence microscope with a water-immersion objective [numerical aperture ] and a five-channel filter turret (Carl Zeiss MicroImaging, Inc., Thornwood, New York) is the main observation platform. A motorized platform enables -stack imaging and deconvolution to achieve high-contrast fluorescence images and also enables time-lapse imaging for monitoring dynamic processes with a time resolution in seconds. Two CCD cameras—AxioCam MRm (Carl Zeiss MicroImaging, Inc., Thornwood, New York) and Imager QE (LaVision, Goettingen, Germany)—are installed on the top and base ports of the microscope, respectively. The micropulser (compact pulse generator) mated with the electrode microchamber (both built by our group) is mounted on the microscope stage in a standard frame insert [Fig. 1b]. Two computers control the microscope, cameras, and micropulser for pulse-synchronized image acquisition. Cells stained with fluorescent dyes are observed and monitored before, during, and after the application of nanoelectropulses. 2.2.Micropulser and Microchamber2.2.1.MicropulserThe micropulser is a compact pulse generator using solid-state metal-oxide semiconductor field effect transistor (MOSFET) devices to produce high voltage nanoelectropulses. It provides a square pulse output with duration down to and voltage up to , with a rise time below .17 The compact circuit design of the micropulser enables its direct mounting on the stage of the microscope using a standard frame holder. Through coaxial cables the micropulser is connected to a synthesized transistor-transistor logic (TTL) trigger source, dc power supplies, and a digital oscilloscope used to monitor pulse waveform, voltage, and current. These instruments are controlled by a computer through a general purpose interface bus (GPIB) interface. In addition, the pulse duration is adjustable from nanoseconds to milliseconds. This characteristic provides great flexibility for the study of pulse width effects under different electric fields. In a second-generation design, the micropulser includes a four-channel switch so that four separate groups of cells can be pulsed independently.18 2.2.2.MicrochamberWith a pulse amplitude maximum of , the spacing of the electrodes must be for an applied electric field. The fabrication of parallel metal electrodes over long with vertical walls of at least for live cell experiments is a challenge for conventional methods, even for microelectromechanical systems (MEMS) technology. We designed and fabricated a microchamber— wide, deep, and long—on a microscope standard glass slide using microelectronic technology. The optical image of a whole microchamber is shown in Fig. 1c. For uniformly vertical and parallel sidewalls, channels on a glass slide were formed with SU-8 photoresist.19 Two layers of film were deposited on the photoresist structure at different angles to cover the sidewalls of channels and patterned with a liftoff process.20 The vertical dimension of the chamber accommodates the lymphoid cell types under investigation, which have diameters around . The electrode spacing is suitable for generating megavolt-per-meter electric fields with nanosecond pulse amplitudes greater than (compatible with commercially available MOSFETs). For microscopic investigations, the micropulser-microchamber assembly is mounted on the microscope stage so that the cells in the exposure chamber can be directly observed and monitored. Generally, the microchamber loaded with cells is covered by a cover glass and electrically matched with the micropulser in ambient atmosphere at room temperature. 2.3.CCD Cameras and SoftwareTwo CCD cameras were used for fluorescence imaging. An AxioCam MRm [CCD monochrome, pixels, 1-ms to 20-s shutter time, UV-near-IR (NIR) spectral range], was controlled by the Zeiss image acquisition software AxioVision (Carl Zeiss MicroImaging, Inc., Thornwood, New York) through a PCI interface by computer I, shown in Fig. 1. The AxioVision program controls the microscope, including multichannel filters, excitation shutter, and AxioCam camera for multichannel, -stack, time-lapse image acquisition, and a deconvolution module for reconstructing 3-D images. The second camera, Imager QE from LaVision ( pixels, seven-electron sensitivity, 1 to 1000-ms shutter) is controlled by DaVis software (LaVision, Goettingten, Germany). This camera utilizes a two-stage Peltier system to operate at . The detection range is from 200 to 700 nm with highest quantum efficiency (65%) at 550 nm. In this paper, all image sequences (movies) were taken by this camera with time intervals from 15 to 500 ms. Through a PCI interface the camera can be controlled with either computer software or external hardware signals. It can also provide output triggers to other instruments, providing additional flexibility in experimental design. To enable fast data collection and analysis, customized functions for specific intensity and time export were added using macros composed in DaVis Command Language. LabView (National Instruments, Austin, Texas) was used to trigger the micropulser and to modify electric pulse characteristics such as pulse width and repetition rate. In this work, two personal computers were used to control the various instruments with different software and hardware links. The productivity of the system could be substantially improved by integration of all of these functions into a single computing system and instrument network. 3.Materials and Methods3.1.Cell Lines and Culture ConditionsHuman Jurkat T lymphocytes (ATCC TIB-152) were grown in RPMI (Roswell Park Memorial Institute) 1640 (Irvine Scientific) containing 10% heat-inactivated fetal bovine serum (Irvine Scientific), L-glutamine (Gibco-BRL), penicillin (Gibco-BRL), and streptomycin. 3.2.Fluorescent Molecular Probes
The absorption and emission peak wavelengths and filter sets for these fluorescent probes are summarized in Table 1 . Table 1Excitation and emission peak wavelength of fluorescence probes and the corresponding filters.
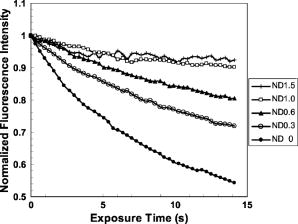
3.3.Experimental ConditionsAlthough the main effort for regular fluorescence imaging is to improve the emission intensity of stained cells, the priorities for living-cell observation are cell viability and the photostability of the staining. Strong excitation and high dye concentration are effective methods to increase the fluorescence intensity but they can induce serious cell damage and photobleaching. To balance imaging rate, image quality, photostability, and cell viability, photobleaching of Calcium Green staining was monitored with neutral density filters (ND) in the excitation light path. Figure 2 shows bleaching curves for Calcium Green in Jurkat cells using ND filters from 0 to 1.5. Calcium Green fluorescence decayed by 45% in without any filter (0). Here, stained cells were exposed to the full strength of the light source, a mercury lamp ( at the objective). The rapid bleaching makes it difficult to monitor fluorescence changes during dynamic observations, and the intense illumination induces cell damage, such as membrane blebs. The photobleaching data indicated that 1.0 ND could satisfy our requirements for limited cell damages, emission stability, good image quality, and proper acquisition rate. Data reported in this paper were recorded with 1.0 ND, except when total exposure time for sequential images was less than . 4.Observations and Imaging of ElectroperturbationA series of electroperturbation experiments was conducted for investigating cell biological responses to nanosecond, megavolt-per-meter electric fields, including the fluctuation of intracellular calcium ions, polarized PS translocation, and morphological changes in nuclei. To check cell membrane integrity, the extent of PI penetration was tested for both nanosecond and millisecond electrical pulses. 4.1.Calcium Bursts of Jurkat Cells under NanoelectropulsesSequential imaging of cells before, during, and after pulse exposure reveals a sharp increase in the fluorescence emission intensity of Calcium Green-loaded cells within seconds of pulse delivery, indicating a rise in the level of intracellular free calcium. The intensification occurs uniformly across the area of the whole cell [Fig. 3a ]. These images demonstrate a rapid intracellular calcium release triggered by nanoelectropulses. A plot of the quantitative intensity changes extracted from 14 cells [Fig. 3b] shows that the fluorescence intensity starts to rise within hundreds of milliseconds, continues to increase for approximately , then remains constant for at least several seconds. We have reported elsewhere11 that pulse-induced Calcium Green fluorescence intensification increases with pulse number, electric field, and repetition rate, and White also described the similar behavior in HL-60 cells.21 In our experiments, the imaging rate typically was , limited by the data transfer rate and camera exposure time, but localizing the source of calcium ions requires much faster speed. For this purpose, the image acquisition parameters were modified. First, the imaging area was reduced to a single cell or partial cell to reduce the data transfer time. Second, the exposure time was decreased to by removing the ND filter. However, no obvious localized intensification was found inside cells even by imaging at the shortest interval . Fig. 3Calcium bursts after four , pulses: (a) Calcium Green fluorescence images of Jurkat cells at 0, 0.6, 1.2, and after shocking, showing strong intensification, and (b) quantitative intensity changes in different cells induced by four pulses. Gray lines (Cell) represent individual cells; dark line (Avg) is the average value. 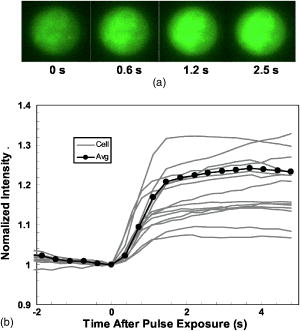 4.2.PI Penetration ControlTo examine cell membrane integrity after nanoelectropulse treatment, PI influx experiments were conducted with both nanosecond, high-field and millisecond, low-field pulses. As a conventional indicator of cell membrane permeability, PI has been widely used to study the reversible membrane breakdown induced by electrical pulses.4, 5, 6, 22 PI is normally excluded from viable cells with intact cell membrane. In the cytoplasm, PI molecules bind with nucleic acid, with an associated 20- to 30-fold increase in fluorescence, providing a convenient and reliable method for checking membrane integrity.23 No PI fluorescence intensification occurred in cells after four , pulses, but a single low-voltage, millisecond pulse ( , ) caused immediate PI entry into cells (within hundreds of milliseconds). Images of PI diffusion after portion (Fig. 4 ) demonstrate that PI molecules cross the cell membrane at the anode pole of the cell, then diffuse gradually throughout the cell. This asymmetric uptake of PI is in agreement with classical observations of electroporation.22, 24, 25 These control experiments demonstrate that the cell membrane is not permeant to small dye molecules and that it remains intact after nanoelectropulses, although it can be porated by long electrical pulses. Fig. 4PI asymmetric penetration induced by electroporation: , , 1 pulse: (a) image before pulse (0s), the cell in PI solution is dark; (b) image at after pulse exposure, a bright new-moon edge emerges on the bottom of cell, close to the anode electrode. It indicates PI enters cells at the anode first; (c) image at , the bright area expands at the anode and a weak fluorescence appears at the cathode; and (d) image at , the whole cell becomes extremely bright. (e) to (h) Cells before and after four , pulses. The arrow in images shows the direction of electric fields. 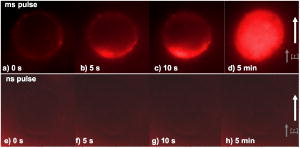 4.3.Externalization of Phosphatidylserine (PS)To study the transient responses of the cell membrane after nanoelectropulse exposure, FM 1-43 was used to track the PS translocation during temporal observations. FM 1-43 is a membrane probe widely utilized for vesicle cycling in living cells, but an indication of the phospholipid scrambling of plasma membrane was also reported.26 On the other hand, as an early indicator of apoptosis, PS externalization is commonly detected14, 16 with a fluorescent conjugate of annexin V. However, the annexin V assay requires incubation and washing, and is not readily adapted to real-time observations. In contrast, FM 1-43 can be observed directly without washing because its quantum yield of fluorescence is thousands of times greater in the lipid environment of the cell membrane than it is in aqueous solvent. Translocation of PS to the external leaflet of the membrane lipid bilayer attracts more FM 1-43 from the medium into the membrane, and the fluorescence further increases (Fig. 5 ). Before pulsing [Fig. 5a] the cell membrane displays a uniform weak emission, whereas strong fluorescence appears at the region closer to the anode electrode after nanoelectropulse application [Figs. 5b and 5c], indicating a localized, pulse-driven translocation of PS in this area of the cell membrane. FM 1-43 fluorescence intensification occurs at the anode pole of the cell within milliseconds after pulse exposure, then gradually increases by 10 to 30% over the next few seconds. Fig. 5FM 1-43 fluorescence images of Jurkat cells: (a) images at 0, 2, and after pulsing ( , , four pulses), intensification occurred at anode areas but not cathodes; (b) amplified images of anode areas; and (c) profile of the left cell in image (a), where an arrow shows the location and direction of the profile. The solid line is the intensity distribution of the cell at after pulses and the dotted line represents that before pulses. There are some bright spots inside cells because actively growing cells cycle stained membrane into intracellular vesicles. 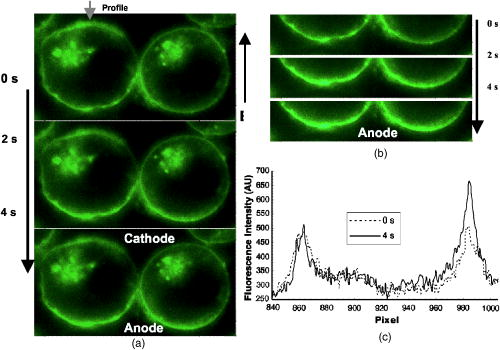 Figure 6 demonstrates the representative intensity changes, which were observed in hundreds of cells, at different membrane areas after pulsing. This immediate pulse-induced fluorescence increase always occurs at the anode pole, never at the cathode end of the cell or at the equatorial regions. Cathodic pole fluorescence in fact often exhibits a pulse-induced fluorescence decrease. However, the polarized fluorescence pattern dissipates after about 1 min as a result of lateral (circumferential) diffusion of PS within the membrane outer leaflet, which corresponds with fluorescent annexin V observations.9 This predominantly anodic polarization pattern is consistent with published images of electroporated cells.24, 25 Based on both previous reports9, 14 of pulse-induced PS externalization visualized with conventional annexin V assay and the association of the phospholipid scrambling with FM 1-43 membrane staining,26 we assumed that the polarized transient intensification in pulsed cells are indicative and associated with PS externalization. The images can be interpreted in two possible ways: (1) high electric fields cause PS translocation directly by reorienting the head group dipole and (2) transient nanopores formed by nanoelectropulses provide a pathway for PS molecules to migrate from the inner membrane leaflet to the external face of the cell.16 Because FM 1-43 is a doubly charged cation, one might also assume that a pulse-driven electrophoretic migration of the dye into the membrane could produce a fluorescence increase at the anodic pole of the cell. To test this idea, we conducted similar experiments with DiI ( -dioctadecyl- -tetramethylindocarbocyanine perchlorate, Molecule Probes Inc., Eugene, Oregon), a membrane-labeling dye that is also a divalent cation and that has been used in the studies of electrophoresis of cell membrane components.27 No fluorescence intensification of DiI in the membrane was observed even with much higher electric fields and pulse counts than we used for the FM 1-43 experiments. The fluorescence weak decay at cathodes may be due to the PS internalization in high electric fields. Because the population of PS on the outer leaflet is much lower than the inner membrane leaflet, the change is relatively small. The polarized intensification was recorded in more than hundreds of cells in later experiments. Here, we show only a group of representative images. These results provide important information for studies of electroperturbation mechanisms and membrane response models. Fig. 6Plot of fluorescence intensity of FM 1-43 at different areas of the cell membrane. The fluorescence kept rising at anodes after pulsing, but not at equatorial and cathodic regions, where the intensity even slightly decayed. C1 and C2 indicate two cells. Anod, Equat, and Cath represent the areas on the cell membrane close to the anode electrode, between anode and ground, and the ground electrode. 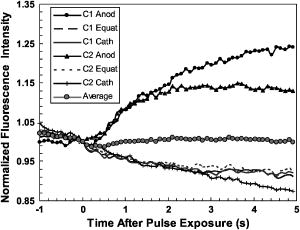 4.4.Nucleus PerturbationAlthough evidence supports the hypothesis that nanoelectropulses mainly disrupt intracellular compartments, the effects on intracellular organelles and processes are not fully understood, especially for the nucleus and its contents—only a few reports in this specific area have appeared.13, 15, 28, 29 DNA damages and fragmentation induced by electric pulses were found based on electrophoresis results,13, 15, 28 where DNA molecules were analyzed after extracted from lysed cells. Chen observed the nuclear response in living cells—a slight pulse-induced fluorescence quenching of acridine-orange (AO)-stained nuclei, which they suggested resulted from the DNA∕AO complex moving out of the pulse-damaged nuclear envelope.29 Understanding the responses of chromatin and nuclei to pulsed high electric fields, especially in living cells, may benefit the potential applications of nanoelectropulse to cellular manipulation and cancer therapy. In this paper, we also describe observations of nuclear morphological and chromatin∕DNA structural changes after nanoelectropulse treatment of cells stained with the nucleic acid probe Hoechst 33342 (H342). Figure 7 shows Jurkat cells stained with H342, a common dye for double-stranded DNA and widely utilized for nuclear staining of living cells. After multiple nanoelectropulses, nuclear enlargement and fluorescence quenching were observed (Fig. 7B). In the image taken at , the intensity changes were still small, but after , they became significant. These observations are in agreement with the quantitative intensity records from sequential images of pulsed and control cells, seen in Fig. 7B(f). Fig. 7Nuclear enlargement and H342 fluorescence quenching after 200 pulses ( , ). A: a cell stained with H342, a differential interference contrast (DIC) image of the same cell, and a composite. B: (a), (b), and (c) fluorescence images of a nucleus at , , and after pulsing, respectively, showing quenching of the H342 fluorescence; (d) and (e) demonstrate the postpulse enlargement of the nucleus and the reticular pattern associated with the pulse-induced reduction in fluorescence intensity; and (f) fluorescence intensity changes of H342 in pulsed cells ( , , 200 pulses) and control cells. 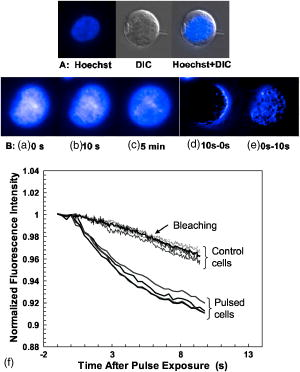 The pulse-induced decrease in H342 fluorescence may indicate DNA damage or chromatin structural changes that modify the number and type of sites available for specific and nonspecific binding30, 31, 32 by H342. We suggest that DNA fragmentation or modifications of chromatin configuration may be caused by either directly pulsed megavolt-per-meter electric fields or as a result of intracellular or specifically intranuclear fluctuations in pH or ionic homeostasis. 5.ConclusionsThe dynamic responses of human lymphocytes to nanosecond pulsed electric fields were investigated with a modified fluorescence microscopy imaging system. Integrating pulsed-power technology, microelectronic fabrication, digital imaging, and fluorescence microscopy, this system enables live observations of electroperturbation phenomena related to intracellular calcium concentration, cell membrane phospholipid distribution, and the organization of nuclear material. Nanoelectropulse-triggered intracellular calcium release was visualized in milliseconds with the calcium-sensitive fluorescent indicator Calcium Green. Using FM 1–43, polarized PS externalization and lateral diffusion after nanoelectropulse exposure were recorded for the first time with this system, and pulse-induced nuclear enlargement and H342 fluorescence quenching were observed in Jurkat cells, suggesting disturbances in the intranuclear environment resulting from ultrashort, high-field pulses. These results contribute to our understanding of the perturbative effects of nanosecond, megavolt-per-meter electric pulses on biological cells and tissues, and they demonstrate how fluorescence microscopy combined with nanosecond-pulsed-power technology provides an effective technique for investigating this new area of bioelectrical engineering and cell biology. AcknowledgmentsThis work was supported by grants from the Air Force Office of Scientific Research and the Whitaker Foundation. The authors gratefully acknowledge Peter Gabrielsson and Xianyue Gu for stimulating discussions and technical assistance in setting up the electrical system. ReferencesA. J. H. Sale and
W. A. Hamilton,
“Effects of high electric fields on microorganisms—I. Killing of bacteria and yeasts,”
Biochim. Biophys. Acta, 148 781
–788
(1967). https://doi.org/10.1016/0304-4165(67)90052-9 0006-3002 Google Scholar
U. Zimmermann,
G. Pilwat, and
F. Riemann,
“Dielectric breakdown of cell membranes,”
Biophys. J., 14 881
–899
(1974). 0006-3495 Google Scholar
E. Neumann,
M. Schaefer-Ridder,
Y. Wang, and
P. H. Hofschneider,
“Gene-transfer into mouse lyoma cells by electroporation in high electric-fields,”
EMBO J., 1 841
–845
(1982). 0261-4189 Google Scholar
U. Zimmermann,
“The effect of high intensity electric field pulses on Eukaryotic cell membranes: fundamentals and applications,”
Electromanipulation of Cells, 1
–106 CRC Press, New York
(1995). Google Scholar
E. Neumann,
A. E. Sowers, and
C. A. Jordan, Electroporation and Electrofusion in Cell Biology, Plenum Press, New York
(1989). Google Scholar
M. P. Rols and
J. Teissie,
“Electropermeabilization of mammalian cells to macromolecules: control by pulse duration,”
Biophys. J., 75 1415
–1423
(1998). 0006-3495 Google Scholar
M. Golzio,
M. P. Rols, and
J. Teissie,
“In vitro and in vivo electric field-mediated permeabilization, gene transfer, and expression,”
Methods, 33 126
–135
(2004). 1046-2023 Google Scholar
K. H. Schoenbach,
S. J. Beebe, and
E. S. Buescher,
“Intracellular effect of ultrashort electrical pulses,”
Bioelectromagnetics (N.Y.), 22 440
–448
(2001). https://doi.org/10.1002/bem.71 0197-8462 Google Scholar
P. T. Vernier,
A. Li,
L. Marcu,
C. M. Craft, and
M. A. Gundersen,
“Ultrashort pulsed electric fields induce membrane phospholipid translocation and caspase activation: differential sensitivities of Jurkat T lymphoblasts and rat glioma C6 cells,”
IEEE Trans. Dielectr. Electr. Insul., 10 795
–809
(2003). 1070-9878 Google Scholar
R. P. Joshi and
K. H. Schoenbach,
“Electroporation dynamics in biological cells subjected to ultrafast electrical pulses: a numerical simulation study,”
Phys. Rev. E, 62 1025
–1033
(2000). https://doi.org/10.1103/PhysRevE.62.1025 1063-651X Google Scholar
P. T. Vernier,
Y. Sun,
L. Marcu,
S. Salemi,
C. M. Craft, and
M. A. Gundersen,
“Calcium bursts induced by nanosecond electric pulses,”
Biochem. Biophys. Res. Commun., 310 286
–295
(2003). https://doi.org/10.1016/j.bbrc.2003.08.140 0006-291X Google Scholar
P. T. Vernier,
“Intracellular perturbations induced by nanosecond, megavolt-per-meter electric fields: bioelectrical engineering with pulsed power,”
University of Southern California,
(2004). Google Scholar
F. Hofmann,
H. Ohnimus,
C. Scheller,
W. Strupp,
U. Zimmermann, and
C. Jassoy,
“Electric field pulses can induce apoptosis,”
J. Membr. Biol., 169 103
–109
(1999). 0022-2631 Google Scholar
S. J. Beebe,
P. M. Fox,
L. J. Rec,
K. Somers,
R. H. Stark, and
K. H. Schoenbach,
“Nanosecond pulsed electric field (nsPEF) effects on cells and tissues: apoptosis induction and tumor growth inhibition,”
IEEE Trans. Plasma Sci., 30 286
–292
(2002). https://doi.org/10.1109/TPS.2002.1003872 0093-3813 Google Scholar
S. J. Beebe,
J. White,
P. F. Blackmore,
Y. P. Deng,
K. Somers, and
K. H. Schoenbach,
“Diverse effects of nanosecond pulsed electric fields on cells and tissues,”
DNA Cell Biol., 22 785
–796
(2003). https://doi.org/10.1089/104454903322624993 1044-5498 Google Scholar
P. T. Vernier,
Y. H. Sun,
L. Marcu,
C. M. Craft, and
M. A. Gundersen,
“Nanosecond pulsed electric fields perturb membrane phospholipids in T lymphoblasts,”
FEBS Lett., 572 103
–108
(2004). https://doi.org/10.1016/j.febslet.2004.07.021 0014-5793 Google Scholar
M. Behrend,
A. Kuthi,
X. Gu,
P. T. Vernier,
L. Marcu,
C. M. Craft, and
M. A. Gundersen,
“Pulse generators for pulsed electric field exposure of biological cells and tissues,”
IEEE Trans. Dielectr. Electr. Insul., 10 820
–825
(2003). https://doi.org/10.1109/TDEI.2003.1237331 1070-9878 Google Scholar
M. A. Gundersen,
M. R. Behrend,
Y. Sun,
P. T. Vernier, and
A. Kuthi,
“Four-channel pulser generator for real-time biological investigations,”
210
–215
(2004). Google Scholar
W. W. Flack,
W. P. Fan, and
S. White,
“The optimization and characterization of ultra-thick photoresist films,”
Proc. SPIE, 3333 67
–71
(1998). 0277-786X Google Scholar
Y. Sun,
P. T. Vernier,
M. Behrend, and
M. A. Gundersen,
“Electrode microchamber for non-invasive perturbation of mammalian cells with nanosecond pulsed electric fields,”
IEEE Trans. Nanobiosci., 4 277
–283
(2005). 1536-1241 Google Scholar
J. A. White,
P. F. Blackmore,
K. H. Schoenbach, and
S. J. Beebe,
“Stimulation of capacitative calcium entry in HL-60 cells by nanosecond pulsed electric fields,”
J. Biol. Chem., 279 22964
–22972
(2004). 0021-9258 Google Scholar
C. S. Djuzenova,
U. Zimmermann,
H. Frank,
V. L. Sukhorukov,
E. Richter, and
G. Fuhr,
“Effect of medium conductivity and composition on the uptake of propidium iodide into electropermeabilized myeloma cells,”
Biochim. Biophys. Acta, 1284 143
–152
(1996). 0006-3002 Google Scholar
B. Gabriel and
J. Teissie,
“Direct observation in the millisecond time range of fluorescent molecule asymmetrical interaction with the electropermeabilized cell membrane,”
Biophys. J., 73 2630
–2637
(1997). 0006-3495 Google Scholar
K. Kinosita,
I. Ashikawa,
N. Saita,
H. Yoshimura,
H. Itoh,
K. Nagayama, and
A. Ikegami,
“Electroporation of cell—membrane visualized under a pulsed-laser fluorescence microscope,”
Biophys. J., 53 1015
–1019
(1988). 0006-3495 Google Scholar
A. Zweifach,
“FM 1-43 reports plasma membrane phospholipid scrambling in T-lymphocytes,”
Biochem. J., 349 255
–260
(2000). 0264-6021 Google Scholar
M.-M. Poo,
“In situ electrophoresis of membrane components,”
Annu. Rev. Biophys. Bioeng., 10 245
–276
(1981). https://doi.org/10.1146/annurev.bb.10.060181.001333 0084-6589 Google Scholar
M. Stacey,
J. Stickley,
P. Fox,
V. Statler,
K. H. Schoenbach,
S. J. Beebe, and
S. Buescher,
“Differential effects in cells exposed to ultra-short, high intensity electric fields: cell survival, DNA damage, and cell cycle analysis,”
Mutat Res., 542 65
–75
(2003). 0027-5107 Google Scholar
N. Y. Chen,
K. H. Schoenbach,
J. F. Kolb,
R. J. Swanson,
A. L. Garner,
J. Yang,
R. P. Joshi, and
S. J. Beebe,
“Leukemic cell intracellular responses to nanosecond electric fields,”
Biochem. Biophys. Res. Commun., 317 421
–427
(2004). 0006-291X Google Scholar
T. Stokke and
H. B. Steen,
“Multiple binding modes for Hoechst 33258 to DNA,”
J. Histochem. Cytochem., 33 333
–338
(1985). 0022-1554 Google Scholar
J. V. Watson,
A. Nakeff,
S. H. Chambers, and
P. J. Smith,
“Flow cytometric fluorescence emission-spectrum analysis of Hoechst-33342-stained DNA in chicken thymocytes,”
Cytometry, 6 310
–315
(1985). 0196-4763 Google Scholar
L. Chiu,
H. Cherwinski,
J. Ransom, and
J. F. Dunne,
“Flow cytometric ratio analysis of the Hoechst 33342 emission spectrum: multiparametric characterization of apoptotic lymphocytes,”
J. Immunol. Methods, 189 157
–171
(1996). 0022-1759 Google Scholar
|

