

|
|
1.Background and IntroductionConfocal microscopes are used in bench top biological investigations to perform optical sectioning,1 and can be used for in vivo imaging if the objectives and scanning mechanisms can be made sufficiently small. Over the past decade, numerous efforts have been made to miniaturize confocal microscopes. 2, 3, 4, 5, 6, 7 In order to achieve subcellular resolution with a conventional single-axis confocal microscope, a high numerical aperture (NA) is necessary, generally utilizing complex and bulky objectives lenses for diffraction-limited focusing of beams over a wide field of view. Geometrically, a high NA correlates to a short working distance for a given aperture size, thus limiting the depth at which subsurface imaging may be performed in tissue. Due to short working distances, scanning must be performed prior to the objective, which limits the field of view and introduces optical aberrations unless compensated for by the use of multiple lenses.4 Scaling down the optics unavoidably requires a sacrifice of resolution, field of view (FOV), and/or working distance (WD). In addition, the conventional single-axis confocal design is limited in its ability to effectively reject the large amounts of scattered light generated when imaging deeply in tissues (see Section 2).8 In the United States, colorectal carcinoma is the second leading cause of death by cancer. Dysplasia is a precancerous condition that has a latency period of 5 to 10 years, where early detection is preventative. Colonic polyps are generally classified as adenomatous (dysplastic) or hyperplastic (benign). An endoscope-compatible confocal microscope that can distinguish among normal, hyperplastic, and dysplastic colonic mucosa may significantly improve the efficiency of colorectal cancer screening. In order to distinguish histological differences in colonic mucosa, observation of glandular morphology with subcellular detail is needed. Thus, an axial and transverse resolution of at least is required for resolving nuclear features, and an FOV and WD greater than is needed to span the dimensions of the mucosa, which is the primary origin of epithelial neoplasia. The dual-axes confocal architecture uses low-NA lenses to achieve high-resolution imaging with a long WD. 8, 9, 10, 11 Furthermore, the incident beams are on-axis to the low-NA lenses at all times, and scanned post-objectively. This configuration allows the design to be scaled down to millimeter dimensions, for endoscopic use, while preserving diffraction-limited optical quality and image resolution. Scanning can then be performed with a micro-mirror fabricated with MEMS technology.5 Over the past decade or so, an optical vertical sectioning technique, known as optical coherence tomography (OCT), has been developed for reflectance imaging in tissue. 12, 13, 14, 15, 16, 17 OCT, in its most basic form, uses an interferometer to analyze coherent light backscattered from a layer of tissue, by interfering it with light traveling along a reference path of nearly equal length. A low-coherence (broadband) light source, whose coherence length defines the axial resolution of the image, is used. While OCT utilizes the coherence properties of light to produce optical sectioning, the confocal effect utilizes spatial filtering to achieve sectioning. Previously, we demonstrated a dual-axes microscope that utilized a broadband light source for the additional sectioning performance provided by a low-coherence gate. Here, we demonstrate that a narrowband light source may be used without a coherence gate, in a refined dual-axes prototype, to generate high-quality images in the colon. This results in greater simplicity of instrument design and possibly reduced cost. Furthermore, there is the potential to incorporate incoherent imaging modalities such as fluorescence for functional imaging of molecular biomarkers.18, 19 2.TheoryThe point spread function for the dual-axes confocal architecture can be derived from diffraction theory, using the paraxial approximation, to calculate the response and resolution of the system. This theory takes into account the effect of finite apertures that result in truncated Gaussian beams, which is relevant to a fiber-optic-coupled instrument. First, from Fig. 1 , the coordinate transformations of the illumination and collection beams in terms of the dual-axes coordinates may be expressed as In Fig. 1, and are the half-angles of the focused illumination and collection beams in the sample medium, defined by the radii of the focusing lenses, and , respectively. is the half-angle at which the beam axes intersect, also specified within the sample medium. A set of general dimensionless coordinates may be defined along the illumination and collection axes:20 where the illumination and collection wavenumbers are respectively defined as and . and are the wavelengths of the illumination and collection beams in free space, respectively, and is the sample's index of refraction. For the reflectance system described here, .Fig. 1Schematic diagram of the dual-axes design. The main lobe of the point spread function of the illumination beam (light-gray oval) at the focal point has a narrow transverse but a long axial dimension. The main lobe of the collection beam (dark-gray oval) is similar in shape. The intersecting region (black oval) is characterized by narrow transverse dimensions, and , and a reduced axial dimension, .  The amplitude point spread function (PSF) is an expression that describes the spatial distribution of the electric field of the focused beams. The PSF of the illumination and collection beams are proportional to the integrals below:20 where is the Bessel function of order zero, and is a normalized radial distance variable at the lens aperture. The weighting function, , describes the truncation (apodization) of the beams. For uniform illumination, . For Gaussian illumination with the cut-off aperture located at the intensity fall-off point, the weighting function is . In this system, the beams are truncated at the point where 99% of the Gaussian beam power is transmitted. For a Gaussian beam with a radius ( intensity) given by , an aperture with diameter passes approximately 99% of the beam’s power.21 In this case, the weighting function isFor a single-axis confocal microscope, the illumination and collection PSFs at the focal plane , denoted by , are identical as a function of the radial distance , and with , are The detector output from a point reflector, , is proportional to the power received, which is proportional to the square of the product of the overlapping point spread functions: where is a constant.For uniform illumination , the detector output for a single-axis system is Similarly, since the depth of focus for a single beam, described within the third term (exponential term) in the integral product in Eqs. 3, 4, is much larger than the transverse width of a single beam, that exponential term may be neglected to solve for the response of the dual-axes system near the focus, for uniform illumination:In a previous article,22 this expression was used with Eqs. 1, 2 to derive expressions for imaging resolution in the case of uniform illumination. However, these expressions overpredict the resolving power of the actual system since Gaussian beams are propagated by single-mode fibers, rather than uniform illumination. For non-uniform illumination, taking into account truncated Gaussian beams, the detector power given by Eq. 7 may be numerically solved as a function of axial and transverse displacements ( and ), with the aid of the PSFs expressed in Eqs. 3, 4. The integrals are evaluated in Matlab, using the 99%-transmission weighting function given in Eq. 5. A symmetric setup is assumed (identical illumination and collection optics) with , , , and (see Section 3.1 for details). In Fig. 2a , the theoretical axial response is plotted for the dual-axes system, along with an axial response for a single-axis confocal with an identical (FWHM) axial resolution of . The main lobe of the single-axis response falls off as whereas the dual-axes response falls off as a Gaussian as , offering superior dynamic range and rejection of out-of-focus scattered light. A numerically simulated transverse response, for the same dual-axes system, is shown in Fig. 2b.Fig. 2(a) Theoretical axial response to a point reflector for a dual-axes and single-axis confocal with equivalent (FWHM) axial resolutions of . Gaussian beams are assumed, truncated to allow 99% power transmission. Dual-axes specifications: ; , , . The single-axis . The main lobe of the single-axis response falls off as , whereas the dual-axes response falls off as , as expressed in Eq. 13, offering superior scattering rejection and dynamic range. (b) Theoretical transverse response ( and ) to a point reflector for a dual-axes confocal. Dual-axes specifications are identical to the system analyzed in part (a) (using truncated Gaussian beams). Simulated (FWHM) resolutions are 2.41 and , for the and directions, respectively. 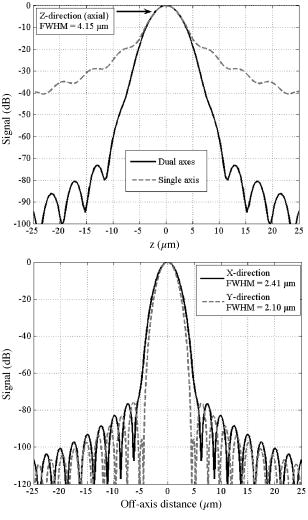 The truncated Gaussian illumination model, which realistically models the fiber-optic-coupled system used, gives theoretical FWHM resolutions of , , and [Figs. 2a and 2b]. Finally, a simple expression for the dual-axes resolution may be calculated for full (untruncated) Gaussian beams by analytically solving the diffraction integral given in Eqs. 3, 4. In the absence of an aperture, the integrals in Eqs. 3, 4 are now carried out to infinity:23 The collection PSF, , is analogous. These calculations are performed for a point reflector at the focal plane with the 99% Gaussian weighting function given earlier in Eq. 5. Substituting Eq. 2 yieldswhere the small-angle assumption is made that . Note that refers to the beam half-angle referenced to the lens aperture, or in this case, the 99% power-transmission half-angle of the Gaussian beams.The coordinate transformations of Eq. 1 may be used, along with Eq. 11, to solve for the detector signal, Eq. 7. For the transverse response at the focal plane , the signal may be written as Similarly, for the axial response, we assume so thatFor a symmetric dual-axes reflectance confocal, and . The FWHM resolutions may be calculated from Eq. 12, 13:For the prototype used in this study, Eq. 14 yields a theoretical resolution (FWHM) of , , and for untruncated Gaussian beams. Note that these FWHM values differ significantly, by about 12%, from the truncated Gaussian beam simulations shown in Figs. 2a and 2b. This results from the fact that significant diffraction effects exist even though a large aperture is used to allow 99% power transmission of our Gaussian beams.21 The most accurate value for the theoretical resolution of our dual-axes confocal, with Gaussian beams truncated to allow 99% power transmission, was therefore numerically derived and shown in Figs. 2a and 2b. An empirical expression, for convenient use in calculations, is Eq. 14 increased by 12%:3.Materials and Methods3.1.Optical DesignPreviously, we demonstrated a dual-axes confocal reflectance microscope to distinguish squamous from glandular mucosa in the setting of Barrett’s esophagus.11 In that system, a broadband light source provided a low-coherence gate to suppress the large spatial side lobes (diffraction fringes) due to heavily truncated beams. The current system, with less Gaussian beam truncation (99% power transmission), reduces side-lobe levels for improved performance with a narrowband light source and no coherence gate. In addition, the increased power transmission makes the system more optically efficient. Figure 3 illustrates the optical circuit. The focusing lenses, and , have been replaced by microscope objectives (Nikon EPI SLWD 10x) to increase the NA from 0.16 to 0.21, resulting in a resolution of to achieve subcellular imaging. Also, optimized collimating lenses, and , are employed (Lightpath GPX-10-30) so that the beams are truncated by and to allow 99% power throughput. Finally, we have modified the microscope stage so that the tissue sits on a fused-silica hemisphere, providing several advantages:
One feature of note for the hemisphere is that the curved surface affects the trajectory of the beams as they are scanned. The hemisphere acts to demagnify the scanning range of the beams, to first order, by .24 For example, a axial translation of the stage causes the beams to scan within the sample. Similarly, lateral translations are demagnified by roughly . These effects have been validated by ray-tracing simulations (Zemax). All image dimensions presented in this study have been experimentally measured and calibrated. The space-efficient hemispherical scanning stage enables larger deflections, and therefore a larger scan range, to be made by the galvanometric scan mirror and the piezoelectric vertical translation stage. This eliminates stitching artifacts from having to tile smaller images. The full deflection of the scan mirror (GSI Lumonics VM500) and a 1-mm piezo stage (Physik Instrumente P-290) are used to achieve a field of view within the sample of by (vertical by horizontal). The mirror is scanned with a sinusoid waveform at (fast axis), and the piezo stage is scanned with a sawtooth waveform at (slow axis). A frame-grabber pixel rate of is utilized to acquire images that are 725 pixels high by 750 pixels wide at one frame per second. Balanced heterodyne detection is accomplished by using an acousto-optic modulator to frequency-shift the 1% reference arm radiation by . A beat signal at this frequency is produced by a fiber Mach–Zehnder interferometer (Newport 50/50 fiber coupler). The interferometer mixes the radiation collected from the sample arm with that from the reference arm. When a broadband light source is used (AFC Technologies Inc. BBS1310B-TS), it is necessary to match the path lengths of the reference and sample arms to within the coherence length of the source . A polarization controller in the reference arm also helps to maximize the heterodyne signal and contrast. The 55-MHz carrier signal, detected with an balanced receiver (New Focus), is demodulated with a spectrum analyzer at a video bandwidth of . The log-compressed output is fed into an 8-bit frame grabber, digitized, and displayed at one frame per second. The narrowband light source, which was preferentially used in this study, is a diode-pumped nonplanar ring oscillator laser at (JDS Uniphase, formerly Lightwave Electronics 125-1319-100). The line width of this laser is , corresponding to a coherence length of over . Imaging at enables deep-tissue penetration, is a convenient telecom region where fiber-optic components are readily available at low cost, and is a wavelength that has been well utilized in previous studies.13, 14, 15 Optical heterodyning is a well-established technique in laser-scanning microscopy.25 Coherent detection at a precise heterodyne frequency ( in this case) provides optical amplification in order to overcome detector noise to reach the shot-noise limit and to improve image contrast deep within scattering media (several mean-free paths) for single-axis confocal microscopes.26 The assumed reason for this improvement is that the detection is limited by a diminutive signal from loss of light, so that detector noise dominates, rather than background noise from scattered light. This is even more true in dual-axes confocal microscopy, which exhibits improved rejection of scattered light [Fig. 2a], albeit at the cost of low-NA collection (lower signal). Therefore, coherent optical amplification is utilized to obtain the sensitivity described in Section 4.1 and to image with deep-tissue penetration, especially at the fast frame rates and short-pixel dwell times desired. Photomultiplier tubes (PMTs), which exhibit low dark counts and noise-free gain, are a possible alternative to heterodyne detection. PMTs at are available but are currently too expensive to consider for use at this wavelength. 3.2.Tissue Samples and PreparationInformed consent was obtained from all patients in this study, approved by the Institutional Review Board (IRB) of the Stanford University School of Medicine. Fresh biopsy specimens were collected by pinch biopsy during routine colonoscopy, stored in a saline solution, and placed on ice. The specimens were then imaged within an hour of resection. Immediately prior to imaging, 5% acetic acid was applied topically to improve contrast. After image collection, the specimens were fixed in formalin and submitted for routine histology (H&E). Five to ten specimens each, of normal mucosa, hyperplastic polyps, and adenomatous polyps, were obtained from 15 patients. 4.Results and Discussion4.1.System CharacterizationA plane mirror is used to measure the axial response of the system. A reflecting edge is also used to measure the transverse response. An axial resolution of and a transverse resolution of (FWHM) is measured, comparing well with the theoretical diffraction-limited results calculated in Section 2. The system sensitivity is measured by attenuating a known intensity of reflected light collected from an air–glass interface until unit SNR is achieved. At a measurement bandwidth of , the minimum detectable signal intensity is approximately . The maximum intensity of light incident on the sample is approximately . By defining “sensitivity” as the ratio of these two values, a sensitivity of is calculated, a comparable figure to that achieved by OCT. In practice, the dynamic range is reduced by optical-coupling losses, as well as by sample absorption and scattering. 4.2.Narrowband vs. Broadband PerformanceThe axial response of the dual-axes system to reflection from the flat surface (glass–air interface) of the hemispherical sample holder was measured. Figures 4a and 4b plot the narrowband and broadband responses, respectively, as a function of axial displacement. In Fig. 4a, a simulated response is also shown, calculated (in Matlab) using diffraction theory by integrating Eq. 7 over the entire plane to model a plane reflector. The reduced noise floor in the wings of the plot shown in Fig. 4b suggests that the coherence gate additionally reduces the collection of out-of-focus scattered light. However, for both the narrowband and broadband systems, signal from scattered light within of the focal plane is the dominant noise source, resulting in similar image quality. The use of a broader-band light source may improve the ability of the coherence gate to reject out-of-plane scattered light, but at greater cost and design complexity. Fig. 4(a) Axial ( -direction) response to a plane reflector using a narrowband laser source and no coherence gate. The dashed curve represents the simulated response to a plane reflector, calculated using diffraction theory. (b) Axial ( -direction) response to an air–glass interface using a broadband light source to provide a low-coherence gate.  The vertical sections, shown in Figs. 5a and 5b , are taken from a premalignant (adenomatous) polyp. These figures demonstrate the comparable image quality obtained with a narrowband or broadband source (low-coherence gate). The broadband system introduces the additional complexity of having to adjust the delay stage in order to match the reference and sample arm lengths through a full vertical scan. Although translating the sample holder does not alter the physical path length of the sample arm during vertical scanning, focusing the beams deeper into tissue increases the effective path length of the sample arm due to the higher index of tissue compared to air. Therefore, a large vertical scan requires an adjustment of the delay stage. This was done manually in this system, resulting in the slight tiling artifacts in Fig. 5b. Fig. 5(a) Vertical section image of an adenomatous polyp using a narrowband laser source. See text for details. (b) Vertical section image of an adenomatous polyp using a broadband light source. See text for details. 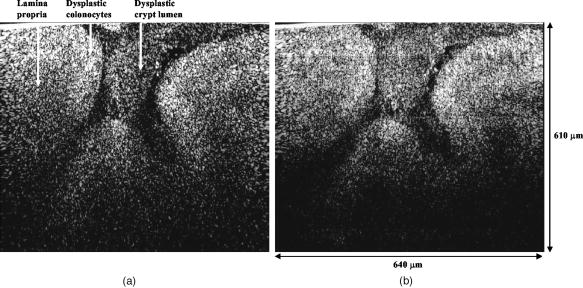 All subsequent images presented in this article were obtained without a coherence gate using a narrowband source. 4.3.Images of Colonic MucosaAs shown in Fig. 6a , normal colonic mucosa reveals regularly spaced crypts extending vertically in the plane perpendicular to the mucosal surface. Horizontal (en face) images were rendered in software (Amira 3.0) after acquiring many vertical sections at increments. Note that the horizontal renderings are under-resolved in one direction since the vertical slices used to reconstruct the horizontal image are obtained at increments, whereas proper sampling in fulfillment of the Nyquist criteria would require increments (transverse resolution is ). Figure 6b displays a horizontal rendering, at beneath the tissue surface, of 80 vertical image slices of normal mucosa. In this horizontal section, a high-intensity ring is observed that can be localized to the nuclei of the colonocytes populating the basal periphery of the crypts. The corresponding histology is shown in Fig. 6c. The crypts are fairly circular in appearance and are uniformly separated with goblet cells (clear, mucin-filled vacuoles) surrounding the crypt lumen. Fig. 6(a) Vertical section image of normal colonic mucosa, showing vertical crypt channels. (b) A horizontal section image 150 microns beneath the mucosal surface of a normal colonic biopsy, rendered from 80 vertical sections. (c) A horizontal histological image (H&E staining) of normal colonic mucosa.  In respective order, Figs. 7a, 7b, 7c show a vertical section, a rendered horizontal section, and the corresponding histology from a biopsy specimen of a hyperplastic (benign) polyp. Excess cytoplasmic mucin in the colonocytes gives the characteristic appearance of an undulating “star-shaped” pattern in the luminal cross-section of the hyperplastic crypts. Fig. 7(a) Vertical section image of mucosa from a hyperplastic polyp. (b) Horizontal section image 75 microns beneath the mucosal surface of a hyperplastic polyp, rendered from 60 vertical sections. (c) Histology (H&E staining) of the hyperplastic polyp imaged in parts (a) and (b).  A vertical section of an adenomatous polyp is shown in Fig. 8a . Significant contrast is visible between the colonocytes lining the crypt lumen and the lamina propria. This contrast is evident in the rendered horizontal sections shown in Figs. 8b and 8c, taken from two different adenomatous polyp biopsies. In dysplastic colonic mucosa, the diameter of the crypts is increased, as is the size of the colonocytes lining the crypt lumen. Furthermore, the crypts are morphologically distorted, lacking a consistently-circular cross-sectional shape and appearing more elliptical in cross-section. The nuclei are “atypical,” in that nuclei are larger and more stratified, making for a thickened nuclear layer in the epithelium lining the colonic crypts, as seen in Fig. 8d. These nuclear features, along with irregularities in the crypt architecture, are characteristic of dysplasia. Thick bright rings are seen in Figs. 8a, 8b, 8c, likely caused by increased scattering from enlarged nuclei. The increased light-scattering properties of dysplastic nuclei have been confirmed in other studies.27 Fig. 8Vertical section image of mucosa from an adenomatous (dysplastic) polyp, showing a large crypt channel lined by a thick layer of highly scattering colonocytes. (b) Horizontal section 125 microns beneath the mucosal surface of the adenomatous polyp shown in part (a), rendered from 80 vertical sections. (c) Horizontal section image 100 microns beneath the mucosal surface of an adenomatous polyp, rendered from 80 vertical sections. (d) Histology (H&E staining) of an adenomatous polyp.  For preliminary quantitative image comparison, the contrast-to-noise ratio (CNR) is defined as This figure of merit accounts for different gain settings between images by normalizing with a background noise term ( , here defined as the standard deviation in the pixel intensities of the crypt lumen. and are the average intensities of the pixels within a chosen region of interest in our raw images. For all noise and intensity calculations, square regions are chosen that are 20 by 20 pixels in dimension. Figure 9 plots the CNR for both the highly scattering nuclei as well as the lamina propria, in normal, hyperplastic, and dysplastic (adenomatous) mucosa. In each case, the CNR from 10 representative image regions are averaged to obtain the values plotted in Fig. 9. Compared to benign mucosa (normal and hyperplastic), the nuclear CNR is significantly higher for dysplastic mucosa, as expected due to nuclear atypia. The CNR of the lamina propria is slightly increased for hyperplasia, compared to normal mucosa, perhaps suggesting that excess cytoplasm in the colonocytes not only leads to a characteristic “star-shaped” luminal morphology, but also compresses the surrounding lamina propria, thereby leading to increased scatter in the denser tissue. This increased scatter in the lamina propria is further apparent in dysplastic mucosa.Fig. 9Average contrast-to-noise ratios (of the nuclei and lamina propria) for normal, hyperplastic, and dysplastic (adenomatous) mucosa. Error bars indicate the standard deviation. 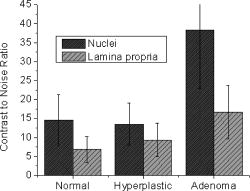 An advantage of this intravital microscope, as well as future in vivo devices, is that tissue samples may be more reliably oriented with respect to the imaging axes than histological samples are on a slide. This allows for accurate quantification of morphological dimensions. Here we measure the eccentricity of the crypts, for horizontally rendered images of normal and dysplastic mucosa. We define the eccentricity as the ratio between the longest dimension of the crypts (measured to the basal end of the colonocytes) and the dimension along the perpendicular bisector of this long axis. The results plotted in Fig. 10 , for 10 representative crypts from normal and dysplastic mucosa, show a large variation and high degree of eccentricity in adenomatous crypts, consistent with the images shown earlier. 4.4.Future In Vivo ImagingThe purpose of this study is to demonstrate, on a tabletop prototype, the diagnostic utility of a dual-axes confocal imaging system with the potential for miniaturization and in vivo use. A 10-mm-diameter hand-held version of this microscope is currently being assembled and tested for dermatological applications. A similar version with a 5-mm diameter is also being designed for in vivo imaging of the colon through a therapeutical colonoscope with a large instrument channel. These miniature designs will incorporate a 2D scanning MEMS mirror actuated with electrostatic comb drives.28 Horizontal (en face) images will be obtained by scanning the illumination and collection beams in tandem. These devices will also possess the ability to image at a variety of depths through either manual or motorized vertical actuation. In addition to their miniature size, one benefit of these MEMS mirrors is their ability to scan at high speeds in both the - and -directions, enabling fast frame rates for en face imaging. For example, the resonant frequency of the fast axis, at around , will easily enable imaging rates of many frames per second. Details of the miniature design, as well as the imaging performance of the device, are beyond the scope of this article but will be presented in a future publication. Light sources in addition to will be employed in future devices, for improved resolution as well as the ability to perform fluorescence imaging with targeted fluorophores.18 5.ConclusionsIn this article, diffraction theory is used to model dual-axes confocal response and resolution, demonstrating good agreement with experimental results. A simple expression for transverse and axial resolution is derived for illumination with truncated Gaussian beams, as is relevant to a fiber-optic-coupled system. Off-axis collection, without a coherence gate, is sufficient to spatially filter out-of-focus light for imaging large vertical sections with high contrast and deep-tissue penetration. The use of a narrowband source simplifies the microscope design, reduces cost, and allows for collection of incoherent light such as fluorescence. The use of optimized low-NA optics (NA 0.21), Gaussian beam truncation (99% truncation), and an index-matching hemispherical sample holder allows for collection of vertical cross-sectional images with axial and lateral resolution over a field of view of (deep) by (wide) at one frame per second. We show that a dual-axes confocal reflectance microscope using a narrowband light source at can distinguish among normal, hyperplastic, and dysplastic (precancerous) colonic mucosa ex vivo. Clear differences in glandular crypt size, eccentricity, and contrast are apparent and quantifiable in the dual-axes reflectance confocal images. These results illustrate the diagnostic potential of a future miniature endoscope-compatible instrument that we are developing for in vivo imaging. A real-time in vivo microscope with optical-sectioning capabilities would provide a powerful tool for improving the speed and accuracy of endoscopic examinations. In addition, such a device could be used for image-guided resection, delineating tumor margins, identifying sub-epithelial lesions, and detecting submucosal invasion. AcknowledgmentsThe authors would like to acknowledge funding support from the National Cancer Institute (NCI), through the 5U54 CA105296 Network for Translational Research in Optical Imaging (NTROI), and an NSF Center for Biophotonics Science and Technology (CBST) developmental award. Jonathan Liu is supported by a Canary Foundation/American Cancer Society post-doctoral fellowship for the early detection of cancer. Thomas Wang is supported by the National Institute of Diabetes and Digestive and Kidney Diseases (NIDDK) on Grant number K08 CA096752. ReferencesJ. Pawley, Handbook of Biological Confocal Microscopy, Plenum, New York (1996). Google Scholar
G. D. Papworth,
P. M. Delaney,
L. J. Bussau,
L. T. Vo, and
R. G. King,
“In vivo fibre optic confocal imaging of microvasculature and nerves in the rat vas deferens and colon,”
J. Anat., 192 489
–495
(1998). 0021-8782 Google Scholar
Y. S. Sabharwal,
A. R. Rouse,
L. Donaldson,
M. F. Hopkins, and
A. F. Gmitro,
“Slit-scanning confocal microendoscope for high-resolution in vivo imaging,”
Appl. Opt., 38 7133
–7144
(1999). 0003-6935 Google Scholar
C. Liang,
K. Sung,
R. R. Richards-Kortum, and
M. R. Descour,
“Design of a high-numerical aperture miniature microscope objective for an endoscopic fiber confocal reflectance microscope,”
Appl. Opt., 41 4603
–4610
(2002). 0003-6935 Google Scholar
D. L. Dickensheets and
G. S. Kino,
“Silicon-micromachined scanning confocal optical microscope,”
J. Microelectromech. Syst., 7 38
–47
(1998). https://doi.org/10.1109/84.661382 1057-7157 Google Scholar
R. Kiesslich,
J. Burg, and
M. Vieth,
“Confocal laser endoscopy for diagnosing intraepithelial neoplasias and colorectal cancer in vivo,”
Gastroenterology, 127 706
–713
(2004). 0016-5085 Google Scholar
E. Laemmel,
M. Genet,
G. Le Goualher,
A. Perchant,
J. F. Le Gargasson, and
E. Vicaut,
“Fibered confocal fluorescence microscopy (Cell-viZio) facilitates extended imaging in the field of microcirculation. A comparison with intravital microscopy,”
J. Vasc. Res., 41 400
–411
(2004). https://doi.org/10.1159/000081209 1018-1172 Google Scholar
E. H. Stelzer,
S. Lindek,
S. Albrecht,
R. Pick,
G. Ritter,
N. Salmon, and
R. Stricker,
“A new tool for the observation of embryos and other large specimens: Confocal theta fluorescence microscopy,”
J. Microsc., 179 1
–10
(1995). 0022-2720 Google Scholar
S. Lindek and
E. H. K. Stelzer,
“Optical transfer functions for confocal theta fluorescence microscopy,”
J. Opt. Soc. Am. A, 13 479
–482
(1996). 0740-3232 Google Scholar
R. H. Webb and
F. Rogomentich,
“Confocal microscope with large field and working distance,”
Appl. Opt., 38 4870
–4875
(1999). 0003-6935 Google Scholar
T. D. Wang,
M. J. Mandella,
C. H. Contag,
N. Y. Chan, and
G. S. Kino,
“Dual axes confocal microscope with post-objective scanning and low coherence heterodyne detection,”
Opt. Lett., 28 1915
–1917
(2003). 0146-9592 Google Scholar
D. Huang,
E. A. Swanson,
C. P. Lin,
J. S. Schuman,
W. G. Stinson,
W. Chang,
M. R. Hee,
T. Flotte,
K. Gregory,
C. A. Puliafito, and
J. G. Fujimoto,
“Optical coherance tomography,”
Science, 254 1178
–1181
(1991). 0036-8075 Google Scholar
B. E. Bouma and
G. J. Tearney, Handbook of Optical Coherence Tomography, Marcel Dekker, New York (2002). Google Scholar
A. M. Rollins,
R. Ung-arunyawee,
A. Chak,
R. C. K. Wong,
K. Kobayashi, M. V. Sivak Jr., J. A. Izatt,
“Real-time in vivo imaging of human gastrointestinal ultrastructure by use of endoscopic optical coherence tomography with a novel efficient interferometer design,”
Opt. Lett., 24 1358
–1360
(1999). 0146-9592 Google Scholar
P. Hsiung,
L. Pantanowitz,
A. D. Aguirre,
Y. Chen,
D. Phatak,
T. H. Ko,
S. Bourquin,
S. J. Schnitt,
S. Raza,
J. L. Connolly,
H. Mahimo, and
J. G. Fujimoto,
“Ultrahigh-resolution and 3-dimensional optical coherence tomography ex vivo imaging of the large and small intenstines,”
Gastrointest. Endosc., 62 561
–574
(2005). 0016-5107 Google Scholar
J. A. Izatt,
M. R. Hee,
G. M. Owen,
E. A. Swanson, and
J. G. Fuijimoto,
“Optical coherence microscopy in scattering media,”
Opt. Lett., 19 590
–592
(1994). 0146-9592 Google Scholar
A. Aguirre,
P. Hsiung,
T. H. Ko,
I. Hartl, and
J. G. Fujimoto,
“High-resolution optical coherence microscopy for high-speed, in vivo cellular imaging,”
Opt. Lett., 28 2064
–2066
(2003). 0146-9592 Google Scholar
T. D. Wang,
C. H. Contag,
M. J. Mandella,
N. Y. Chan, and
G. S. Kino,
“Confocal fluorescence microscope with dual-axis architecture and biaxial postobjective scanning,”
J. Biomed. Opt., 9 735
–742
(2004). https://doi.org/10.1117/1.1760760 1083-3668 Google Scholar
K. Kelly,
H. Alencar,
M. Funovics,
U. Mahmood, and
R. Weissleder,
“Detection of invasive colon cancer using a novel, targeted, library-derived fluorescent peptide,”
Cancer Res., 64 6247
–6251
(2004). https://doi.org/10.1158/0008-5472.CAN-04-0817 0008-5472 Google Scholar
M. Born and
E. Wolf, Principles of Optics, Cambridge Press, Cambridge, U. K. (1999). Google Scholar
A. E. Siegman, Lasers, Mill Valley, CA (1986). Google Scholar
T. D. Wang,
M. J. Mandella,
C. H. Contag, and
G. S. Kino,
“Dual axes confocal microscope for high-resolution in vivo imaging,”
Opt. Lett., 28 414
–416
(2003). 0146-9592 Google Scholar
I. S. Gradshteyn and
I. M. Ryzhik, Table of Integrals, Series, and Products, Academic Press, San Diego (2000). Google Scholar
S. M. Mansfield and
G. S. Kino,
“Solid immersion microscope,”
Appl. Phys. Lett., 57 2615
–2616
(1990). https://doi.org/10.1063/1.103828 0003-6951 Google Scholar
T. Satawari,
“Optical heterodyne scanning microscope,”
Appl. Opt., 12 2768
–2772
(1973). 0003-6935 Google Scholar
M. Kempe,
W. Rudolph, and
E. Welsch,
“Comparative study of confocal and heterodyne microscopy for imaging through scattering media,”
J. Opt. Soc. Am. A, 13 46
–52
(1996). 0740-3232 Google Scholar
R. Drezek,
M. Guillaud,
T. Collier,
I. Boiko,
A. Malpica,
C. Macaulay,
M. Follen, and
R. Richards-Kortum,
“Light scattering from cervical cells throughout neoplastic progression: Influence of nuclear morphology, DNA content, and chromatin texture,”
J. Biomed. Opt., 8 7
–16
(2003). https://doi.org/10.1117/1.1528950 1083-3668 Google Scholar
H. Ra,
Y. Taguchi,
D. Lee,
W. Piyawattanametha, and
O. Solgaard,
“Two-dimensional MEMS scanner for dual-axes confocal in vivo microscopy,”
862
–865
(2006) Google Scholar
|


