|
|
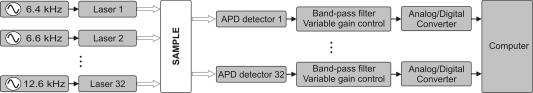
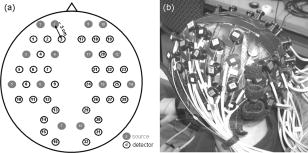
1.IntroductionFunctional optical brain imaging measurements require a fast image acquisition rate and coverage of a large area of the brain. A fast acquisition rate permits simple filtering of faster hemoglobin changes arising from, for example, cardiac pulsation from the relatively slow evoked hemodynamic response to brain activation. A spatial coverage not limited to the activation area but extended to areas not involved with the stimulation allows separation of evoked hemodynamic changes from global systemic oscillations of hemoglobin at similar frequencies, such as Mayer waves and respiration.1 With this purpose in mind, we have developed a fast multichannel optical imaging system with a large number of channels and a parallel acquisition scheme to allow a fast acquisition rate with a sufficiently high signal-to-noise ratio (SNR) to characterize brain activation and the background physiological fluctuations. Various multichannel optical systems for the study of brain activation have been developed in various research laboratories. 2, 3, 4, 5 Among the currently commercially available multichannel optical systems are the Dynot (NIRx Medical technologies, http://www.nirx.net), the ETG Optical Topography System (Hitachi Medical Corporation, http://greenweb.hitachi.co.jp/en/ecoproducts/topogurafi.html), and the Imagent (ISS, Inc., http://www.iss.com/Products/imagent.html). The NIRx system has an excellent dynamic range,6 allowing for tomographic imaging. The new Hitachi system ETG-7000 allows for whole-head coverage with its 40 source and 40 detector channels.7 The ISS system is unique in quantifying the optical properties of biological tissues. Both the Hitachi and ISS systems have a fast acquisition rate ( or more) for the entire complement of sources and detectors,8, 9 while the NIRx system can achieve comparable acquisition rates for a subset of sources and detectors.6 Our system acquires 32 detector channels simultaneously, and the 32 sources are frequency encoded for parallel acquisition. This allows for an acquisition rate of up to 100– for a large number of source and detector pairs. Effectively, because of dynamic range limitations, a good SNR is only for closer source–detector pairs. This limits the ability to obtain higher-resolution tomographic images of small brain areas but does not present a problem if we want to image large brain areas with a lower spatial resolution. The increased number of optodes in the CW5 system can cover a larger area of the human head than was previously possible. We developed a probe that covers most of the adult human head and tested it with the CW5 system on several subjects, acquiring data during visual, cognitive, and motor stimuli. From previous studies of the hemodynamic response, conducted during the past few years, we found that there is significant spatiotemporal covariance in the optical data arising from cardiac pulsation, blood-pressure variations, and respiration.10, 11 This covariance, while mostly uncorrelated with the stimulus and the resulting evoked response, degrades our ability to extract small evoked responses. We therefore also collected data while subjects were at rest, in order to characterize this spatiotemporal covariance to facilitate future design of optimized filters. 2.Methods2.1.CW5 ImagerOur latest continuous-wave system for diffuse optical imaging, CW5, is an extension of the modular design of two previous systems:12 NIRS2 and CW4 (TechEn Inc., Milford, MA). The CW5 has 32 laser diodes and 32 avalanche photodiodes (APD). Laser sources and APD detectors are mounted in the front panel, and fiber optics are coupled to them through SMA connectors. In this system the lasers are all on at the same time and the 32 detectors can potentially acquire in parallel light from the 32 lasers. The 32 lasers are divided into 16 lasers at (HL6738MG, up to ) and 16 at (HL8325G 830, up to ). A master clock generates 32 distinct frequencies between 6.4 and in approximately steps, so that each laser is modulated at a different frequency by current-stabilized square-wave modulation. The APD detectors (Hamamatsu C5460-01) acquire light from the sources in parallel. Following each APD module is a signal conditioning and amplification stage. Each APD preamp output is first highpass-filtered with a cut-on frequency of to remove low-frequency signals from stable interference sources like room light and (flicker) noise generated by the electronics. After the highpass filter comes a programmable gain stage to match the signal levels with the acquisition level on the analog-to-digital converter within the computer. Following the gain control stage is a lowpass filter with cut-off frequency of , for preventing aliasing during digital sampling. Each detector channel is then sampled at using four National Instruments NI6052E data acquisition cards in a personal computer. Figure 1 shows the block diagram of the instrument (for simplicity, only a few sources and detector channels are shown). All of the electronics are contained in a relatively small box, 20” by 20” by 17”, and the system weighs about . An eight-channel auxiliary box with a National Instrument 6023E card, in the same personal computer, acquires 8 additional channels synchronously with the optical data for monitoring of systemic physiology, stimulation trigger, and synchronization with other instruments. A photograph of the CW5 imager is shown in Fig. 2 . 2.2.Dynamic PhantomWe developed an automated calibration procedure on a dynamic phantom to characterize the performance of all sources and detectors simultaneously. The dynamic phantom setup is shown in Fig. 3 and consists of a liquid container, a servo-controlled syringe, and a peristaltic pump. The lasers and detectors of the CW5 system are arranged at the top and bottom of the phantom, respectively, in a transmission geometry. The syringe titrates ink uniformly at a rate into the reservoir filled with Intralipid solution. This corresponds to an absorption increase in the solution of approximately . The peristaltic pump circulates this Intralipid and ink solution from the reservoir to the phantom container. At the beginning of the experiment, the solution contains only Intralipid ( 20% Intralipid in water); at the end the solution is highly absorbing because of the large concentration of ink added. The data are collected at regular intervals (every ) for the duration of the titration . We used this automated calibration procedure on a dynamic phantom to measure noise equivalent power (NEP) and dynamic range of the 32 detectors simultaneously. The relative signal levels of each detector were calibrated against a known source with a known optical power in order to characterize the performance of the system in optical power units. In addition, we measured the drift of the instrument by collecting data for after of warming up the system in a stable liquid phantom in the same geometrical configuration as shown in Fig. 3. We choose to measure the drift over a 5-min period because this is the typical duration of our functional measurements. 2.3.Probe for Human Subject StudiesThe probe geometry was designed to cover most of the adult human head with the 32 detector and 16 source positions available. In particular, we wanted to optimize coverage of the prefrontal, motor, and visual cortices, maximize the number of channels, and avoid the sagittal sinus vein area. We constructed a probe from flexible plastic belts with a minimum source–detector distance of . Taking into account only the short distances, those for which we have the best signal-to-noise ratio, we have 50 independent measurements at each wavelength [see Fig. 4a ]. To reduce the weight and bulkiness of the probe, we use source and detector fibers with a light jacket and with tips bent at 90°. The fibers are attached to the probe through custom-made plastic plugs, and spring-loaded so as to obtain a good optical coupling with the skin and to minimize discomfort to the subjects. The source fibers are two (one for each wavelength) multimode silica fibers with core diameters of . The detectors are made with a bundle of glass fibers for a total diameter of . All of the fibers at the instrument end are terminated with SMA connectors. The final probe design enabled a stable, lightweight, and comfortable fit on the subject’s head [see Fig. 4b]. This allowed for minimization of motion artifacts during the experiment and easy and quick adjustment to the subject’s head. 2.4.ProtocolsThe probe was secured to the subject’s head with Velcro and foam material. The subject then lay supine in a recliner chair and was instructed to minimize his or her movements during the measurements. We acquired baseline data from 11 subjects, with the subjects resting in a quiet dark room. We repeated the 300-sec baseline runs 2 to 3 times in each subject. In these subjects, in addition to the baseline protocol, we performed functional runs (finger-tapping, cognitive, and visual) to activate different cortical areas. For the finger-tapping protocol, we instructed subjects to touch their thumb with the index and middle fingers of their right hand in a self-paced fashion. For the cognitive protocol, the subject had to mentally (without talking) count backward, starting with a given 3-digit number and continually subtracting a given 1-digit number. For the visual protocol, the subject wore special glasses with red LEDs (Grass LED visual stimulator Astro-Med, Inc., Model S10VS) flickering on and off at a frequency of . In all protocols, auditory cues sent by a computer told the subject when to begin and end each period. All 11 subjects performed the finger-tapping protocol; 10 subjects performed the cognitive protocol; 8 subjects performed the visual protocol. Each functional run consisted of of stimulation interleaved with of rest, for a total of and 10 stimulation periods. Some subjects performed more than 1 run per protocol: specifically, two subjects repeated finger-tapping run 2 times, 7 subjects repeated the cognitive run 2 times, and 5 subjects repeated the visual run 2 times. In separate sessions with two subjects, we collected data during paced breathing. For the paced-breathing experiment, the subjects were instructed to inhale and exhale in time with a metronome. We performed six 300-sec runs with different breathing rates (free breathing, , , , , and ). During all of the measurements, a pulse oximeter (Nonin 8600) continuously recorded the arterial saturation and the heart rate at the subject’s left hand. A strain gauge belt (Sleepmate/Newlife Technologies, Resp-EZ) placed around the subject’s upper abdomen monitored his or her respiratory movements. A custom-made blood-pressure sensor consisting of a water-filled finger cuff and pressure transducer continuously recorded blood-pressure changes from a finger on the subject’s left hand. We recorded the analog outputs of these instruments for continuous co-registration of physiological and optical data. The auditory cues (when present) were also acquired with the optical data through a signal sent to the auxiliary board. The auxiliary card acquired at a rate of , synchronously with the data acquisition cards for the optical data. 2.5.SubjectsFor these measurements we enrolled 12 healthy subjects, including 11 males and 1 female. The subjects’ mean age was 35 years old, with a standard deviation of 12 years. The study was approved by the Massachusetts General Hospital Institutional Review Board. All of the subjects gave written informed consent. 2.6.Data AnalysisWith the CW5 system, each detector’s output is digitized at . The individual source signals are separated offline after data acquisition, by software demodulation followed by an infinite-impulse-response filter with a band-pass frequency. The raw optical data are then processed using HomER, a graphical interface program implemented in MatLab (Mathworks Inc., Sherborn, MA) and developed by our group for visualization and analysis of optical data (http://www.nmr.mgh.harvard.edu/PMI). This program allows us to analyze the functional data in a convenient and easy way. It also allows us to visualize and remove noisy channels and time points with motion artifacts and band-pass-filter the raw data to reduce instrumental and physiological noise. For the functional data presented here, we used a band-pass filter between 0.0016 and to eliminate slow drifts and cardiac pulsation. To eliminate oscillations, we performed a principal component analysis (PCA), removing the first one or two eigenvectors, which account for 80% of the variance in the optical data. These principal components were derived from the baseline data set.1 At this point the data are block-averaged, or deconvolved with the stimulus, to obtain an average response to stimulation. HomER also has image reconstruction capabilities using backprojection and tomographic algorithms. Normalized backprojection was used to produce the images in this paper as described in Boas 13 The baseline and paced-breathing optical data were analyzed with custom scripts in MatLab, rather than with HomER. The raw optical data were normalized and band-pass-filtered around the center frequencies of the cardiac pulsation, respiration, heart-rate, and blood-pressure oscillations. We calculated the cross-correlation functions between the band-pass-filtered optical data and the corresponding recorded physiology. We then constructed maps and movies of the cross-correlation signals to determine the spatiotemporal correlation between cerebral optical data and systemic physiology. 3.Results3.1.Phantom MeasurementsThe dynamic phantom setup we developed was designed for automated system characterization. Given the 32 sources by 32 detectors, manual characterization of the individual channels can become time-consuming. Our dynamic phantom automates characterization of all source and detector channels simultaneously. The measurements on the dynamic phantom allowed us to characterize noise equivalent power (NEP) and dynamic range of the detector channels in the CW5 system. NEP corresponds to the amount of light at the detector that has a signal-to-noise ratio of unity. We calculated an NEP of per root Hz, which is comparable to the NEP of the APDs. This means that the circuitry following the APDs preserves the signal-to-noise ratio. The dynamic range of the instrument is defined by the ratio between the minimum light that saturates the detector and NEP. For the different detectors in the CW5 system, the dynamic range varied between 60 to with less than 2% deviation from a linear least-squares fit. Table 1 gives the performance characteristics of the CW5 system. Table 1Performance Characteristics of CW5.
The results of the ink titration for four inline source–detectors pairs are shown in Fig. 5a . The detected light decreases exponentially with the increase in the absorbance of the solution. NEP and dynamic range are calculated by these curves for all the other source–detector combinations. The increase in noise with increasing signal for the same detectors is plotted in Fig. 5b at a bandwidth. Fig. 5(a) Measurement of the dynamic range of the system. As a representative example, we show here the power recorded by 4 adjacent detectors (each color is a different source–detector pair) as the absorption of the medium was increased. (b) Measurement of system noise (NEP) for the four detectors versus detected light level (color online only).  The system was found to have a signal drift less than 0.5% over . 3.2.Human Subjects—Baseline MeasurementsOptical data obtained from the head during rest typically contain a wide variety of oscillations due to systemic and local hemodynamic changes. The major contributions to the optical signal are from cardiac pulsation, respiration, heart-rate, and blood-pressure changes. The average cardiac pulsation frequency of our subjects was . In the same subjects, we measured average heart-rate oscillations of , and slightly lower blood-pressure oscillations of . The average respiration frequency was . Four subjects breathed at a frequency lower than and for them we observed frequency- and phase-locking of blood-pressure and heart-rate oscillations with respiration. The remaining seven subjects had an average respiration frequency higher than , and the heart-rate and blood-pressure oscillations were clearly separated and at a much lower frequency than the respiration oscillations. We cross-correlated the optical data with the systemic signals during our 5-min baseline runs in the 11 subjects. The mean cross-correlation values of the optical signal over 50 positions on the head, with cardiac pulsation, respiration, blood pressure, and heart rate averaged over the 11 subjects and 2 baseline runs, are reported in Table 2 . The highest cross-correlation value is between optical data and cardiac pulsation; the lowest between optical data and blood pressure. The cross-correlation values are slightly higher at than at , which agrees with the fact that these oscillations are mostly in the arterial compartment and that oxygenated blood has a higher absorption at than at . The mean cross-correlations values over all the channels are considerably smaller than the maximum values because of the large spatial differences of the amplitudes of these optical signals. Table 2Temporal Cross-Correlation Coefficients at Zero Time Delay Averaged over the 11 Subjects during Baseline (the errors are the standard deviations.)
In the slow-breathing subjects, interference between respiration and heart-rate/blood-pressure oscillations was also observed in the optical data. Figure 6 shows the cross-correlation between optical signal and auxiliaries in representative cases of fast- and slow-breathing subjects. The fast-breathing subject [Fig. 6a] breathed at a rate of breaths/min ( , one breath every ); the cross-correlation between optical data and respiration is strong in most of the channels. Blood-pressure oscillations in this subject have a period of about , and heart-rate oscillations have a period of . The cross-correlation between optical data and blood-pressure/heart-rate oscillations shows the same periodicity and has a lower amplitude than the cross-correlation with respiration. It is interesting to note that different channels show a different phase lag between optical data and blood pressure/heart rate. The slow-breathing subject Fig. 6b breathed at a rate of 8 breaths/min ( , one breath every ), and there is a locking of blood pressure/heart rate with respiration. In this case, the optical signal in the head also shows this locking, and the cross-correlation of the optical data with respiration, blood-pressure, or heart-rate oscillations is temporally identical. Fig. 6Time traces of the temporal cross-correlation of all the optical data channels with the auxiliaries in two subjects: (a) and (c) subject breathing fast, (b) and (d) subject breathing slow. (a) and (b) show the cross-correlation for temporal lags spanning . (c) and (d) magnify the same data, showing a narrower temporal range.  Slow breathing tends to exaggerate the parasympathetic feedback to the heart’s pacemaker cells and to the arterial baroreflex. This tendency of the autonomic nervous system to increase parasympathetic feedback during slow respiration could originate in the ventrolateral aspect of the medulla oblongata (VLM), where the integration of afferent inputs to the respiratory and cardiovascular controllers may create the frequency locking with blood-pressure and heart-rate variations.14 This frequency locking is an artifact of the blood-pressure regulatory system. Its presence means that the subject is probably relaxed and has a well-functioning autonomic nervous system. The lower natural respiration rate of some subjects reflects normal intersubject variation in the respiratory set point. The different temporal delays between optical data and blood pressure/heart rate in different channels, seen in Fig. 6c and 6d, are consistent among subjects and have a well-defined spatial pattern. The large variance in the phase of cerebral blood-flow velocity relative to arterial blood pressure has been observed with transcranial Doppler ultrasonography comparing the middle and posterior cerebral arteries.15 These phase variations may be attributable to regional differences in cerebral autoregulation as observed in positron emission tomography studies of cerebral blood flow.16 The spatial maps of cross-correlation between optical signal and blood pressure/heart rate reveal a delay between the anterior, posterior, and middle areas of the head. Figure 7 shows the spatial maps of cross-correlation between optical data at and blood pressure in the same two subjects as shown in Fig. 6. In this figure, we show 16 to 18 frames during one period of the blood-pressure oscillation, one image every second for the fast breather, and one image every half-second for the slow breather, since the blood-pressure periods of the two subjects are about 15 and , respectively. In the images, the top corresponds to the frontal area, the bottom to the back of the head, and the left and right to the left and right head hemispheres, respectively. The “blood-pressure wave” starts anteriorly and propagates to the back and then to the middle of the head periodically. We observed this propagation pattern for blood-pressure and heart-rate oscillations in all of the subjects. For the cardiac pulsation, we didn’t observe any spatiotemporal delay between different positions in the head. In other words, at the cardiac pulsation frequency, every position on the head oscillates at the same time. For the respiration oscillations, apart from the four slow-breathing subjects, in whom respiration propagation through the head followed the blood-pressure and heart-rate patterns, the spatial-temporal nonuniformity was smaller or not visible. When visible (3 of 7 subjects), the pattern was the same as for blood pressure. Fig. 7Maps of the cross-correlation of the optical data with the blood pressure in the same two subjects as in Fig. 6. (a) This subject had a slow respiration period of . One image every is displayed with the color scale ranged linearly from to 0.18 (blue to red, with ). (b) This subject had a faster respiration period of . One image every is displayed with the color scale ranged linearly from to 0.26 (blue to red, with ). Orientation of the images with respect to the probe is shown at the bottom. 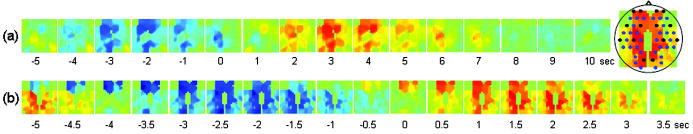 The spatiotemporal structure of this apparent blood-pressure wave must arise from the anatomical structure and dynamic properties of the scalp and cerebral vasculature, but we are not in a position to explain this observation in more than general terms. The primary reason is that these images are simply the measurements projected onto the head surface. There is no differentiation in these data between variations that come from the scalp and the brain. It is also not possible to differentiate the effects of these two anatomical regions without denser spatial coverage or significant prior knowledge of the anatomy and physiology. The structure of blood vessels is spatially inhomogeneous, and this will need to be considered. Cerebral autoregulation may also play a significant role because it introduces frequency-dependent phase shifts in the respiratory-related blood-pressure variations. Spatial variation in the skin and skull thickness together with cerebral autoregulation effects could explain the observed blood-pressure waves. 3.3.Human Subjects—Paced BreathingTo test the hypothesis that the locking of blood-pressure/heart-rate oscillations with respiration is frequency-dependent and not subject-dependent, we asked two subjects in a different protocol to breathe at various controlled rates. Figure 8 shows the cross-correlation maps between optical data and physiology during paced breathing in one subject. From left to right, the cross-correlation maps of the optical signal with cardiac pulsation, respiration, blood pressure, and heart rate are shown. From top to bottom, 5 breathing rates are shown, from fast (one breath every ) to slow breathing (one breath every ). The -axis reports the time lag between the physiological signal and the optical data (up to ); the -axis reports the 50 source–detector pairs at , the first 25 on the left hemisphere, the second 25 on the right hemisphere, both from front to back, following the detector order shown in Fig. 2. The color bars at the bottom show the amplitude of the cross-correlation. Green represents either zero correlation or discarded channels because of low SNR. From these maps, locking of the blood pressure and heart rate with the respiration for frequencies lower than is evident. These measurements also show the spatiotemporal nonuniformity of the cross-correlation between the optical signal and blood pressure/heart rate, as seen during free breathing. Fig. 8Cross-correlation maps between optical data and cardiac pulsation, respiration, blood pressure, and heart rate during paced breathing in one subject controlling the respiration frequency. In each figure the left represents the left hemisphere, and the right represents the right hemisphere, the -axis reports all the 50 source–detector combinations from anterior to posterior first left then right hemisphere. The color scales are the same for each column and are shown at the bottom of each column. The correlation time ( -axis) is between and for all the figures.  3.4.Human Subjects—Functional MeasurementsOnly 3 of the 8 subjects measured showed statistically significant ( ) activation during visual stimulation, 6/10 during cognitive stimulation, and 8/11 during finger-tapping. The low success rate of our measurements with visual stimulation was in some cases due to the low SNR for source–detectors in the occipital area. In fact, in 3 subjects with dark or long hair, we were not able to achieve a good coupling of the optical probe with the skin. Also, in 3 subjects we had to discard several stimulation blocks because of motion artifacts. In these cases, the number of blocks remaining was not adequate to obtain statistical significance. We had a relatively good response rate for cognitive stimuli and an even better one for the finger-tapping stimulation protocol. The probe was easier to position over these cortical areas, providing a better SNR, and these stimuli activate more superficial cortical areas than do the visual stimuli used. Figure 9 reports the evoked hemoglobin results for a subject in whom all three of the stimuli showed activation. Oxy-, deoxy-, and total hemoglobin time traces (red, blue, and green, respectively) over a stimulus/rest period are reported for all of the source–detector locations for the three paradigms. The left columns show the block-averaged data where only a band-pass filter between 0.0016 and was applied. The right column shows the results with principal components analysis (PCA), where the first spatial eigenvector is eliminated from the optical data. For the finger-tapping stimulation without PCA, the activation seems to be everywhere [Fig. 9a] due to the fact that with this stimulus, heart rate and blood pressure increase during the stimulation period, causing a global increase of blood flow. This can be seen in Fig. 10 , which reports the cross-correlation of the blood pressure with the stimulus for the three paradigms and shows a good correlation between blood-pressure and stimulation periods. After applying the PCA filter to the optical data, the activation is localized mostly in the contralateral parietal region [Fig. 9b]. In the same subject, the cognitive stimuli caused a similar increase in blood pressure [Fig. 10b], which again masks the evoked hemodynamic response [Fig. 9c]. After the PCA filter, the activation is localized in the left and right prefrontal regions [Fig. 9d]. The visual stimuli used do not cause large systemic physiologic response [Fig. 10c]. In this case, it is not necessary to use PCA on the optical data because the activation area is restricted to the occipital brain regions [Fig. 9e]. Using the PCA filter would only cause a decrease in the amplitude of the evoked hemoglobin response [Fig. 9f]. Fig. 9Activation maps in a subject's during the three paradigms. Finger-tapping, cognitive, and visual stimulation are shown top to bottom. The curves represent the block average over a stimulus/rest period of (red), (blue), and (green). The -axis is the same in each row. The time traces highlighted in yellow are statistically significant ( ). Left column; hemodynamic results after band-pass filter and block average of the raw optical data. Right column; hemodynamic results after PCA filtering. The four source–detector positions in the right visual cortex and a position on the right parietal cortex have been removed because of low SNR.  Fig. 10Cross-correlation amplitude of blood pressure and stimulation sequence for the subject shown in Fig. 9 during the finger-tapping (a), cognitive (b), and visual (c) paradigms. The blood-pressure signal was synchronously measured on a finger of his left hand. 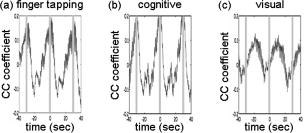 The PCA filter helped to better localize the activation in most of our data. It appears to work well for reducing motion artifacts and for subtracting systemic physiology from the evoked hemoglobin signals, as others previously discussed.1, 17 The PCA analysis is effective in these data sets because of the large brain area measured. If we did not have the global picture of the hemodynamics over this large brain area, the results in the hand motor cortex alone, for example, would have been difficult to interpret. Problems with the PCA include its tendencies to decrease the amplitude of the hemodynamic response in the activated regions and to propagate noise from noisy channels to all other channels. In addition, the principal components do not necessarily have physiological significance. The result is that their use tends to be ad hoc, working well in some subjects in which the systemic physiological spatiotemporal covariance is well separated from the evoked hemodynamic response, and not so well in others in which the systemic variance is not significantly orthogonal to the evoked hemodynamic response. Finally, preliminary analyses indicate that the physiological spatiotemporal covariance is not necessarily space-time separable. As space-time separability is assumed in the PCA, the enthusiasm for its general implementation is further reduced. Thus, better filters of the systemic physiological fluctuation are desired. Regression with the independent measures of the systemic physiological signals, perhaps combined with Kalman filtering and dynamic state-space modeling, is likely to provide improved filtering.18, 19 4.ConclusionsIn this work we have presented a new multichannel optical system with enough sources and detectors to cover the whole head of adult human subjects. We have characterized the instrument’s performance in phantoms and tested it in vivo in 12 subjects both at rest and during functional studies. This system offers the advantage of imaging multiple locations (50 each at two wavelengths with the probe geometry used here) simultaneously with a good temporal resolution (up to ) and low instrumental noise. This work represents the first use of NIRS for studying whole brain-surface fluctuations at rest and during stimulation. In the baseline study, we found that the optical signals were correlated with independent measurements of the cardiac cycle, respiration, heart rate, and blood pressure. This temporal correlation was coherent over space, but importantly, the correlation was space-time separable only for the cardiac cycle. While our use of a principal component analysis to filter these systemic signals appeared to work reasonably well, the nonspace-time separability of these systemic signals explains why the PCA analysis has not been robust and why more sophisticated dynamic filters need to be designed. In the functional study, we demonstrated the ability to measure activation in different brain areas following different stimuli. Imaging the whole cortical surface will allow studies of the functional relationships of different brain regions. In addition, data spanning the entire cortical surface will improve our ability to distinguish neuronally evoked hemodynamic responses from systemic physiological signals. The probe we designed is comfortable and easy to wear. Still, dark long hair in some subjects reduces SNR in all locations. Hair needs to be displaced from under the sources and detectors, and when positioning the probe on the head, we do our best to optimize the coupling of all fiber tips. To make the process more efficient, we are working on software feedback to tell us automatically which fibers need better adjustment. We believe this will improve data quality in all subjects without penalizing the time needed to position the probe on the subject’s head. While this system offers a fast acquisition time per image (as short as 5 to ), all the sources being on at the same time reduces its dynamic range. The sparse source–detector geometry, the fact that we use only a fixed source–detector distance, and the fact that we do not have overlapping measurements prevent us from using tomographic reconstruction algorithms to reconstruct images of hemoglobin changes. For these reasons, we use a simple backprojection method to reconstruct images of such changes during brain activity. We are currently advancing this system to enable time-division multiplexing of subsets of sources and detector gains to increase the effective dynamic range of the system and allow overlapping measurements for tomography.20 Also, digital signal processors are being added to the system to filter the signals in real time for online display of the brain activation signals. AcknowledgmentsWe would like to thank Jon Stott, Christiana Andre, and Shalini Nadgir for technical assistance and George Themelis for his help with the figures. We are grateful to the volunteers who participated in this study. This research is supported by the U.S. National Institutes of Health (NIH) Grants P41-RR14075, R01-EB001954, T32-CA09502, R01-EB002482, and by the MIND Institute. ReferencesY. Zhang,
D. H. Brooks,
M. A. Franceschini, and
D. A. Boas,
“Eigenvector-based spatial filtering for reduction of physiological interference in diffuse optical imaging,”
J. Biomed. Opt., 10
(1), 11014
(2005). 1083-3668 Google Scholar
R. M. Danen,
Y. Wang,
X. D. Li,
W. S. Thayer, and
A. G. Yodh,
“Regional imager for low-resolution functional imaging of the brain with diffusing near-infrared light,”
Photochem. Photobiol., 67
(1), 33
–40
(1998). https://doi.org/10.1562/0031-8655(1998)067<0033:RIFLRF>2.3.CO;2 0031-8655 Google Scholar
N. L. Everdell,
A. P. Gibson,
I. D. C. Tullis,
T. Vaithianathan,
J. C. Hebden, and
D. T. Delpy,
“A frequency multiplexed near-infrared topography system for imaging functional activation in the brain,”
Rev. Sci. Instrum., 76
(9), 093705
(2005). https://doi.org/10.1063/1.2038567 0034-6748 Google Scholar
D. Haensse,
P. Szabo,
D. Brown,
J. Fauchère,
P. Niederer,
H. Bucher, and
M. Wolf,
“A new multichannel near infrared spectrophotometry system for functional studies of the brain in adults and neonates,”
Opt. Express, 13 4525
–4538
(2005). https://doi.org/10.1364/OPEX.13.004525 1094-4087 Google Scholar
I. Nissilä,
T. Noponen,
K. Kotilahti,
T. Katila,
L. Lipiäinen,
T. Tarvainen,
M. Schweiger, and
S. Arridge,
“Instrumentation and calibration methods for the multichannel measurement of phase and amplitude in optical tomography,”
Rev. Sci. Instrum., 76 044302
(2005). https://doi.org/10.1063/1.1884193 0034-6748 Google Scholar
C. H. Schmitz,
D. P. Klemer,
R. Hardin,
M. S. Katz,
Y. Pei,
H. L. Graber,
M. B. Levin,
R. D. Levina,
N. A. Franco,
W. B. Solomon, and
R. L. Barbour,
“Design and implementation of dynamic near-infrared optical tomographic imaging instrumentation for simultaneous dual-breast measurements,”
Appl. Opt., 44
(11), 2140
–2153
(2005). https://doi.org/10.1364/AO.44.002140 0003-6935 Google Scholar
H. Koizumi,
T. Yamamoto,
A. Maki,
Y. Yamashita,
H. Sato,
H. Kawaguchi, and
N. Ichikawa,
“Optical topography: Practical problems and new applications,”
Appl. Opt., 42 3054
–3062
(2003). 0003-6935 Google Scholar
T. Kawaguchi,
“Functional brain imaging of optical topography,”
Acta Neurochir. Suppl. (Wien), 86 63
–64
(2003). 0065-1419 Google Scholar
G. Gratton and
M. Fabiani,
“The event-related optical signal (eros) in visual cortex: Replicability, consistency, localization, and resolution,”
Psychophysiology, 40
(4), 561
–571
(2003). https://doi.org/10.1111/1469-8986.00058 0048-5772 Google Scholar
V. Toronov,
M. A. Franceschini,
M. Filiaci,
S. Fantini,
M. Wolf,
A. Michalos, and
E. Gratton,
“Near-infrared study of fluctuations in cerebral hemodynamics during rest and motor stimulation: Temporal analysis and spatial mapping,”
Med. Phys., 27
(4), 801
–815
(2000). https://doi.org/10.1118/1.598943 0094-2405 Google Scholar
H. Obrig,
M. Neufang,
R. Wenzel,
M. Kohl,
J. Steinbrink,
K. Einhaupl, and
A. Villringer,
“Spontaneous low frequency oscillations of cerebral hemodynamics and metabolism in human adults,”
Neuroimage, 12
(6), 623
–639.
(2000). 1053-8119 Google Scholar
A. M. Siegel,
J. J. A. Marota, and
D. A. Boas,
“Design and evaluation of a continuous-wave diffuse optical tomography system,”
Opt. Express, 4 287
–298
(1999). 1094-4087 Google Scholar
D. A. Boas,
K. Chen,
D. Grebert, and
M. A. Franceschini,
“Improving the diffuse optical imaging spatial resolution of the cerebral hemodynamic response to brain activation in humans,”
Opt. Lett., 29
(13), 1506
–1508
(2004). https://doi.org/10.1364/OL.29.001506 0146-9592 Google Scholar
D. E. Millhorn and
F. L. Eldridge,
“Role of ventrolateral medulla in regulation of respiratory and cardiovascular systems,”
J. Appl. Physiol., 61
(4), 1249
–1263
(1986). 8750-7587 Google Scholar
C. Haubrich,
A. Wendt,
R. R. Diehl, and
C. Klotzsch,
“Dynamic autoregulation testing in the posterior cerebral artery,”
Stroke, 35
(4), 848
–852
(2004). 0039-2499 Google Scholar
H. Ito,
I. Kanno, and
H. Fukuda,
“Human cerebral circulation: Positron emission tomography studies,”
Ann. Nucl. Med., 19
(2), 65
–74
(2005). 0914-7187 Google Scholar
C. G. Thomas,
R. A. Harshman, and
R. S. Menon,
“Noise reduction in bold-based fmri using component analysis,”
Neuroimage, 17
(3), 1521
–1537
(2002). 1053-8119 Google Scholar
S. Prince,
V. Kolehmainen,
J. P. Kaipio,
M. A. Franceschini,
D. A. Boas, and
S. R. Arridge,
“Time-series estimation of biological factors in optical diffusion tomography,”
Phys. Med. Biol., 48 1491
–1504
(2003). https://doi.org/10.1088/0031-9155/48/11/301 0031-9155 Google Scholar
S. G. Diamond,
T. J. Huppert,
V. Kolehmainen,
M. A. Franceschini,
J. P. Kaipio,
S. R. Arridge, and
D. A. Boas,
“Dynamic physiological modeling for functional diffuse optical tomography,”
Neuroimage, 30
(1), 88
–101
(2005). 1053-8119 Google Scholar
D. K. Joseph,
T. J. Huppert,
M. A. Franceschini, and
D. A. Boas,
“Diffuse optical tomography system to image brain activation with improved spatial resolution and validation with functional magnetic resonance imaging,”
Appl. Opt.,
(0003-6935) Google Scholar
|