
|
|
1.IntroductionImage-guided intervention (IGI) can be classified into three categories: image-guided diagnostics (IGD),1, 2 image-guided surgery (IGS),3, 4, 5 and image-guided therapy (IGT). 1, 4, 6 The employment of a particular IGI method depends largely on its accuracy and its efficacy in a given tissue environment. Medical imaging techniques such as computed tomography (CT), positron emission tomography (PET), ultrasound, and magnetic resonance imaging (MRI) render large volume scans and can be very useful in certain surgical 5, 7, 8, 9 and therapeutic procedures.4, 6, 10, 11 As an example, ultrasound image-guided percutaneous large core needle biopsy (CNB) for detecting nonpalpable abnormalities has been gaining popularity due to the precision ultrasound imaging introduces to the procedure.12 However, the method is still far from ideal as it is relatively low in spatial resolution (which ranges from ).13 Overall, the method does point to the utility of minimally invasive endoscopic imaging techniques for improving the accuracy and outcome of clinical procedures. There are two non-optical endoscopic methods that are worth highlighting: endoscopic MRI and endoscopic ultrasonography (EUS). Endoscopic MRI probes vary in size according to their specific application. For example, MR coils used to visualize the gastrointestinal (GI) tract are approximately in diameter,14 while intravascular coils can be as small as .15 The in-plane resolution for both probes is on the order of ; however, the depth resolution is in millimeters, e.g., .15 Moreover, the technique still requires placing the subject inside a large magnet. The cost and inconvenience of the procedure are significant. In the last decade, EUS has become popular among physicians as it allows for real-time imaging of intraabdominal organs. Two-dimensional (2D) image slices acquired from EUS probes can be manipulated to render three dimensional (3D) viewing of internal structures as well. Owing to the relatively low (e.g., axial and transverse) spatial resolution and low sensitivity of the EUS probes,16, 17 their efficacy for image-guided intervention, such as for the staging of tumors, is limited.18 Furthermore, a reduction in ultrasonic probe size will render even poorer resolution unless the operating frequency of the ultrasonic probe is also increased at the same time. An additional challenge for EUS is the need for acoustic coupling. Clinicians typically submerge the lesion of interest in water, which may require the patient to be shifted for water to pool in the appropriate location.19 Alternatively, some probe designs include water-filled balloons surrounding the transducer tip, but this necessarily increases the diameter of the probe. In comparison, optical imaging techniques that include conventional endoscopy,20, 21 and fluorescence,22 confocal,23 and multiphoton microscopy24, 25 as well as optical coherence tomography (OCT)26 can offer higher sensitivity as well as higher spatial resolution. In addition to tissue reflectance, optical methods also enable access to spectroscopic data representative of tissue physiological function. The use of inexpensive and nonradioactive optical contrast agents27, 28 can also offer safe, highly sensitive, and targeted imaging of regions of interest. Other advantages of optical imaging techniques include portability to low instrumentation cost and operational cost. In particular, OCT,26 which is based on low coherence interferometry, can offer high axial resolution, typically using superluminescent diodes.29 The depth penetration of OCT depends on factors such as sensitivity of the system as well as light scattering and absorption in the tissue.30 Typical depth penetration of OCT ranges from in skin and other highly scattering tissues.31 Recent advancements in OCT imaging strategies have conferred an additional sensitivity advantage32, 33, 34 over the earlier OCT versions, which can either translate to (1) a greater depth scan range with a high image acquisition speed or (2) a decrease in the light fluence level. 35, 36 OCT also takes advantage of state-of-the-art laser and fiber-optic technology developed for optical communications. In this context, the use of a single-mode fiber for light delivery as well as OCT signal acquisition has facilitated the development of very small diameter and potentially flexible endoscopic OCT probes for narrow intraluminal or intracavity imaging.37, 38 In this review, we will survey the state of the art in endoscopic OCT. This review comprises six sections. In the next section, we provide a brief survey of optical endoscopic methods. That is followed by a review of OCT methodology. We then present a detailed discussion of endoscopic OCT techniques reported so far, which can be classified into two main categories: side- or circumferential-imaging and forward-imaging OCT probes. Before concluding this review, we report on the present application areas of endoscopic OCT and explore potential diagnostic applications that can benefit significantly from endoscopic OCT. 2.Survey of Conventional Optical Endoscopic MethodsLight-based endoscopy took its first step forward in the 1960s when fiber-optic endoscopes20 were first introduced. A typical fiber endoscope uses a fiber-optic cable (also known as an image guide) composed of a bundle of glass or plastic fibers to transfer the image from the distal end to the proximal end of the endoscope. Such an endoscope has the advantage of being flexible and can be in diameter .39 However, fiber endoscopes of this sort are usually limited in transverse resolution as they typically render resolvable points, defined by the number of individual fibers in the image guide.40 This is equivalent to a 2D image with points. In a typical fiber endoscope, the front-end imaging lens, usually a gradient index (GRIN) lens, is glued to the image guide. Magnifying fiber endoscopes can be realized by adjusting the distance between the GRIN lens and the fiber guide. One such proof-of-concept magnifying fiber endoscope reports a factor of 2 improvement in the lateral resolution compared with conventional fiber endoscopes.41 It should be noted that a miniaturized microprecision -axis controller will be required to adjust the magnification or the field of view will be compromised. In contrast, a different type of imaging devices, collectively known as videoscopes employ charge-coupled devices (CCDs) at the distal end of endoscopes. These are commonly used for image guidance during diagnostic and surgical procedures, 21, 42, 43 and can be designed to obtain either forward or side images. The resolution of a videoscope largely depends on the number of pixels in the CCD used. Some videoscopes are also equipped with a zoom lens at the tip of the scope, which can yield higher resolution magnified images of the target tissue; however, this necessarily increases the size of the videoscope as well. The front end of a videoscope is typically on the order of in diameter (defined by the CCD size), while the rigid distal portion can be as long as . Due to their bulky nature, they are difficult to maneuver inside narrower body passageways, limiting their imaging capabilities. Both fiber endoscopes and videoscopes fall into the category of white-light endoscopy. They both require additional waveguides or fibers to shine visible light on the tissue under examination. Both allow clinicians to visually screen patient lumens, without any sort of depth perception; therefore, subtle subsurface lesions can potentially be missed. There are several methods for improving the imaging capabilities of white-light endoscopy. The simplest of these is chromoendoscopy,44 which takes advantage of absorptive dyes or other contrast agents to enhance visualization with white-light endoscopy. These dyes are simply sprayed or washed over the tissue of interest, and a fiber endoscope or videoscope is used to visualize the stained tissue. Additional optical methods for enhancing light-based endoscopy include fluorescence imaging,22 Raman spectroscopy,45 and confocal imaging.23 Fluorescence-based diagnostic techniques are based on the interaction of light, at specific wavelength, with fluorophores in the target tissue. Various exogenous fluorophores such as hematoporphyrin (HpD), mono-aspartyl chlorin (MACE), di-aspartyl chlorin (DACE), and 5-aminolevulinic acid (5-ALA) are available for use in fluorescence-based imaging.22 In contrast, autofluorescence-based imaging takes advantage of the natural fluorescent properties of endogenous tissue fluorophores such as collagen, elastin, nicotinamide, flavin, and porphyrins.46, 47 This technique is a useful diagnostic tool as it is sensitive to the biochemical changes that accompany malignant transformation and is thus capable of detecting early stage cancers.46 However, one significant disadvantage of autofluorescence imaging is that the optimal excitation and emission wavelengths are dependent on tissue composition and must be determined for various tissue types by examining ex vivo samples.47 Raman spectroscopy relies on the change in photon energy, and corresponding frequency shift, associated with the inelastic scattering of light from the target of interest. Providing molecule-specific spectral features, this method has the potential to quantify molecular changes in the target tissue, allowing for the detection of cancerous or precancerous lesions at much earlier stages.48, 49 The challenge associated with this technique is that the Raman signal of tissue is very weak, and the signal is often masked by tissue fluorescence.50 Thus far, Raman spectroscopy has been used to characterize single points, sampling approximately in depth.50 One such fiber-optic probe employed eight fibers, one for the delivery of light and seven for collection of the Raman signal, creating a probe tip approximately in diameter.50 Additionally, endoscopic implementations of Raman spectroscopy require probe design considerations to minimize fluorescence and Raman signals that are generated in the probe itself.50 One major disadvantage of the light-based endoscopes discussed so far is that they do not offer any sort of depth perception. In this context, two approaches, namely confocal microscopy23 and multiphoton fluorescence microscopy,24 have been employed to improve the resolution and sensitivity of conventional fiber endoscopes. Confocal microendoscopes, which use a pinhole to reject out-of-focus light in order to distinguish between structures at different depths, can be further categorized into pure reflectance-51 and fluorescence-based52 endoscopes. Traditionally, confocal endoscopes employ light scanning hardware at the proximal end of a fiber bundle.53 Depending upon whether a GRIN lens or a multielement objective lens is used at the distal end, endoscopes with outer diameters ranging from have been reported.51, 53 Typical values of transverse and axial resolution for such confocal endoscopes are 3 and , respectively, with a depth scanning range up to . Improved transverse resolution can be achieved by employing a single fiber with a confocal scanner at the distal end of the endoscope. One such reported system is capable of acquiring stacks of 2D images with a lateral resolution of and an optical slice thickness of .52 However, owing to the difficulty in miniaturizing the raster scanning mechanism, the endoscope has a diameter, with a rigid length.52 In comparison, multiphoton fluorescence microscopy provides optical sectioning through the sharply decreased excitation rate per fluorophore with axial distance from the focal plane. However, we note that the group velocity dispersion (GVD) and self-phase modulation (SPM) in standard fibers pose significant challenges to the development of fiber-based multiphoton endoscopes.54, 55, 56 Solutions to these challenges include the use of pulse compressors to precompensate the laser pulses for the effect of GVD,57, 58 and the use of SPM-induced spectral broadening to adjust for pulse broadening due to GVD.59, 60 Two recently reported methods are especially noteworthy. In the first approach, a photonic band gap fiber is used for femtosecond excitation light delivery;61 the photonic band gap fiber transmits femtosecond pulses that are free of SPM as well as GVD. It is to be noted that the endoscope design uses a separate high numerical aperture (NA) multimode fiber for fluorescence signal collection. Due to the difficulty in miniaturizing two different light guides, along with beam scanning hardware at the distal end, the endoscope is bulky ( in dimension). One recently developed approach goes away with the optical fiber completely and instead uses short long) rigid GRIN lenses ( to in diameter) as the light delivery mechanism. For this case, a laser beam raster directly scans on the proximal end of the GRIN lens.25, 62 The short length of the GRIN lens keeps the GVD and SPM effects small, but this approach also limits its application to shallow body parts only that allow reasonably straight line access to the region of interest such as in laparoscopic procedures.62 We note that by nature of its signal generation process, the light intensities used in multiphoton endoscopes are significantly higher ( focused on a spot size of for a time duration of is typical61) than those that are employed in other methods, with the exception of Raman-based methods. To the authors’ knowledge, no clinical multiphoton endoscope studies have been reported thus far. A final endoscopic method, known as spectrally encoded endoscopy, uses a broadband optical source coupled with a diffraction grating via a single-mode fiber.63 The endoscope design utilizes a diffraction grating that angularly disperses different wavelengths, which are then focused along a line on the target tissue using a front-end focusing lens. However, the technique relies on a slow scanning front-end mirror to acquire 2D image data. The researchers have also reported adaptations of the technique for 3D imaging, with axial resolution of .64, 65 This imaging method is advantageous as the use of a single fiber allows for much more compact probe design. 3.OCT: Method ReviewOver the past , OCT has matured into an important clinical imaging modality as it offers several important advantages. First, OCT has demonstrated the ability to provide high quality depth-resolved images of biological samples. Although, the depth scan range of OCT is typically limited to , the high imaging resolution offered by the technique makes it promising for a variety of diagnostic and surgical applications. Second, owing to the high sensitivity of the method, the light fluence level required for imaging is low, allowing its utilization even in sensitive tissue locales such as the eye. 66, 67, 68 A typical OCT setup consists of a Michelson interferometer and a low coherence light source. Backscattered light from the sample interferes with the light collected from the reference arm, providing depth-resolved structural information of the sample There are two main types of OCT systems—(1) time-domain OCT (TDOCT) 26, 67, 69, 70 and (2) spectral-domain OCT (SDOCT).71, 72, 73 In a TDOCT system [shown in Fig. 1a ], the reference arm is typically displaced and scanned over a distance equal to the depth range, , that we wish to probe for the sample. By translating the reference mirror at a uniform speed and filtering the acquired signal at the induced Doppler shift frequency associated with the translation speed, we can generate a depth-resolved profile (termed A-scan) of the sample’s reflectivity. The axial resolution is equal to the source coherence length , which is related to the source bandwidth by74 As mentioned earlier, a typical OCT system can offer axial resolution using superluminescent diodes. The development of commercially available broadband light sources in the near infrared (IR) band (D-series Broadlighters from SuperlumDiodes, Ltd.) has enabled much higher (e.g., ) axial resolution. The use of ultrabroadband light sources can confer even higher axial resolution.29, 75 The highest axial resolution demonstrated so far is .76For a TDOCT system, the filtered interference signal can be expressed as where and represent the optical power in the reference and sample arms, respectively, and is the sample reflectivity at depth into the sample. is the absorption coefficient and is the scattering coefficient. is the center wavelength of the broadband source. The first exponential term accounts for the loss of collected light due to absorption and scattering during the passage into and out of the sample. The convolution with the coherence envelope function implies that only light coming back from within the coherence gate takes part in the interference. The signal-to-noise ratio (SNR) of a typical TDOCT system when using a superluminescent diode (SLD) is approximately (for a typical power level of power level, pixel measurement time of , and wavelength of ). A TDOCT system with sensitivity can image as deep as into a tissue phantom with scattering coefficient. In contrast, a confocal microscope cannot image deeper than in a similar phantom. 77In a typical SDOCT scheme [see Fig. 1b], the reference arm mirror is immobilized and the detector is replaced by a low-loss spectrometer. The incoming light from sample and reference arms is spectrally dispersed by the spectrometer grating and detected using an array of different detectors, where can vary from hundreds to thousands. This type of SDOCT scheme is also known as spectral radar73 or Fourier domain OCT (FDOCT).78 Mathematically, the spectrally resolved interferometric OCT signal at the detector array can be expressed as where is the wavenumber, is source’s spectral profile, is optical power split factor of the coupler ( in an ideal case), is the reflectivity of the reference mirror, is the sample reflectivity at depth . The frequency of the spectral oscillation of the measured signal in space is proportional to the path length difference between the reference arm mirror and reflecting plane of interest within the sample. An interface having a smaller value produces a slower sinusoidal spectral oscillation in space. Therefore, a Fourier transform of the spectral measurement will produce an A-scan profile similar to that obtained from TDOCT. Notice that in this case, signal contribution from two or more interfaces can be collected simultaneously as they contribute to different spectral oscillation components. Moreover, the signal from each location can be detected over the entire measurement time . In comparison, a TDOCT system acquires an interference signal from a location over much shorter duration, . Given the same signal acquisition time , sample reflectivity , detector quantum efficiency , and depth scan range , the respective SNR for TDOCT and SDOCT systems can be expressed as33 where is the energy of photons. For a spectrometer with pixels, the highest spectral oscillation periodicity that is detectable is . Beyond that point, the oscillation will wrap around and create an aliasing signal. Using this criterion, we see thatFor simplicity, we can consider a rectangular spectral source. In this case, the coherence length is equal to , where is the spectral width of the source. Equation 4 can therefore be solved to yield . Hence, Eq. 4 can be rewritten asA comparison of Eqs. 5, 7 indicates that for a rectangular spectral source, a SDOCT system is intrinsically more sensitive than a TDOCT system by a factor of .34 For a Gaussian source, the SNR advantage of SDOCT over TDOCT is expected to be .34 This illustrates that for a given source power, sample reflectivity, and A-scan rate, a spectrometer-based SDOCT system with can, in principle, possess a sensitivity advantage over its counterpart TDOCT system.Notice that the spectrometer in the above SDOCT scheme essentially samples the spectral oscillations at approximately evenly spaced wavelengths. The spectral data is usually rescaled and resampled evenly in wavenumber space, before it is Fourier transformed to get the sample depth profile or A-scan. An alternative method would be to use a rapidly tuned narrowband source and measure the spectral oscillations at evenly spaced wavenumbers. The interference signal can be detected by a single detector or dual balanced detectors. This approach to SDOCT, which has been termed optical frequency domain reflectometry (OFDR),71 wavelength tuning interferometry (WTI),72 and optical frequency domain imaging (OFDI), 65 offers a similar sensitivity advantage over the conventional TDOCT as its counterpart spectrometer-based SDOCT. A typical SDOCT system can achieve a SNR of about . This improved sensitivity can be traded off in favor of shortened signal acquisition time. For instance, Cense 36 have shown an OCT data acquisition rate of spectra per second, with measured SNR, using a spectrometer-based SDOCT system. Recently, researchers at Massachusetts General Hospital79 and at Massachusetts Institute of Technology (MIT) 80 have reported ultrahigh-speed wavelength-swept sources that can enable OCT data acquisition at 115 and A-scan rates. This illustrates the potential of SDOCT-based systems to provide real-time imaging of tissue structures. However, we note that SDOCT-relies on computationally intensive Fourier transforms to deliver the final structural image of the biological sample. It is, therefore, important to introduce high-speed signal processing modules, such as field programmable gate arrays (FPGAs)81 to acquire and process the OCT data in real time for true video-rate imaging. Finally, we note that while a basic OCT imaging method is able to render depth-resolved structural images of biological samples, more sophisticated OCT imaging strategies can provide additional functional information, such as flow (through Doppler OCT),82, 83 tissue structural arrangement (through birefringence OCT),84, 85 depth-resolved spectral signatures (through spectral OCT),86, 87 and the spatial distribution of specific contrast agents (through molecular contrast OCT).28, 88 4.Survey of Endoscopic OCT MethodsThe relative ease of implementing high-speed and high-resolution OCT systems has prompted numerous efforts to implement OCT-based endoscopes. The primary design consideration is to minimize the diameter of the OCT probe. To this end, the single-mode fiber used for light transmission in most OCT systems is ideally suited for the purpose. Other important technical characteristics of an OCT probe are scanning range, field of view, speed, and flexibility. OCT probes can be divided into two groups based on their scan modes—side-imaging 37, 89, 90, 91, 92, 93, 94, 95, 96, 97 and forward-imaging probes. 38, 98, 99, 100, 101, 102, 103, 104, 105, 106, 107 In the past years, various OCT probes have been built to target specific applications, which we will discuss below. 4.1.Side-Imaging OCT ProbesThe majority of the endoscopic OCT systems reported in the literature are side-scanning. In these systems, the OCT probe light is emitted from and collected at the side of the endoscope. The general design of such a probe consists of a rod mirror or prism attached to a rotation assembly to deflect the emitted light from the optical fiber tip out of a window on the side of the probe. Side-imaging probes can be further divided into two categories: 1 circumferential and 2 linear (or translational) scanning probes. The first side-imaging OCT probe was a collaborative work of researchers at MIT and Massachusetts General Hospital.37 The rotation was achieved by attaching the proximal end of the flexible probe to a motor and a gear system [see Fig. 2a ]. At the distal end, the laser beam was focused by a GRIN lens attached to an optical fiber, and then reflected by a right angle prism as shown in Fig. 2b. The outer diameter and working distance of the OCT probe were 1.1 and , respectively. Later, a similar but smaller side-imaging OCT probe was built within a hypodermic needle.89 Yang have also demonstrated the use of angle-cut ball-lens fibers [see Fig. 2c] to realize the tip of side-imaging OCT endoscopes.90 Fig. 2Designs and actuation systems of side-imaging OCT probes. Portions (a) and (e) show actuation systems at the proximal end for circumferential and longitudinal scanning, respectively. Portions (b), (c), and (f) show the reported distal-end probe tip designs for side-imaging OCT probes. Portion (d) shows the design of a circumferential-scanning endoscopic OCT probe with actuation system at the distal end. 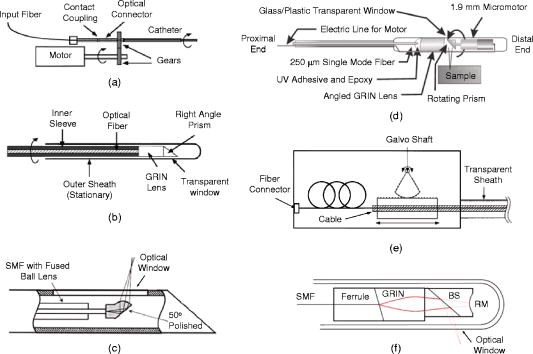 Another approach to building circumferential-imaging OCT probes is to employ the actuation system at the distal end. In this context, Tran 91 and Herz 92 reported, almost at the same time, the use of micromotors at the distal end of OCT probes in order to achieve circumferential scanning; the outer diameters of the reported OCT probes were 91 and .92 A representative schematic of a micromotor-based OCT endoscope91 is shown in Fig. 2d. It is to be noted that the distal actuation of the probe tip avoids the rotation of the whole probe and the necessity to couple light from a fixed fiber to a rotating fiber. However, the size of the actuator itself can be a limiting factor when minimizing the overall OCT probe size. Besides rotation, the linear translation of the OCT probe can also be used to achieve side imaging. Researchers from Harvard Medical School and Massachusetts General Hospital developed a linearly translating OCT endoscope;93 the angular displacement of a galvanometer shaft was converted into linear displacement of the OCT probe [see Fig. 2e]. Later, Yang 95 used an actuation system similar to that shown in Fig. 2e to realize a longitudinal scanning side-imaging OCT endoscope for in vivo Doppler imaging. Other adaptations of linearly scanning OCT probes include the use of a magnetic actuator94 or a linear galvanometer96 at the proximal end. It is to be noted that the distal end of all the linearly scanning probes mentioned above was identical to that shown in Fig. 2b. Recently, Tumlinson 97 have reported a longitudinal scanning endoscope that also houses an interferometer at the tip of the probe [see Fig. 2f] to eliminate dispersion and polarization mismatch between sample and reference arms for high-resolution endoscopic FDOCT. The endoscope features a outer diameter, A-scan rate, and linear scan speed. We note that all side-imaging OCT probes are essentially 2D in nature, although the combination of circumferential imaging and the back and forth translation of the probe may generate 3D images as well.94 The size of reported side-imaging OCT probes varies from , depending upon the type and location of the rotation assembly employed. Figure 3 shows an in vivo OCT image of hamster leg muscle acquired with the smallest ( diameter) reported circumferential-scanning OCT probe.89 The features of different side-imaging OCT probes reported to date are summarized in Table 1 . Fig. 3In vivo OCT image of hamster leg muscle acquired with the smallest reported side-imaging OCT needle. The muscle fascicles can clearly be recognized. Arrows indicate layered structure resulting from muscle birefringence. Scale bar is . Image acquired from Ref. 89.  Table 1Comparison of different side-imaging endoscopic OCT probes. NA: Not available, ** : Estimated using OCT system specifications; A/s: A-scans per second.
It is to be noted that Table 1 registers the achieved parameters for each of the side-imaging probes that have been reported in literature. While the numbers provide convenient points of reference, they do not represent the achievable limits. 4.2.Forward-Imaging OCT ProbesIn contrast to side-imaging OCT endoscopes, forward-imaging OCT endoscopes emit and collect light in front of the probe; hence, they can be very useful in providing tissue structural information forward of a catheter probe for image guidance during surgery or device placement. Unlike side-imaging OCT systems, the implementation of a forward-imaging system within a narrow probe is more technically challenging; unsurprisingly, the forward-imaging probes reported so far are relatively large (e.g., to ) in diameter. 38, 98, 99, 100, 101, 102, 103, 104, 105, 106, 107 In 1997, Boppart reported diameter lead zirconate titanate (PZT) cantilever-based handheld forward-imaging instruments for open-field and minimally invasive surgical procedures.38 In one design [see Fig. 4a ], the PZT cantilever was used to translate a fiber and a GRIN lens together for output beam scanning. Although, the fiber–GRIN lens assembly itself was compact, the overall size of the forward-imaging instrument was significant mainly due to the large diameter of the PZT cantilever. In the other design, shown in Fig. 4b, the fiber–GRIN lens assembly was translated in the image plane of a long rod lens to realize a rigid forward-imaging OCT probe for laparoscopic procedures. The probe featured a working distance with a lateral scan range. Later, Liu 98 demonstrated the use of a smaller diameter PZT actuator to scan a fiber in front of a stationary GRIN lens for output beam scanning [see Fig. 4c]. As opposed to the earlier designs reported in Ref. 38, the OCT endoscope utilized a resonant scanning mode that allowed very fast lateral scanning of the probe beam. The overall diameter of the fiber-optic OCT endoscope was with lateral scan range of , whereas the length of the distal rigid portion was . Fig. 4Forward-imaging OCT probes. (a) Hand-held OCT probe. (b) Rigid OCT laparoscope for minimally invasive procedures. (c) Flexible rapid scanning miniature OCT endoscope. (d) Galvo scanner-based linear scanning hand-held OCT scope. (e) Schematic of MEMS-based OCT endoscope, where (f) shows a MEMS mirror with pivot point in the middle of the mirror. (g) Fiber bundle based–OCT endoscope design. (h) Schematic of PARS-OCT probe showing profile of PARS-OCT B-scan mode. (i) Relay GRIN-based rigid OCT endoscope with fast dynamic focus tracking. SMF: single-mode fiber; BS: beamsplitter; L: lens; PBS: polarization beamsplitter; PZT: lead zirconate titinate; CM: Fiber-optic collimator; F: ferrule; G: gear; IFA: integrated force array; GL: GRIN lens. 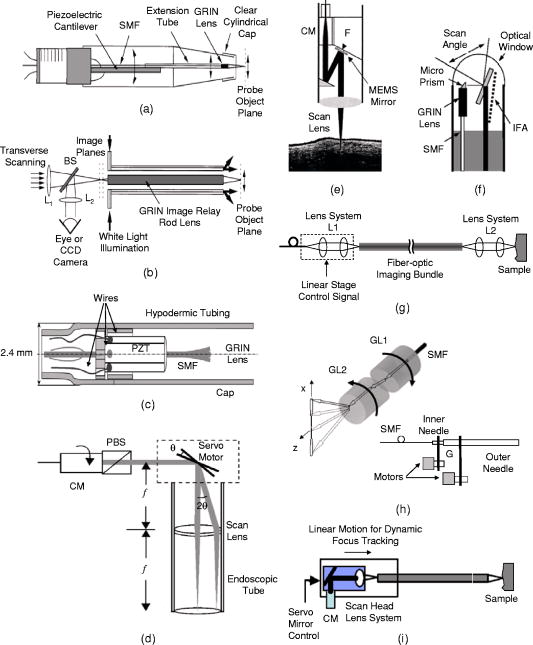 In retrospect, Sergeev reported the first fiber-based forward-imaging OCT endoscope.99 The endoscope design utilized an electromechanical unit at the distal end in order to move a fiber tip in the imaging plane of a stationary lens system to realize a diameter forward-scanning flexible OCT probe. A galvanometer–scanner based rigid arthroscopic OCT probe with lateral scanning range has also been reported.100 Instead of deflecting the fiber tip at the distal end, the galvanometer was used to scan a collimated beam in front of a lens, placed one focal length distance away from the galvo scanner, to achieve linear scanning of the output beam [see Fig. 4d]. The rigid elliptical scope sheath cross section was along the scan direction.100 Another class of forward-imaging probes is based on the use of microelectromechanical systems (MEMS)–based mirrors at the distal end for output beam scanning. Typically, light from the sample arm fiber is collimated before it enters a beam folding optics, where one element consists of a MEMS-based scanning mirror; the scanning optical beam is then focused by a scan lens [see Fig. 4e for a representative schematic]. Two such OCT endoscopes have reported the use of flapping MEMS mirrors, with a bimorph thermally actuated contraction hinge at one end.101, 102 The MEMS-based endoscopes were in diameter, with lateral scan range of 101 and .102 In comparison, Zara 103 have also reported a MEMS scanner, with a pivot point in the middle of the mirror, for endoscopic OCT; an integrated force array (IFA) linear actuator attached at one end of the mirror was used to pull and tilt the mirror for beam scanning [see Fig. 4f]. The MEMS mirror was incorporated into an experimental OCT system for proof-of-concept demonstration; however, the scanner will need to be modified and packaged appropriately if it is to be used in endoscopic applications.103 In addition, a two-axis MEMS mirror at the distal end can also be used to acquire 3D OCT images.104 In this respect, Yeow have reported proof-of-concept 3D OCT imaging of a fruit fly using a 2D MEMS scanner actuated by electrostatic forces.105 Another noteworthy effort in this direction reports the use of a 2D MEMS mirror for 3D OCT imaging a of a hamster cheek.108 However, further technology development is required to incorporate the scanner into an OCT probe for endoscopic applications. We also note that the MEMS-based probes are generally large in size, limiting their application to relatively large body passageways. Recently, one approach to 3D OCT imaging has reported the use of 2D beam scanning at the proximal end of a fiber bundle [see Fig. 4g]; a unity magnification lens–imaging system at the distal end was employed to focus the probe beam on the tissue sample.106 We note that although this probe design is capable of acquiring 3D images, only 2D images were reported. Besides the above implementations, Wu 107 have reported a design for a forward-imaging OCT needle probe, termed “paired angle rotation scanning (PARS) OCT probe.” As shown in Fig. 4h, this probe design utilizes a pair of angle-cut rotating GRIN lenses to deflect and scan the OCT probe beam across the forward region ahead of the probe tip. In this design, the scan actuation system may be located far from the probe tip, much like in the case of the side-imaging OCT probe described in Ref. 37, enabling easy miniaturization of the actual probe. Moreover, due to the nature of the scan mechanism, the lateral beam scanning at the exit face of the probe is minimal. This allows for maximization of the probe NA for a given probe size and working distance. Figure 5 shows OCT images of a tadpole acquired with the PARS-OCT—the smallest ( diameter) forward-imaging probe reported so far. Fig. 5OCT images of the dorsal region of a stage 54 xenopus laevis tadpole acquired using PARS-OCT (the smallest forward-imaging OCT probe reported so far). Images acquired from Ref. 107. 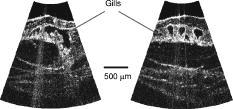 Recently, Xie 109 have reported a rigid OCT endoscope with fast dynamic focus tracking to improve lateral resolution [see Fig. 4i]. The probe design utilizes relay GRIN lenses similar to that in multiphoton endoscopes25, 62 and OCT laparoscopes,38 shown in Fig. 4b, for light delivery. Servo mirror-based 2D beam scanning is employed at the proximal end of a relay GRIN lens for lateral beam scanning on the sample. Forward-imaging imaging of rabbit trachea ex vivo has been demonstrated using a diameter OCT probe. The group has also demonstrated a diameter hybrid OCT probe design that employs a right-angle prism in the front to translate forward scanning into side scanning. We note that besides PARS-OCT,107 endoscope designs based on 2D MEMS mirrors,104, 105 fiber bundles, 106 and relay GRIN lenses109 are capable of 3D endoscopic OCT imaging. All other forward-imaging probes are essentially 2D in nature; although a combination of 2D forward scanning and probe rotation can also be used to obtain 3D OCT images. Recently, Myaing 110 have reported the development of a diameter fiber-optic probe for two-photon fluorescence imaging. The 2D beam scanning was achieved by vibrating the fiber cantilever near its mechanical resonant frequency in a spiral scanning fashion. It is to be noted that the scanning mechanism of this endoscope is an adaptation of an earlier resonant scanner–based endoscope design for OCT,98 which yields beam scanning primarily in one dimension. Although this study was aimed at two-photon fluorescence endoscopy, we note that the probe design is very much suited for 3D forward-imaging endoscopic OCT. Table 2 summarizes the features of different forward-imaging endoscopic OCT probes reported to date. The achievable lateral scan range for a given working distance, probe numerical aperture, and probe size are all relevant specifications that need to be considered when designing probes for specific applications. Table 2Comparison of different forward-imaging endoscopic OCT probes. NA: Not available; ** : Estimated using OCT system specifications; * : Lateral scan rate; A/s: A-scans per second.
5.Application Areas of Endoscopic OCTOCT has matured into an important imaging modality since its invention in 1991 and has been extensively applied in ophthalmology settings. The popularity of the method lies in the numerous advantages that it offers—high detection sensitivity allowing low light fluence levels, fast imaging speed, and high spatial resolution. The development of endoscopic OCT probes has opened up several application areas where this new imaging modality can make a large clinical impact. As mentioned earlier, side-imaging endoscopic OCT probes are suitable for imaging within a tubular organ, such as the vascular system, the gastrointestinal tract, the breast duct, and the urinary tract. In comparison, forward-imaging OCT probes can be very useful in providing tissue structural information forward of the catheter probe, such as for image-guided biopsy or device placement. The probe design considerations are considerably different in either case. Imaging within a tubular organ generally requires the probe to be more flexible so that it can conform to the curvature of the tubular organ. The probe size can be fairly large ( centimeter) for some of the large tubular organs such as the esophagus. In addition, it is generally the walls of the tubular system that is of clinical interest while the passageway itself is of little significance. Therefore, a side-imaging probe is more relevant in this context. In comparison, imaging needs associated with incision-based procedures generally place more emphasis on the region ahead of the needle or surgical tools. OCT endoscopes for such applications should be much stiffer, and small diameter probes are greatly desired in this context. As a guide for researchers working toward different OCT endoscope designs, Table 3 shows the size range of probes and needles that are presently used in the clinical setting. Table 3Probe and needle sources for common clinical and/or surgical procedures. The needle gauge table is from Ref. 194. The rest of the information is from various sources on the Web and various clinicians and surgeons (see acknowledgment).
In this section, we review the endoscopic OCT studies performed so far. We note that most of the works that have been reported are preliminary and are primarily focused at establishing the viability of using OCT-based endoscopic systems to perform imaging of the specific target areas. In the majority of the cases, systematic verifications of the utility of these endoscopes for clinical applications remain to be done. In addition to surveying the existing works, we will also highlight a few application areas in which we believe endoscopic OCT can play an important role. 5.1.Tubular Systems5.1.1.GI tractThe GI tract is the first internal organ for which endoscopic OCT was applied to study.69 The GI tract is well suited for endoscopic OCT applications for several reasons. First, the tract is wide (typically a few centimeters). It can, therefore, accommodate fairly large endoscopic probes with little ill effects. Second, the initial section of the GI tract—the esophagus—is fairly straight. This implies that fairly rigid and straight endoscopes can be used in this section without many complications. Third, there is a significant range of disease conditions that can arise in the GI tract for which the ability to obtain depth-resolved images can be of clinical significance and diagnostic utility. Examples of such conditions include Barrett’s esophagus,111 ulcerative pancolitis,112 and cancer.113, 114, 115 An area of significant clinical interest is staging GI cancer. Patients with chronic GI disorders can develop precancerous conditions, which may then progress into cancers. Most of the neoplastic changes in GI originate in the mucosal region—a region that extends from the surface of the GI to a depth of .99 Therefore, the ability to image mucosal and submucosal layers with sufficient resolution is extremely important to determine abnormal tissue structural changes. Diagnostics of patients with GI disorders are available through techniques such as endoscopy, EUS, CT, and MRI. However, owing to low spatial resolution, they do not render the image quality that is available with OCT. 116 Izatt 117 first demonstrated the ability of OCT to obtain cross-sectional images of the GI tissues with excised in vitro GI tissue specimens; a closely related work was also reported by Tearney (Ref. 118 is the most relevant among several others). The work is significant in establishing that OCT is able to distinguish the different tissue layers. It also provides the first evidence that invasive adenocarcinoma can be detected based on the disruption of the normal mucosal structure. The first demonstration of in vivo imaging of GI tissues using a circumferential side-imaging endoscopic probe [design shown in Figs. 2a and 2b] was reported by Tearney 69 Figure 6 shows high-resolution in vivo OCT images of a rabbit esophagus, which illustrate the ability of endoscopic OCT to delineate inner mucosal and submucosal layers of esophagus. Later, Bouma 93, 119 demonstrated OCT imaging of a normal human esophagus in vivo using a longitudinal scanning side-imaging endoscopic OCT probe. In vivo endoscopic OCT studies of a human stomach115, 120 and human bile duct121, 122, 123, 124 have also been reported. Fig. 6In vivo OCT imaging of the rabbit esophagus. (A) shows different layers of rabbit esophagus, which include the mucosa (m), the submucosa (sm), the inner muscular layer (im), the outer muscular layer (om), the serosa (s), and the adipose and vascular supportive tissues (a). (B) shows a blood vessel (v) within the submucosa of the esophagus. (C) Corresponding histology for (B) (hematoxylin and eosin stain); bars, . Images acquired from Ref. 69.  Vitkin’s group has also explored the incorporation of Doppler OCT functionality into their endoscopic probe systems for imaging the GI tract in rats and humans. 95, 125 Their work indicates that microvascular changes during disease progression can be detected and potentially may serve as diagnostic markers with the use of Doppler OCT. The inclusion of Doppler OCT imaging capability entails a modification in the way the acquired OCT signal is processed and does not require a modification of the probe design. As such, we expect the inclusion of Doppler OCT imaging capability in any prospective endoscopic probes will be driven by the usefulness of the functionality, as opposed to any technical implementation difficulties. It is to be noted that most of the reported endoscopic studies in the GI tract have used side-imaging endoscopes; this is due to the tubular structure of the GI tract, which makes side-imaging OCT endoscopes more suitable for imaging. One possible use of forward-imaging OCT probes in the GI tract will be as a guidance tool for image-assisted biopsies. A side-imaging OCT probe is less suitable in this context as the probe will occlude the region of interest. 5.1.2.Vascular systemThe vascular system is the other major area in which OCT endoscopy has been evaluated and studied for use. The focus of the reported studies is primarily on evaluating the use of OCT to aid in diagnosing coronary artery disease. Coronary artery disease often results from a condition known as atherosclerosis126, 127—a process in which deposits of fatty substances, cholesterol, cellular waste products, calcium and other substances build up in the inner lining of arteries. This build-up, also known as stenotic lesion, can grow large enough to block or significantly decrease the flow of blood through an artery. 128, 129 Sometimes, atherosclerotic lesions can rupture (soft or vulnerable plaques) causing blood clots that may result in arterial occlusion. 128, 129 Current imaging techniques, such as angiography,130, 131 are capable of detecting stenotic lesions (also classified as hard plaques), so that intervention such as angioplasty or stenting can take place.132 However, these techniques have difficulty detecting and distinguishing lesions classified as vulnerable or soft plaques,129 which have little to no effect on blood flow and yet can often result in sudden death when they rupture.133 It is therefore important to be able to highlight the presence of such high-risk stenotic lesions at an early stage. Studies have shown that vulnerable plaques have certain features, such as a thin fibrous cap with thickness of (a feature size well suited for OCT),134 large lipid core, and elevated macrophage content inside the fibrous cap.129 Side-imaging endoscopic OCT is shown to be extremely useful for imaging inner layers of the vascular system. In this respect, Brezinski 17, 135 were the first to compare endoscopic OCT and intravascular ultrasound (IVUS) imaging for assessment of atherosclerotic plaque morphology in vivo. Jang 136 have shown that OCT, owing to its superior resolution, provides additional morphologic information such as identification of intimal hyperplasia, internal and external elastic laminae, and echolucent (lipid-rich) regions not detectable with IVUS. This additional information has proven to be useful for improved characterization of different plaque types.137 Two recent studies have compared OCT with other imaging modalities including IVUS, palpography, thermography, spectroscopy, and intravascular MRI for the detection of individual characteristics of vulnerable plaques.138, 139 In another article, Schmitt 140 have compared various technologies such as angioscopy, angiography, electron beam CT, and IVUS with intravascular (or intracoronary) OCT (a commercial system from LightLab Imaging, Inc.). The outer diameter of the OCT probe distal tip was [design shown in Fig. 2b]. Figure 7c shows in vivo OCT images and corresponding histology of coronary lesions in cadaver arteries. A good correlation between the OCT images and corresponding histology indicates the ability of endoscopic OCT to diagnose arterial atherosclerosis with high precision. Compared with IVUS, OCT also provides more accurate assessment of coronary intima-media thickness.141 Since intimal thickening is considered to be an early phase of atherosclerosis, the use of intravascular OCT may prove to be useful for early prognosis of the coronary artery disease. The usefulness of intracoronary OCT for assessment of vulnerable plaques through the quantification of macrophage content and its distribution has also been demonstrated. 142, 143, 144 Tearney 145 have also reported on the characterization of vulnerable plaques based on spatial and temporal speckle analysis of lipid-rich plaques. Fig. 7Examples of (a) occlusion and (b) angioplasty balloon catheters. (c) Comparison of OCT images (right) and histology (left) of coronary lesions in cadaver arteries. Images acquired from Ref. 140.  Another important application of endoscopic OCT technology for vascular imaging is for monitoring intracoronary stents. Stent implantation, commonly guided by IVUS, could benefit from the higher resolution of OCT to identify poorly placed stents. Additionally, intravascular OCT can be useful in identifying regrowth of the vessel that may lead to restenosis.140, 146 Figure 8 shows a comparison of OCT and IVUS images acquired in the coronary arteries.146 Fig. 8(A) Optical coherence tomographic image showing tissue prolapse (indicated by filled arrow). The open arrow points to an underdeployed stent. (B) shows the corresponding IVUS image, indicating the inability of IVUS to resolve such small features. Images acquired from Ref. 146.  Looking ahead into the near future, we believe a potentially important use of endoscopic OCT is to aid in thrombus (clot) removal in patients with ischemic strokes. Forward-imaging OCT probes can be used to image the extent of the thrombus and determine the best approach for removal. Acute ischemic strokes can be classified into subcategories such as large-artery atherosclerosis, cardioembolism, and small-artery occlusion (lacune).147 Lacunar infarction (also known as small-vessel thrombosis) represents as high as 23% of all the cases of cerebral infarction. 148 The physical constraints on the OCT probes for imaging a single, deep-penetrating small artery, typically in diameter ( , as indicated in Ref. 149), are necessarily more stringent. In addition to small size, the OCT probes for lacunar thrombus removal will also need to be more flexible as these finer blood vessels are more prone to perforation. 5.1.3.Respiratory systemThe respiratory system is another venue in which OCT endoscopic methods can have significant clinical utility. The system is readily accessible and there are a range of pathological conditions that can benefit from endoscopic OCT imaging. These conditions include sleep apnea,150 laryngeal carcinoma,151 and bronchial inflammation.152 The dimension of the air passageway ranges from in the trachea153 to in the terminal bronchioles.154 Flexibility of the probe is of great significance in this case as the finer bronchioles are delicate. There are several preliminary studies with excised tissue samples. Pitris established that OCT can indeed delineate the epithelium, mucosa, cartilage, and glands in samples from the upper respiratory tract in 1998. 155 Yang furthered this line of research by imaging the main and tertiary bronchi.156, 157 The same group has also demonstrated that the carbon residuals from smoking function as a natural contrast agent in smokers’ lungs.158 Of particular interest is the report by Hanna 108 in which they demonstrated the use of a diameter side-imaging OCT probe [design shown in Fig. 2b] for 2D and 3D imaging of airway, lung, and pleura. In addition to in vivo imaging of animals (rabbit and pig), the researchers have also reported OCT catheter-based clinical bronchoscopies in human patients. Recently, Tsuboi 159 have demonstrated successful use of endoscopic OCT for imaging human bronchial lumens in vivo. These studies show the capability of endoscopic OCT to diagnose lesions in respiratory system without requiring excisional biopsies. 5.1.4.Urinary and reproductive tract systemThe urinary and reproductive tract system is the final area that we discuss in the context of tubular organs. This is yet another area in which endoscopic OCT tools can potentially play a significant diagnostic role and in which relatively little OCT-related research has been reported. The range of disease conditions that can potentially benefit from early and noninvasive diagnosis with OCT-based imaging include various gynecologic cancers (which arise in the vulva, vagina, and cervix), 160, 161, 162 prostate cancer,163, 164 and urinary bladder cancer.165 The regions of interest have also been surveyed with excised samples over the past decade by various research groups. Some of the noteworthy reports include Ref. 166 for the urinary tract, Refs. 166, 167, 168 for the bladder, Ref. 169 for various gynecologically relevant regions, and Ref. 170 for the prostate. Sergeev 99, 171 demonstrated the use of a forward-imaging OCT probe for in vivo imaging of healthy as well as cancerous human cervix and endometrium. To our knowledge, this is the first in vivo study of the human reproductive system. Later, Jesser 172 reported the use of a side-imaging OCT probe [see the probe design in Fig. 2b] for evaluation of bladder pathologies; in addition to OCT imaging of rabbit bladder in vivo, bladder specimens obtained from autopsy were also used in the study. A more far-reaching clinical study conducted by Russian researchers173, 174 has reported the successful use of outer diameter forward-imaging OCT probe, passed through the operating channel of a cystoscope, to image and evaluate mucosal sites of interest. The study indicates that endoscopic OCT may also be useful as an image-guidance tool for biopsy and surgical procedures of bladder. 5.2.Image-Guided Surgical Incision Procedures5.2.1.Ovarian systemUnlike most of the other parts of the reproductive system, clinical access to the ovaries is most easily gained through a surgical incision in the abdominal wall. Though ovarian cancer175 is rare, it has the highest mortality rate among the gynecological cancers.176 The ability to optically image and determine potential cancer formations on the ovary through a laparoscope can significantly improve the clinical accuracy of a diagnosis. In the context of endoscopic OCT imaging, a forward-imaging system would be a more suitable choice in this situation. The significance of this application was recognized fairly early in the development of forward-imaging OCT probe. Boppart 38 reported the first in vitro images of human ovary and uterus tissue using a forward-imaging rigid OCT laparoscope in 1997. More extensive research was reported in Ref. 176 by a different group (Brewer). The data was acquired from excised tissues. The later report strongly indicated that cancerous tissues are easily distinguished with OCT imaging. 5.2.2.Breast and liver biopsiesThe number of breast and liver biopsies performed per year is notably high. For breast cancer biopsy procedures alone, the number stands at approximately .177 The means for guidance of the biopsy needles to the appropriate tissue locales have significant drawbacks. For example, x-ray mammography, 178, 179 which enables image guided stereotactic breast biopsy, entails the usage of radiation that is harmful at high dosages. Ultrasound tomography methods have also been used in needle surgical procedures;180, 181 however, the low-resolution limits its efficacy. OCT image guidance can potentially increase the accuracy of the biopsy by identifying anomalous tissue regions prior to the actual tissue extraction. The potential of such guidance is illustrated by a recent in vitro pilot study with a rat mammary tumor model performed by Boppart, 182 in which they showed that breast cancers can be readily identified with OCT. In addition to providing image guidance for conventional biopsy procedures, OCT’s ability to render high-resolution images can also be potentially used as a means to evaluate tissue status without the need for biopsy. The need for some form of forward guidance in biopsy procedures has prompted Iftimia 183 to evaluate the use of a non-imaging OCT needle probe (23 gauge) system that is capable of taking a single A-scan into the tissue for breast aspiration biopsies. In this context, the development of narrow OCT endoscopes with 3D forward imaging capability is expected to improve the accuracy and effectiveness of such biopsy procedures. It is to be noted that the needle size requirements of such procedures (14 gauge for breast biopsies and 17 gauge for liver biopsies) has already been met by some of the reported forward-imaging OCT endoscope designs.107 We expect to see such applications in the near future. 5.2.3.Brain surgeryOne final area that we draw attention to is brain surgery. Brain surgery is performed in an event of penetrating head injuries,184 brain-related disorders (such as hydrocephalus,185 cerebral aneurysms,186 etc.), or brain tumors. Surgery related to brain tumors can be aimed to perform a biopsy or remove the tumor, although the cure rate depends on the complete removal of the tumor, as well as postsurgical therapeutic treatments. Imaging modalities such as ultrasound-, CT-, or MRI-guided minimally invasive stereotactic biopsies can be successfully performed for assessment of brain tumors.187 Complete removal of a brain tumor, however, depends on factors such as the type of tumor, its location, and the ability to accurately define resection boundaries. Although functional MRI188, 189 is a relatively better choice to differentiate whether the tumor is too close to regions of brain that control motor skills, it is often impossible (owing to the low spatial resolution of MRI) to determine exactly where the tumor ends and normal brain tissue begins. In order to avoid removal of normal brain tissue, with increased risk of causing neurological damage, neurosurgeons tend to be less aggressive and leave significant portions of the tumor behind. Postsurgery conventional or stereotactic radiation therapy is often sought to treat the remaining tumor. Whether in craniotomy (open skull surgery) or neuroendoscopy (minimally invasive surgery), it is highly desired to accurately define tumor resection boundaries. Boppart 190 and Bizheva 191 have reported on the use of OCT to discriminate between healthy and pathological human brain tissues. The use of a forward-imaging probe for surgical guidance in this context has yet to be reported. We believe that combining a narrow (e.g., ) high-speed 3D forward-imaging OCT needle probe with the existing low resolution but large volume scan stereotactic systems can potentially enhance tumor-related neurosurgical procedures where precision and tissue conservation are of high priorities. In addition to tumor removal or treatment, OCT-based image guidance is also a natural fit with deep brain stimulation procedures192 in which an electrode is placed within a specific location of the brain for intermittent electrical stimulation. Jafri 193 reported on such an application recently with a side-imaging probe. The technology of OCT-guided neurosurgery is in its infancy. We expect this highly important area will see significant progress in the near future. 6.ConclusionsEndoscopic OCT offers a means of obtaining high-resolution and high-speed depth-resolved visualization of tissue structures in vivo. Its relative low cost and nondestructive nature are highly attractive clinical advantages. While side-imaging mode OCT endoscopes have been developed and applied for imaging in GI tract and vascular systems clinically, there remains a wide range of promising clinical applications where OCT endoscopes can have significant impact but where little or no clinical research have been reported. The recent development of even smaller and more efficient forward-imaging OCT endoscopes is exciting as the probe size enters the range of needle sizes that are appropriate for image-based surgical needle guidance. We can also expect additional functional OCT methods, such as molecular contrast OCT28, 88 and birefringence OCT86, 87 to be employed in OCT endoscopes to provide additional information. AcknowledgmentThe authors would like to thank Benjamin Paz (MD), Michael A. Choma (MD, PhD), David Raphael (MD, PhD), Alice Yung (MD), and Marinko Sarunic (PhD) for useful suggestions and comments. This work is supported by funding from National Institutes of Health Grant No. 5R21EB004602-02. ReferencesR. S. Montgomery and
S. E. Wilson,
“Intraabdominal abscesses: Image-guided diagnosis and therapy,”
Clin. Infect. Dis., 23 28
–36
(1996). 1058-4838 Google Scholar
R. Agid,
M. Sklair-Levy,
A. I. Bloom,
S. Lieberman,
A. Polliack,
D. Ben-Yehuda,
Y. Sherman, and
E. Libson,
“CT-guided biopsy with cutting-edge needle for the diagnosis of malignant lymphoma: Experience of 267 biopsies,”
Clin. Radiol., 58 143
–147
(2003). 0009-9260 Google Scholar
A. Wagner,
O. Ploder,
G. Enislidis, and
M. Truppe,
“Image guided surgery,”
Int. J. Oral Maxillofac Surg., 25 147
–151
(1996). 0901-5027 Google Scholar
R. D. Bucholz,
K. R. Smith,
K. A. Laycock, and
L. L. McDurmont,
“Three-dimensional localization: From image-guided surgery to information-guided therapy,”
Methods, 25 186
–200
(2001). 1046-2023 Google Scholar
M. Siessegger,
R. A. Mischkowski,
B. T. Schneider,
B. Krug,
B. Klesper, and
J. E. Zoller,
“Image guided surgical navigation for removal of foreign bodies in the head and neck,”
J. Craniomaxillofac Surg., 29 321
–325
(2001). 1010-5182 Google Scholar
J. T. Yap,
J. P. J. Carney,
N. C. Hall, and
D. W. Townsend,
“Image-guided cancer therapy using PET/CT,”
Cancer J., 10 221
–233
(2004). 1528-9117 Google Scholar
R. Ewers,
K. Schicho,
M. Truppe, and
R. Seemann,
“Computer-aided navigation in dental implantology: of clinical experience,”
J. Oral Maxillofac Surg., 62 329
–334
(2004). 0278-2391 Google Scholar
F. Langlotz and
L. P. Nolte,
“Image-guided spine surgery,”
Minimally Invasive Ther. Allied Technol., 8 291
–296
(1999). 1364-5706 Google Scholar
D. W. Roberts,
K. Lunn,
H. Sun,
A. Hartov,
M. Miga,
F. Kennedy, and
K. Paulsen,
“Intra-operative image updating,”
Stereotact Funct Neurosurg., 76 148
–150
(2001). 1011-6125 Google Scholar
A. H. Chan,
V. Y. Fujimoto,
D. E. Moore,
R. T. Held,
M. Paun, and
S. Vaezy,
“In vivo feasibility of image-guided transvaginal focused ultrasound therapy for the treatment of intracavitary fibroids,”
Fertil. Steril., 82 723
–730
(2004). 0015-0282 Google Scholar
J. Ricke,
P. Wust,
A. Stohlmann,
A. Beck,
C. H. Cho,
M. Pech,
G. Wieners,
B. Spors,
M. Werk,
C. Rosner,
E. L. Hanninen, and
R. Felix,
“CT-guided brachytherapy. A novel percutaneous technique for interstitial ablation of liver malignancies,”
Strahlenther. Onkol., 180 274
–280
(2004). https://doi.org/10.1007/s00066-004-1179-4 0179-7158 Google Scholar
H. I. Vargas,
“Diagnosis of palpable breast masses: Ultrasound-guided large core biopsy in a multidisciplinary setting,”
Am. Surg., 70 867
–871
(2004). 0003-1348 Google Scholar
V. I. Shah,
U. Raju,
D. Chitale,
V. Deshpande,
N. Gregory, and
V. Strand,
“False-negative core needle biopsies of the breast—An analysis of clinical, radiologic, and pathologic findings in 27 consecutive cases of missed breast cancer,”
Cancer, 97 1824
–1831
(2003). 0008-543X Google Scholar
I. Yamada,
N. Saito,
K. Takeshita,
N. Yoshino,
A. Tetsumura,
J. Kumagai, and
H. Shibuya,
“Early gastric carcinoma: Evaluation with high-spatial-resolution MR imaging in vitro,”
Radiology, 220 115
–121
(2001). 0033-8419 Google Scholar
S. G. Worthley,
G. Helft,
V. Fuster,
Z. A. Fayad,
M. Shinnar,
L. A. Minkoff,
C. Schechter,
J. T. Fallon, and
J. J. Badimon,
“A novel nonobstructive intravascular MRI coil: in vivo imaging of experimental atherosclerosis,”
Arterioscler., Thromb., Vasc. Biol., 23 346
–350
(2003). https://doi.org/10.1161/01.ATV.0000053183.08854.A4 1079-5642 Google Scholar
M. J. Wiersema,
“High-resolution 25-megahertz ultrasonography of the gastrointestinal wall—Histologic correlates,”
Gastrointest. Endosc., 39 499
–504
(1993). 0016-5107 Google Scholar
M. E. Brezinski,
“Assessing atherosclerotic plaque morphology: Comparison of optical coherence tomography and high frequency intravascular ultrasound,”
Heart, 77 397
–403
(1997). 1355-6037 Google Scholar
J. F. Botet,
“Preoperative staging of esophageal cancer—Comparison of endoscopic us and dynamic CT,”
Radiology, 181 419
–425
(1991). 0033-8419 Google Scholar
G. A. Isenberg,
“Catheter-probe-assisted endoluminal US,”
Gastrointest. Endosc., 60 608
–622
(2004). 0016-5107 Google Scholar
F. J. Wallace,
“Fiber Optic Endoscopy,”
J. Urol. (Baltimore), 90 324
–334
(1963). 0022-5347 Google Scholar
R. P. Burke,
G. Michielon, and
G. Wernovsky,
“Video-assisted cardioscopy in congenital heart operations,”
Ann. Thorac. Surg., 58 864
–868
(1994). 0003-4975 Google Scholar
S. Andersson-Engels,
C. af Klinteberg,
K. Svanberg, and
S. Svanberg,
“In vivo fluorescence imaging for tissue diagnostics,”
Phys. Med. Biol., 42 815
–824
(1997). https://doi.org/10.1088/0031-9155/42/5/006 0031-9155 Google Scholar
Y. C. Liu and
A. S. Chiang,
“High-resolution confocal imaging and three-dimensional rendering,”
Methods, 30 86
–93
(2003). 1046-2023 Google Scholar
C. Xu,
W. Zipfel,
J. B. Shear,
R. M. Williams, and
W. W. Webb,
“Multiphoton fluorescence excitation: New spectral windows for biological nonlinear microscopy,”
Proc. Natl. Acad. Sci. U.S.A., 93 10763
–10768
(1996). https://doi.org/10.1073/pnas.93.20.10763 0027-8424 Google Scholar
J. C. Jung and
M. J. Schnitzer,
“Multiphoton endoscopy,”
Opt. Lett., 28 902
–904
(2003). 0146-9592 Google Scholar
D. Huang,
E. A. Swanson,
C. P. Lin,
J. S. Schuman,
W. G. Stinson,
W. Chang,
M. R. Hee,
T. Flotte,
K. Gregory,
C. A. Puliafito, and
J. G. Fujimoto,
“Optical coherence tomography,”
Science, 254 1178
–1181
(1991). https://doi.org/10.1126/science.1957169 0036-8075 Google Scholar
M. Rajadhyaksha,
M. Grossman,
D. Esterowitz, and
R. H. Webb,
“In-vivo confocal scanning laser microscopy of human skin—Melanin provides strong contrast,”
J. Invest. Dermatol., 104 946
–952
(1995). https://doi.org/10.1111/1523-1747.ep12606215 0022-202X Google Scholar
C. H. Yang,
“Molecular contrast optical coherence tomography: A review,”
Photochem. Photobiol., 81 215
–237
(2005). https://doi.org/10.1562/2004-08-06-IR-266.1 0031-8655 Google Scholar
A. Unterhuber,
B. Povazay,
K. Bizheva,
B. Hermann,
H. Sattmann,
A. Stingl,
T. Le,
M. Seefeld,
R. Menzel,
M. Preusser,
H. Budka,
C. Schubert,
H. Reitsamer,
P. K. Ahnelt,
J. E. Morgan,
A. Cowey, and
W. Drexler,
“Advances in broad bandwidth light sources for ultrahigh resolution optical coherence tomography,”
Phys. Med. Biol., 49 1235
–1246
(2004). https://doi.org/10.1088/0031-9155/49/7/011 0031-9155 Google Scholar
W. F. Cheong,
S. A. Prahl, and
A. J. Welch,
“A review Of the optical-properties of biological tissues,”
IEEE J. Quantum Electron., 26 2166
–2185
(1990). https://doi.org/10.1109/3.64354 0018-9197 Google Scholar
J. M. Schmitt,
“Optical coherence tomography (OCT): A review,”
IEEE J. Sel. Top. Quantum Electron., 5 1205
–1215
(1999). https://doi.org/10.1109/2944.796348 1077-260X Google Scholar
R. Leitgeb,
C. K. Hitzenberger, and
A. F. Fercher,
“Performance of Fourier domain vs. time domain optical coherence tomography,”
Opt. Express, 11 889
–894
(2003). 1094-4087 Google Scholar
J. F. de Boer,
B. Cense,
B. H. Park,
M. C. Pierce,
G. J. Tearney, and
B. E. Bouma,
“Improved signal-to-noise ratio in spectral-domain compared with time-domain optical coherence tomography,”
Opt. Lett., 28 2067
–2069
(2003). 0146-9592 Google Scholar
M. A. Choma,
M. Sarunic,
C. Yang, and
J. A. Izatt,
“Sensitivity advantage of swept source and Fourier domain optical coherence tomography,”
Opt. Express, 11 2183
–2189
(2003). 1094-4087 Google Scholar
M. Wojtkowski,
V. J. Srinivasan,
T. H. Ko,
J. G. Fujimoto,
A. Kowalczyk, and
J. S. Duker,
“Ultrahigh-resolution, high-speed, Fourier domain optical coherence tomography and methods for dispersion compensation,”
Opt. Express, 12 2404
–2422
(2004). https://doi.org/10.1364/OPEX.12.002404 1094-4087 Google Scholar
B. Cense and
N. A. Nassif,
“Ultrahigh-resolution high-speed retinal imaging using spectral-domain optical coherence tomography,”
Opt. Express, 12 2435
–2447
(2004). https://doi.org/10.1364/OPEX.12.002435 1094-4087 Google Scholar
G. J. Tearney,
S. A. Boppart,
B. E. Bouma,
M. E. Brezinski,
N. J. Weissman,
J. F. Southern, and
J. G. Fujimoto,
“Scanning single-mode fiber optic catheter-endoscope for optical coherence tomography,”
Opt. Lett., 21 543
–545
(1996). 0146-9592 Google Scholar
S. A. Boppart,
B. E. Bouma,
C. Pitris,
G. J. Tearney,
J. G. Fujimoto, and
M. E. Brezinski,
“Forward-imaging instruments for optical coherence tomography,”
Opt. Lett., 22 1618
–1620
(1997). 0146-9592 Google Scholar
“i-SCOPE 30 endoscope,”
Google Scholar
“Image guide (IGN-08/30),”
Google Scholar
B. Lee,
D. H. Cho,
S. C. Chung,
G. M. Eom,
K. S. Kim, and
Y. J. Kang,
“New optical design and image assessment of ultrahigh-resolution magnifying endoscope,”
Jpn. J. Appl. Phys., Part 2, 43 L1397
–L1399
(2004). https://doi.org/10.1143/JJAP.43.L1397 0021-4922 Google Scholar
W. J. Gomes,
A. Goldenberg,
E. Buffolo,
L. C. Losso,
W. Marcondes,
F. Rolla,
C. J. Imaeda,
J. H. Palma, and
S. Goldenberg,
“Video-endoscopic dissection of multiple pedicled arterial grafts for use in minimally invasive coronary artery bypass surgery,”
J. Cardiovasc. Surg., 41 7
–9
(2000). 0021-9509 Google Scholar
T. Morita,
S. Tamura,
J. Miyazaki,
Y. Higashidani, and
S. Onishi,
“Evaluation of endoscopic and histopathological features of serrated adenoma of the colon,”
Endoscopy, 33 761
–765
(2001). 0013-726X Google Scholar
P. D. Stevens,
C. J. Lightdale,
P. H. R. Green,
L. M. Siegel,
R. J. Garciacarrasquillo, and
H. Rotterdam,
“Combined magnification endoscopy with chromoendoscopy for the evaluation of Barretts-esophagus,”
Gastrointest. Endosc., 40 747
–749
(1994). 0016-5107 Google Scholar
M. G. Shim,
B. C. Wilson,
E. Marple, and
M. Wach,
“Study of fiber-optic probes for in vivo medical Raman spectroscopy,”
Appl. Spectrosc., 53 619
–627
(1999). https://doi.org/10.1366/0003702991947225 0003-7028 Google Scholar
N. Uedo,
H. Iishi,
M. Tatsuta,
T. Yamada,
H. Ogiyama,
K. Imanaka,
N. Sugimoto,
K. Higashino,
R. Ishihara,
H. Narahara, and
S. Ishiguro,
“A novel videoendoscopy system by using autofluorescence and reflectance imaging for diagnosis of esophagogastric cancers,”
Gastrointest. Endosc., 62 521
–528
(2005). 0016-5107 Google Scholar
R. S. Dacosta,
B. C. Wilson, and
N. E. Marcon,
“New optical technologies for earlier endoscopic diagnosis of premalignant gastrointestinal lesions,”
J. Gastroenterol. Hepatol, 17 S85
–S104
(2002). 0815-9319 Google Scholar
N. Stone,
C. Kendall,
N. Shepherd,
P. Crow, and
H. Barr,
“Near-infrared Raman spectroscopy for the classification of epithelial pre-cancers and cancers,”
J. Raman Spectrosc., 33 564
–573
(2002). https://doi.org/10.1002/jrs.882 0377-0486 Google Scholar
A. S. Haka,
K. E. Shafer-Peltier,
M. Fitzmaurice,
J. Crowe,
R. R. Dasari, and
M. S. Feld,
“Diagnosing breast cancer by using Raman spectroscopy,”
Proc. Natl. Acad. Sci. U.S.A., 102 12371
–12376
(2005). https://doi.org/10.1073/pnas.0501390102 0027-8424 Google Scholar
M. G. Shim,
L. Song,
N. E. Marcon, and
B. C. Wilson,
“In vivo near-infrared Raman spectroscopy: Demonstration of feasibility during clinical gastrointestinal endoscopy,”
Photochem. Photobiol., 72 146
–150
(2000). https://doi.org/10.1562/0031-8655(2000)072<0146:IVNIRS>2.0.CO;2 0031-8655 Google Scholar
A. R. Rouse,
A. Kano,
J. A. Udovich,
S. M. Kroto, and
A. F. Gmitro,
“Design and demonstration of a miniature catheter for a confocal microendoscope,”
Appl. Opt., 43 5763
–5771
(2004). https://doi.org/10.1364/AO.43.005763 0003-6935 Google Scholar
A. L. Polglase,
W. J. McLaren,
S. A. Skinner,
R. Kiesslich,
M. F. Neurath, and
P. M. Delaney,
“A fluorescence confocal endomicroscope for in vivo microscopy of the upper- and the lower-GI tract,”
Gastrointest. Endosc., 62 686
–695
(2005). 0016-5107 Google Scholar
J. Knittel,
L. Schnieder,
G. Buess,
B. Messerschmidt, and
T. Possner,
“Endoscope-compatible confocal microscope using a gradient index-lens system,”
Opt. Commun., 188 267
–273
(2001). https://doi.org/10.1016/S0030-4018(00)01164-0 0030-4018 Google Scholar
P. N. Kean,
K. Smith, and
W. Sibbett,
“Spectral and temporal investigation of self-phase modulation and stimulated Raman-scattering in a single-mode optical fiber,”
IEE Proc.-J: Optoelectron., 134 163
–170
(1987). 0267-3932 Google Scholar
D. Marcuse,
A. R. Chraplyvy, and
R. W. Tkach,
“Effect of fiber nonlinearity on long-distance transmission,”
J. Lightwave Technol., 9 121
–128
(1991). https://doi.org/10.1109/50.64931 0733-8724 Google Scholar
R. A. Sammut and
C. Pask,
“Group-velocity and dispersion in nonlinear-optical fibers,”
Opt. Lett., 16 70
–72
(1991). 0146-9592 Google Scholar
F. Helmchen,
M. S. Fee,
D. W. Tank, and
W. Denk,
“A miniature head-mounted two-photon microscope: High-resolution brain imaging in freely moving animals,”
Neuron, 31 903
–912
(2001). https://doi.org/10.1016/S0896-6273(01)00421-4 0896-6273 Google Scholar
W. Gobel,
J. N. D. Kerr,
A. Nimmerjahn, and
F. Helmchen,
“Miniaturized two-photon microscope based on a flexible coherent fiber bundle and a gradient-index lens objective,”
Opt. Lett., 29 2521
–2523
(2004). https://doi.org/10.1364/OL.29.002521 0146-9592 Google Scholar
D. Bird and
M. Gu,
“Resolution improvement in two-photon fluorescence microscopy with a single-mode fiber,”
Appl. Opt., 41 1852
–1857
(2002). 0003-6935 Google Scholar
D. Bird and
M. Gu,
“Two-photon fluorescence endoscopy with a micro-optic scanning head,”
Opt. Lett., 28 1552
–1554
(2003). 0146-9592 Google Scholar
B. A. Flusberg,
J. C. Lung,
E. D. Cocker,
E. P. Anderson, and
M. J. Schnitzer,
“In vivo brain imaging using a portable two-photon fluorescence microendoscope,”
Opt. Lett., 30 2272
–2274
(2005). https://doi.org/10.1364/OL.30.002272 0146-9592 Google Scholar
M. J. Levene,
D. A. Dombeck,
K. A. Kasischke,
R. P. Molloy, and
W. W. Webb,
“In vivo multiphoton microscopy of deep brain tissue,”
J. Neurophysiol., 91 1908
–1912
(2004). https://doi.org/10.1152/jn.01007.2003 0022-3077 Google Scholar
G. J. Tearney,
M. Shishkov, and
B. E. Bouma,
“Spectrally encoded miniature endoscopy,”
Opt. Lett., 27 412
–414
(2002). https://doi.org/10.1038/415412a 0146-9592 Google Scholar
D. Yelin,
B. E. Bouma,
N. Iftimia, and
G. J. Tearney,
“Three-dimensional spectrally encoded imaging,”
Opt. Lett., 28 2321
–2323
(2003). 0146-9592 Google Scholar
D. Yelin,
S. H. Yun,
B. E. Bouma, and
G. J. Tearney,
“Three-dimensional imaging using spectral encoding heterodyne interferometry,”
Opt. Lett., 30 1794
–1796
(2005). 0146-9592 Google Scholar
E. A. Swanson,
J. A. Izatt,
M. R. Hee,
D. Huang,
C. P. Lin,
J. S. Schuman,
C. A. Puliafito, and
J. G. Fujimoto,
“In-vivo retinal imaging by optical coherence tomography,”
Opt. Lett., 18 1864
–1866
(1993). 0146-9592 Google Scholar
M. R. Hee,
J. A. Izatt,
E. A. Swanson,
D. Huang,
J. S. Schuman,
C. P. Lin,
C. A. Puliafito, and
J. G. Fujimoto,
“Optical coherence tomography of the human retina,”
Arch. Ophthalmol. (Chicago), 113 325
–332
(1995). 0003-9950 Google Scholar
A. G. Podoleanu,
G. M. Dobre,
D. J. Webb, and
D. A. Jackson,
“Simultaneous en-face imaging of two layers in the human retina by low-coherence reflectometry,”
Opt. Lett., 22 1039
–1041
(1997). 0146-9592 Google Scholar
G. J. Tearney,
M. E. Brezinski,
B. E. Bouma,
S. A. Boppart,
C. Pitris,
J. F. Southern, and
J. G. Fujimoto,
“In vivo endoscopic optical biopsy with optical coherence tomography,”
Science, 276 2037
–2039
(1997). https://doi.org/10.1126/science.276.5321.2037 0036-8075 Google Scholar
W. Drexler,
U. Morgner,
F. X. Kartner,
C. Pitris,
S. A. Boppart,
X. D. Li,
E. P. Ippen, and
J. G. Fujimoto,
“In vivo ultrahigh-resolution optical coherence tomography,”
Opt. Lett., 24 1221
–1223
(1999). 0146-9592 Google Scholar
B. Golubovic,
B. E. Bouma,
G. J. Tearney, and
J. G. Fujimoto,
“Optical frequency-domain reflectometry using rapid wavelength tuning of a :forsterite laser,”
Opt. Lett., 22 1704
–1706
(1997). 0146-9592 Google Scholar
F. Lexer,
C. K. Hitzenberger,
A. F. Fercher, and
M. Kulhavy,
“Wavelength-tuning interferometry of intraocular distances,”
Appl. Opt., 36 6548
–6553
(1997). 0003-6935 Google Scholar
G. Hausler and
M. W. Lindner,
“‘Coherence radar’ and ‘spectral radar’—New tools for dermatological diagnosis,”
J. Biomed. Opt., 3 21
(1998). https://doi.org/10.1117/1.429899 1083-3668 Google Scholar
E. Swanson,
D. Huang,
M. Hee,
J. G. Fujimoto,
C. P. Lin, and
C. A. Puliafito,
“High-speed optical coherence domain reflectometry,”
Opt. Lett., 17 151
–153
(1992). 0146-9592 Google Scholar
W. Drexler,
“Ultrahigh-resolution optical coherence tomography,”
J. Biomed. Opt., 9 47
–74
(2004). https://doi.org/10.1117/1.1629679 1083-3668 Google Scholar
B. Povazay,
K. Bizheva,
A. H. Unterhuber,
B. Hermann,
H. Sattmann,
A. F. Fercher,
W. Drexler,
A. Apolonski,
W. J. Wadsworth,
J. C. Knight,
P. S. J. Russell,
M. Vetterlein, and
E. Scherzer,
“Submicrometer axial resolution optical coherence tomography,”
Opt. Lett., 27 1800
(2002). 0146-9592 Google Scholar
J. A. Izatt,
M. R. Hee,
G. M. Owen,
E. A. Swanson, and
J. G. Fujimoto,
“Optical coherence microscopy in scattering media,”
Opt. Lett., 19 590
–592
(1994). 0146-9592 Google Scholar
M. Wojtkowski,
R. Leitgeb,
A. Kowalczyk,
T. Bajraszewski, and
A. F. Fercher,
“In vivo human retinal imaging by Fourier domain optical coherence tomography,”
J. Biomed. Opt., 7 457
–463
(2002). https://doi.org/10.1117/1.1482379 1083-3668 Google Scholar
W. Y. Oh,
S. H. Yun,
B. J. Vakoc,
G. J. Tearney, and
B. E. Bouma,
“Ultrahigh—speed optical frequency domain imaging and application to laser ablation monitoring,”
Appl. Phys. Lett., 88 103902
(2006). https://doi.org/10.1063/1.2179125 0003-6951 Google Scholar
R. Huber,
M. Wojtkowski, and
J. G. Fujimoto,
“Fourier domain mode locking (FDML): A new laser operating regime and applications for optical coherence tomography,”
Opt. Express, 14 3225
–3237
(2006). https://doi.org/10.1364/OE.14.003225 1094-4087 Google Scholar
I. S. Uzun,
A. Amira, and
A. Bouridane,
“FPGA implementations of fast Fourier transforms for real-time signal and image processing,”
IEE Proc. Vision Image Signal Process., 152 283
–296
(2005). https://doi.org/10.1049/ip-vis:20041114 1350-245X Google Scholar
J. A. Izatt,
M. D. Kulkarni,
S. Yazdanfar,
J. K. Barton, and
A. J. Welch,
“In vivo bi-directional color Doppler flow imaging of picoliter blood volumes using optical coherence tomography,”
Opt. Lett., 22 4139
–4141
(1997). 0146-9592 Google Scholar
S. Yazdanfar,
A. M. Rollins, and
J. A. Izatt,
“Imaging and velocimetry of the human retinal circulation with color Doppler optical coherence tomography,”
Opt. Lett., 25 1448
–1450
(2000). 0146-9592 Google Scholar
J. F. de Boer,
T. E. Milner,
M. J. C. van Gemert, and
J. S. Nelson,
“Two-dimensional birefringence imaging in biological tissue by polarization-sensitive optical coherence tomography,”
Opt. Lett., 22 934
–936
(1997). 0146-9592 Google Scholar
M. J. Everett,
K. Schoenenberger,
B. W. Colston, and
L. B. Da Silva,
“Birefringence characterization of biological tissue by use of optical coherence tomography,”
Opt. Lett., 23 228
–230
(1998). 0146-9592 Google Scholar
U. Morgner,
W. Drexler,
F. X. Kartner,
X. D. Li,
C. Pitris,
E. P. Ippen, and
J. G. Fujimoto,
“Spectroscopic optical coherence tomography,”
Opt. Lett., 25 111
–113
(2000). 0146-9592 Google Scholar
R. Leitgeb,
M. Wojtkowski,
A. Kowalczyk,
C. K. Hitzenberger,
M. Sticker, and
A. F. Fercher,
“Spectral measurement of absorption by spectroscopic frequency-domain optical coherence tomography,”
Opt. Lett., 25 820
–822
(2000). 0146-9592 Google Scholar
K. D. Rao,
M. A. Choma,
S. Yazdanfar,
A. M. Rollins, and
J. A. Izatt,
“Molecular contrast in optical coherence tomography by use of a pump-probe technique,”
Opt. Lett., 28 340
–342
(2003). https://doi.org/10.1038/425340a 0146-9592 Google Scholar
X. D. Li,
C. Chudoba,
T. Ko,
C. Pitris, and
J. G. Fujimoto,
“Imaging needle for optical coherence tomography,”
Opt. Lett., 25 1520
–1522
(2000). 0146-9592 Google Scholar
V. X. D. Yang,
Y. X. Mao,
N. Munce,
B. Standish,
W. Kucharczyk,
N. E. Marcon,
B. C. Wilson, and
I. A. Vitkin,
“Interstitial Doppler optical coherence tomography,”
Opt. Lett., 30 1791
–1793
(2005). 0146-9592 Google Scholar
P. H. Tran,
D. S. Mukai,
M. Brenner, and
Z. P. Chen,
“In vivo endoscopic optical coherence tomography by use of a rotational microelectromechanical system probe,”
Opt. Lett., 29 1236
–1238
(2004). https://doi.org/10.1364/OL.29.001236 0146-9592 Google Scholar
P. R. Herz,
Y. Chen,
A. D. Aguirre,
K. Schneider,
P. Hsiung,
J. G. Fujimoto,
K. Madden,
J. Schmitt,
J. Goodnow, and
C. Petersen,
“Micromotor endoscope catheter for in vivo, ultrahigh-resolution optical coherence tomography,”
Opt. Lett., 29 2261
–2263
(2004). https://doi.org/10.1364/OL.29.002261 0146-9592 Google Scholar
B. E. Bouma and
G. J. Tearney,
“Power-efficient nonreciprocal interferometer and linear-scanning fiber-optic catheter for optical coherence tomography,”
Opt. Lett., 24 531
–533
(1999). https://doi.org/10.1038/21086 0146-9592 Google Scholar
P. R. Herz,
Y. Chen,
A. D. Aguirre,
J. G. Fujimoto,
H. Mashimo,
J. Schmitt,
A. Koski,
J. Goodnow, and
C. Petersen,
“Ultrahigh resolution optical biopsy with endoscopic optical coherence tomography,”
Opt. Express, 12 3532
–3542
(2004). https://doi.org/10.1364/OPEX.12.003532 1094-4087 Google Scholar
V. X. D. Yang,
M. L. Gordon,
S. J. Tang,
N. E. Marcon,
G. Gardiner,
B. Qi,
S. Bisland,
E. Seng-Yue,
S. Lo,
J. Pekar,
B. C. Wilson, and
I. A. Vitkin,
“High speed, wide velocity dynamic range Doppler optical coherence tomography (Part III): In vivo endoscopic imaging of blood flow in the rat and human gastrointestinal tracts,”
Opt. Express, 11 2416
–2424
(2003). 1094-4087 Google Scholar
A. R. Tumlinson,
L. P. Hariri,
U. Utzinger, and
J. K. Barton,
“Miniature endoscope for simultaneous optical coherence tomography and laser-induced fluorescence measurement,”
Appl. Opt., 43 113
–121
(2004). https://doi.org/10.1038/427113a 0003-6935 Google Scholar
A. R. Tumlinson,
J. K. Barton,
B. Povazay,
H. Sattman,
A. Unterhuber,
R. A. Leitgeb, and
W. Drexler,
“Endoscope-tip interferometer for ultrahigh resolution frequency domain optical coherence tomography in mouse colon,”
Opt. Express, 14 1878
–1887
(2006). https://doi.org/10.1364/OE.14.001878 1094-4087 Google Scholar
X. M. Liu,
M. J. Cobb,
Y. C. Chen,
M. B. Kimmey, and
X. D. Li,
“Rapid-scanning forward-imaging miniature endoscope for real-time optical coherence tomography,”
Opt. Lett., 29 1763
–1765
(2004). https://doi.org/10.1364/OL.29.001763 0146-9592 Google Scholar
A. M. Sergeev,
V. M. Gelikoniv,
G. V. Gelikonov,
F. I. Feldchtein,
R. V. Kuranov, and
N. D. Gladkova,
“In vivo endoscopic OCT imaging of precancer and cancer states of human mucosa,”
Opt. Express, 1 432
–440
(1997). 1094-4087 Google Scholar
Y. T. Pan,
Z. G. Li,
T. Q. Xie, and
C. R. Chu,
“Hand-held arthroscopic optical coherence tomography for in vivo high-resolution imaging of articular cartilage,”
J. Biomed. Opt., 8 648
–654
(2003). https://doi.org/10.1117/1.1609201 1083-3668 Google Scholar
Y. T. Pan,
H. K. Xie, and
G. K. Fedder,
“Endoscopic optical coherence tomography based on a microelectromechanical mirror,”
Opt. Lett., 26 1966
–1968
(2001). 0146-9592 Google Scholar
T. Q. Xie,
H. K. Xie,
G. K. Fedder, and
Y. T. Pan,
“Endoscopic optical coherence tomography with a modified microelectromechanical systems mirror for detection of bladder cancers,”
Appl. Opt., 42 6422
–6426
(2003). 0003-6935 Google Scholar
J. M. Zara,
S. Yazdanfar,
K. D. Rao,
J. A. Izatt, and
S. W. Smith,
“Electrostatic micromachine scanning mirror for optical coherence tomography,”
Opt. Lett., 28 628
–630
(2003). 0146-9592 Google Scholar
A. Jain,
A. Kopa,
Y. T. Pan,
G. K. Fedder, and
H. K. Xie,
“A two-axis electrothermal micromirror for endoscopic optical coherence tomography,”
IEEE J. Sel. Top. Quantum Electron., 10 636
–642
(2004). https://doi.org/10.1109/JSTQE.2004.829194 1077-260X Google Scholar
J. T. W. Yeow,
V. X. D. Yang,
A. Chahwan,
M. L. Gordon,
B. Qi,
I. A. Vitkin,
B. C. Wilson, and
A. A. Goldenberg,
“Micromachined 2-D scanner for 3-D optical coherence tomography,”
Sens. Actuators, A, 117 331
–340
(2005). https://doi.org/10.1016/j.sna.2004.06.021 0924-4247 Google Scholar
T. Q. Xie,
D. Mukai,
S. G. Guo,
M. Brenner, and
Z. P. Chen,
“Fiber-optic-bundle-based optical coherence tomography,”
Opt. Lett., 30 1803
–1805
(2005). 0146-9592 Google Scholar
J. Wu,
M. Conry,
C. Gu,
F. Wang,
Z. Yaqoob, and
C. Yang,
“Paired angle rotation scanning optical coherence tomography (PARS-OCT) forward-imaging probe,”
Opt. Lett., 31 1265
–1267
(2006). 0146-9592 Google Scholar
N. Hanna,
D. Saltzman,
D. Mukai,
Z. Chen,
S. Sasse,
J. Milliken,
S. Guo,
W. Jung,
H. Colt, and
M. Brenner,
“Two-dimensonal and 3-dimensional optical coherence tomographic imaging of the airway, lung, and pleura,”
IEICE Trans. Commun., 129 615
–622
(2005). 0916-8516 Google Scholar
T. Q. Xie,
S. G. Guo,
Z. P. Chen,
D. Mukai, and
M. Brenner,
“GRIN lens rod based probe for endoscopic spectral domain optical coherence tomography with fast dynamic focus tracking,”
Opt. Express, 14 3238
–3246
(2006). https://doi.org/10.1364/OE.14.003238 1094-4087 Google Scholar
M. T. Myaing,
D. J. MacDonald, and
X. D. Li,
“Fiber-optic scanning two-photon fluorescence endoscope,”
Opt. Lett., 31 1076
–1078
(2006). https://doi.org/10.1364/OL.31.001076 0146-9592 Google Scholar
R. C. Haggitt,
“Barretts-esophagus, dysplasia, and adenocarcinoma,”
Hum. Pathol., 25 982
–993
(1994). https://doi.org/10.1016/0046-8177(94)90057-4 0046-8177 Google Scholar
D. Clemett and
A. Markham,
“Prolonged-release mesalazine—A review of its therapeutic potential in ulcerative colitis and Crohn’s disease,”
Drugs, 59 929
–956
(2000). 0012-6667 Google Scholar
R. S. Sandler,
J. E. Everhart,
M. Donowitz,
E. Adams,
K. Cronin,
C. Goodman,
E. Gemmen,
S. Shah,
A. Avdic, and
R. Rubin,
“The burden of selected digestive diseases in the United States,”
Gastroenterology, 122 1500
–1511
(2002). 0016-5085 Google Scholar
G. Zuccaro,
N. Gladkova,
J. Vargo,
F. Feldchtein,
E. Zagaynova,
D. Conwell,
G. Falk,
J. Goldblum,
J. Dumot,
J. Ponsky,
G. Gelikonov,
B. Davros,
E. Donchenko, and
J. Richter,
“Optical coherence tomography of the esophagus and proximal stomach in health and disease,”
Am. J. Gastroenterol., 96 2633
–2639
(2001). https://doi.org/10.1016/S0002-9270(01)02681-8 0002-9270 Google Scholar
B. E. Bouma,
G. J. Tearney,
C. C. Compton, and
N. S. Nishioka,
“High-resolution imaging of the human esophagus and stomach in vivo using optical coherence tomography,”
Gastrointest. Endosc., 51 467
–474
(2000). 0016-5107 Google Scholar
M. E. Brezinski and
J. G. Fujimoto,
“Optical coherence tomography: High-resolution imaging in nontransparent tissue,”
IEEE J. Sel. Top. Quantum Electron., 5 1185
–1192
(1999). https://doi.org/10.1109/2944.796345 1077-260X Google Scholar
J. A. Izatt,
M. D. Kulkarni,
H. W. Wang,
K. Kobayashi, and
M. V. Sivak,
“Optical coherence tomography and microscopy in gastrointestinal tissues,”
IEEE J. Sel. Top. Quantum Electron., 2 1017
–1028
(1996). https://doi.org/10.1109/2944.577331 1077-260X Google Scholar
G. J. Tearney,
M. E. Brezinski,
J. F. Southern,
B. E. Bouma,
S. A. Boppart, and
J. G. Fujimoto,
“Optical biopsy in human gastrointestinal tissue using optical coherence tomography,”
Am. J. Gastroenterol., 92 1800
–1804
(1997). 0002-9270 Google Scholar
B. E. Bouma,
G. J. Tearney,
C. C. Compton, and
N. S. Nishioka,
“Endoscopic optical coherence tomography of the gastrointestinal tract,”
Gastrointest. Endosc., 49 AB152
–AB152
(1999). 0016-5107 Google Scholar
M. V. Sivak,
K. Kobayashi,
J. A. Izatt,
A. M. Rollins,
R. Ung-runyawee,
A. Chak,
R. C. K. Wong,
G. A. Isenberg, and
J. Willis,
“High-resolution endoscopic imaging of the GI tract using optical coherence tomography,”
Gastrointest. Endosc., 51 474
–479
(2000). 0016-5107 Google Scholar
U. Seitz,
J. Freund,
S. Jaeckle,
E. Feldchtein,
S. Bohnacker,
F. Thonke,
N. Gladkova,
B. Brand,
S. Schroder, and
N. Soehendra,
“First in vivo optical coherence tomography in the human bile duct,”
Endoscopy, 33 1018
–1021
(2001). 0013-726X Google Scholar
J. M. Poneros,
G. J. Tearney,
M. Shiskov,
P. B. Kelsey,
G. Y. Lauwers,
N. S. Nishioka, and
B. E. Bouma,
“Optical coherence tomography of the biliary tree during ERCP,”
Gastrointest. Endosc., 55 84
–88
(2002). 0016-5107 Google Scholar
U. Seitz and
N. Soehendra,
“Endoscopy: Current state and future trends in tumor diagnosis,”
Anticancer Res., 23 827
–829
(2003). 0250-7005 Google Scholar
P. Singh,
A. Chak,
J. E. Willis,
A. Rollins, and
M. V. Sivak,
“In vivo optical coherence tomography imaging of the pancreatic and biliary ductal system,”
Gastrointest. Endosc., 62 970
–974
(2005). 0016-5107 Google Scholar
V. X. D. Yang,
S. J. Tang,
M. L. Gordon,
B. Qi,
G. R. Gardiner,
M. Cirocco,
P. Kortan,
G. B. Haber,
G. Kandel,
I. A. Vitkin,
B. C. Wilson, and
N. E. Marcon,
“Endoscopic Doppler optical coherence tomography in the human GI tract: initial experience,”
Gastrointest. Endosc., 61 879
–890
(2005). 0016-5107 Google Scholar
R. Ross,
“Mechanisms of disease—Atherosclerosis—An inflammatory disease,”
N. Engl. J. Med., 340 115
–126
(1999). https://doi.org/10.1056/NEJM199901143400207 0028-4793 Google Scholar
R. Ross,
“The pathogenesis of atherosclerosis—A perspective for the 1990s,”
Nature (London), 362 801
–809
(1993). https://doi.org/10.1038/362801a0 0028-0836 Google Scholar
J. A. Berliner,
M. Navab,
A. M. Fogelman,
J. S. Frank,
L. L. Demer,
P. A. Edwards,
A. D. Watson, and
A. J. Lusis,
“Atherosclerosis—Basic mechanisms—Oxidation, inflammation, and genetics,”
Circulation, 91 2488
–2496
(1995). 0009-7322 Google Scholar
E. Falk,
“Why do plaques rupture,”
Circulation, 86 30
–42
(1992). 0009-7322 Google Scholar
M. Remy-Jardin and
J. Remy,
“Spiral CT angiography of the pulmonary circulation,”
Radiology, 212 615
–636
(1999). 0033-8419 Google Scholar
R. R. Edelman,
H. P. Mattle,
D. J. Atkinson, and
H. M. Hoogewoud,
“Mr Angiography,”
Am. J. Roentgenol., 154 937
–946
(1990). 0092-5381 Google Scholar
W. D. Weaver,
R. J. Simes,
A. Betriu,
C. L. Grines,
F. Zijlstra,
E. Garcia,
L. Grinfeld,
R. J. Gibbons,
E. E. Ribeiro,
M. A. DeWood, and
F. Ribichini,
“Comparison of primary coronary angioplasty and intravenous thrombolytic therapy for acute myocardial infarction—A quantitative review,”
J. Am. Med. Assoc., 278 2093
–2098
(1997). https://doi.org/10.1001/jama.278.23.2093 0098-7484 Google Scholar
E. Falk,
P. K. Shah, and
V. Fuster,
“Coronary Plaque Disruption,”
Circulation, 92 657
–671
(1995). 0009-7322 Google Scholar
Z. A. Fayad and
V. Fuster,
“Clinical imaging of the high-risk or vulnerable atherosclerotic plaque,”
Circ. Res., 89 305
–316
(2001). 0009-7330 Google Scholar
M. E. Brezinski,
G. J. Tearney,
B. E. Bouma,
S. A. Boppart,
M. R. Hee,
E. A. Swanson,
J. F. Southern, and
J. G. Fujimoto,
“High-resolution imaging of plaque morphology with optical coherence tomography,”
Circulation, 92 103
–103
(1995). 0009-7322 Google Scholar
I. K. Jang,
B. E. Bouma,
D. H. Kang,
S. J. Park,
S. W. Park,
K. B. Seung,
K. B. Choi,
M. Shishkov,
K. Schlendorf,
E. Pomerantsev,
S. L. Houser,
H. T. Aretz, and
G. J. Tearney,
“Visualization of coronary atherosclerotic plaques in patients using optical coherence tomography: Comparison with intravascular ultrasound,”
J. Am. Coll. Cardiol., 39 604
–609
(2002). https://doi.org/10.1016/S0735-1097(01)01799-5 0735-1097 Google Scholar
H. Yabushita,
B. E. Bourna,
S. L. Houser,
T. Aretz,
I. K. Jang,
K. H. Schlendorf,
C. R. Kauffman,
M. Shishkov,
D. H. Kang,
E. F. Halpern, and
G. J. Tearney,
“Characterization of human atherosclerosis by optical coherence tomography,”
Circulation, 106 1640
–1645
(2002). https://doi.org/10.1161/01.CIR.0000029927.92825.F6 0009-7322 Google Scholar
B. D. MacNeill,
H. C. Lowe,
M. Takano,
V. Fuster, and
I. K. Jang,
“Intravascular modalities for detection of vulnerable plaque—Current status,”
Arterioscler., Thromb., Vasc. Biol., 23 1333
–1342
(2003). https://doi.org/10.1161/01.ATV.0000080948.08888.BF 1079-5642 Google Scholar
G. A. Rodriguez-Granillo,
E. Regar,
J. A. Schaar, and
P. W. Serruys,
“New insights towards catheter-based identification of vulnerable plaque,”
Rev. Esp. Cardiol., 58 1197
–1206
(2005). 0300-8932 Google Scholar
J. Schmitt,
D. Kolstad, and
C. Petersen,
“Intravascular optical coherence tomography opens a window onto coronary artery disease,”
Opt. Photonics News, 15
(2), 20
–25
(2004). https://doi.org/10.1364/OPN.15.000020 1047-6938 Google Scholar
T. Kume,
T. Akasaka,
T. Kawamoto,
N. Watanabe,
E. Toyota,
Y. Neishi,
R. Sukmawan,
Y. Sadahira, and
K. Yoshida,
“Assessment of coronary intima-media thickness by optical coherence tomography—Comparison with intravascular ultrasound,”
Circ. J., 69 903
–907
(2005). Google Scholar
B. D. MacNeill,
I. K. Jang,
B. E. Bouma,
N. Iftimia,
M. Takano,
H. Yabushita,
M. Shishkov,
C. R. Kaufman,
S. L. Houser,
H. T. Aretz,
D. DeJoseph,
E. F. Halpern, and
G. J. Tearney,
“Focal and multi-focal plaque distributions in patients with macrophage acute and stable presentations of coronary artery disease,”
J. Am. Coll. Cardiol., 44 972
–979
(2004). https://doi.org/10.1016/j.jacc.2004.05.066 0735-1097 Google Scholar
B. D. MacNeill,
I. K. Jang,
B. E. Bouma,
N. Iftimia,
M. Takano,
H. Yabushita,
M. Shishkov, and
G. J. Tearney,
“In vivo macrophage Imaging of acute coronary syndromes with intracoronary optical coherence tomography,”
J. Am. Coll. Cardiol., 43 33A
–33A
(2004). https://doi.org/10.1016/S0735-1097(04)90139-8 0735-1097 Google Scholar
G. J. Tearney,
I. K. Jang, and
B. E. Bouma,
“Optical coherence tomography for imaging the vulnerable plaque,”
J. Biomed. Opt., 11
(2006)
(1083-3668) Google Scholar
G. Tearney and
B. Bouma,
“Atherosclerotic plaque characterization by spatial and temporal speckle pattern analysis,”
Opt. Lett., 27 533
–535
(2002). https://doi.org/10.1038/417533a 0146-9592 Google Scholar
B. E. Bouma,
G. J. Tearney,
H. Yabushita,
M. Shishkov,
C. R. Kauffman,
D. D. Gauthier,
B. D. MacNeill,
S. L. Houser,
H. T. Aretz,
E. F. Halpern, and
I. K. Jang,
“Evaluation of intracoronary stenting by intravascular optical coherence tomography,”
Heart, 89 317
–320
(2003). 1355-6037 Google Scholar
H. P. Adams,
B. H. Bendixen,
L. J. Kappelle,
J. Biller,
B. B. Love,
D. L. Gordon,
E. E. Marsh, Investigators,
“Classification of Subtype of Acute Ischemic Stroke—Definitions for Use in a Multicenter Clinical-Trial,”
Stroke, 24 35
–41
(1993). 0039-2499 Google Scholar
J. Bamford,
P. Sandercock,
M. Dennis,
J. Burn, and
C. Warlow,
“Classification and natural-history of clinically identifiable subtypes of cerebral infarction,”
Lancet, 337 1521
–1526
(1987). https://doi.org/10.1016/0140-6736(91)93206-O 0140-6736 Google Scholar
C. Guilleminault,
A. Tilkian, and
W. C. Dement,
“Sleep Apnea Syndromes,”
Annu. Rev. Med., 27 465
–484
(1976). 0066-4219 Google Scholar
E. E. Vokes,
R. R. Weichselbaum,
S. M. Lippman, and
W. K. Hong,
“Medical Progress—Head and Neck-Cancer,”
N. Engl. J. Med., 328 184
–194
(1993). https://doi.org/10.1056/NEJM199301213280306 0028-4793 Google Scholar
H. Smith,
“Asthma, inflammation, eosinophils and bronchial hyperresponsiveness,”
Clin. Exp. Allergy, 22 187
–197
(1992). 0954-7894 Google Scholar
C. Pitris,
M. E. Brezinski,
B. E. Bouma,
G. J. Tearney,
J. F. Southern, and
J. G. Fujimoto,
“High resolution imaging of the upper respiratory tract with optical coherence tomography—A feasibility study,”
Am. J. Respir. Crit. Care Med., 157 1640
–1644
(1998). 1073-449X Google Scholar
S. C. Whiteman,
Y. Yang,
D. G. van Pittius,
M. Stephens,
J. Parmer, and
M. A. Spiteri,
“Optical coherence tomography: Real-time imaging of bronchial airways microstructure and detection of inflammatory/neoplastic morphologic changes,”
Clin. Cancer Res., 12 813
–818
(2006). 1078-0432 Google Scholar
Y. Yang,
S. Whiteman,
D. G. van Pittius,
Y. H. He,
R. K. K. Wang, and
M. A. Spiteri,
“Use of optical coherence tomography in delineating airways microstructure: Comparison of OCT images to histopathological sections,”
Phys. Med. Biol., 49 1247
–1255
(2004). https://doi.org/10.1088/0031-9155/49/7/012 0031-9155 Google Scholar
Y. Yang,
P. O. Bagnaninchi,
S. C. Whiteman,
D. G. van Pittius,
A. J. El Haj,
M. A. Spiteri, and
R. K. K. Wang,
“A naturally occurring contrast agent for OCT imaging of smokers" lung,”
J. Phys. D, 38 2590
–2596
(2005). https://doi.org/10.1088/0022-3727/38/15/009 0022-3727 Google Scholar
M. Tsuboi,
A. Hayashi,
N. Ikeda,
H. Honda,
Y. Kato,
S. Ichinose, and
H. Kato,
“Optical coherence tomography in the diagnosis of bronchial lesions,”
Lung Cancer, 49 387
–394
(2005). 0169-5002 Google Scholar
B. P. Alter,
“Fanconi’s anemia and malignancies,”
Am. J. Hematol., 53 99
–110
(1996). 0361-8609 Google Scholar
D. M. Zhang,
W. F. Holmes,
S. J. Wu,
D. R. Soprano, and
K. J. Soprano,
“Retinoids and ovarian cancer,”
J. Cell Physiol., 185 1
–20
(2000). 0021-9541 Google Scholar
S. E. Waggoner,
“Cervical cancer,”
Lancet, 361 2217
–2225
(2003). https://doi.org/10.1016/S0140-6736(03)13778-6 0140-6736 Google Scholar
B. S. Carter,
G. S. Bova,
T. H. Beaty,
G. D. Steinberg,
B. Childs,
W. B. Isaacs, and
P. C. Walsh,
“Hereditary prostate-cancer—Epidemiologic and clinical-features,”
J. Urol. (Baltimore), 150 797
–802
(1993). 0022-5347 Google Scholar
K. J. Pienta and
P. S. Esper,
“Risk-factors for prostate-cancer,”
Ann. Intern Med., 118 793
–803
(1993). 0003-4819 Google Scholar
S. H. Kroft and
R. Oyasu,
“Urinary-Bladder Cancer—Mechanisms of Development and Progression,”
Lab. Invest., 71 158
–174
(1994). 0023-6837 Google Scholar
G. J. Tearney,
M. E. Brezinski,
J. F. Southern,
B. E. Bouma,
S. A. Boppart, and
J. G. Fujimoto,
“Optical biopsy in human urologic tissue using optical coherence tomography,”
J. Urol. (Baltimore), 157 1915
–1919
(1997). https://doi.org/10.1097/00005392-199705000-00111 0022-5347 Google Scholar
Y. T. Pan,
J. P. Lavelle,
S. I. Bastacky,
S. Meyers,
G. Pirtskhalaishvili,
M. L. Zeidel, and
D. L. Farkas,
“Detection of tumorigenesis in rat bladders with optical coherence tomography,”
Med. Phys., 28 2432
–2440
(2001). https://doi.org/10.1118/1.1418726 0094-2405 Google Scholar
T. Q. Xie,
M. L. Zeidel, and
Y. T. Pan,
“Detection of tumorigenesis in urinary bladder with optical coherence tomography: optical characterization of morphological changes,”
Opt. Express, 10 1431
–1443
(2002). 1094-4087 Google Scholar
C. Pitris,
A. Goodman,
S. A. Boppart,
J. J. Libus,
J. G. Fujimoto, and
M. E. Brezinski,
“High-resolution imaging of gynecologic neoplasms using optical coherence tomography,”
Obstet. Gynecol. (N.Y., NY, U. S.), 93 135
–139
(1999). https://doi.org/10.1016/S0029-7844(98)00375-5 0029-7844 Google Scholar
A. V. D’Amico,
M. Weinstein,
X. D. Li,
J. P. Richie, and
J. Fujimoto,
“Optical coherence tomography as a method for identifying benign and malignant microscopic structures in the prostate gland,”
Urology, 55 783
–787
(2000). https://doi.org/10.1016/S0090-4295(00)00475-1 0090-4295 Google Scholar
F. I. Feldchtein,
G. V. Gelikonov,
V. M. Gelikonov,
R. V. Kuranov,
A. M. Sergeev,
N. D. Gladkova,
A. V. Shakhov,
N. M. Shakhova,
L. B. Snopova,
A. B. Terent’eva,
E. V. Zagainova,
Y. P. Chumakov, and
I. A. Kuznetzova,
“Endoscopic applications of optical coherence tomography,”
Opt. Express, 3 257
–270
(1998). 1094-4087 Google Scholar
C. A. Jesser,
S. A. Boppart,
C. Pitris,
D. L. Stamper,
G. P. Nielsen,
M. E. Brezinski, and
J. G. Fujimoto,
“High resolution imaging of transitional cell carcinoma with optical coherence tomography: feasibility for the evaluation of bladder pathology,”
Br. J. Radiol., 72 1170
–1176
(1999). 0007-1285 Google Scholar
E. V. Zagaynova,
O. S. Streltsova,
N. D. Gladkova,
L. B. Snopova,
G. V. Gelikonov,
F. I. Feldchtein, and
A. N. Morozov,
“In vivo optical coherence tomography feasibility for bladder disease,”
J. Urol. (Baltimore), 167 1492
–1496
(2002). https://doi.org/10.1016/S0022-5347(05)65351-7 0022-5347 Google Scholar
M. J. Manyak,
N. D. Gladkova,
J. H. Makari,
A. M. Schwartz,
E. V. Zagaynova,
L. Zolfaghari,
J. M. Zara,
R. Iksanov, and
F. I. Feldchtein,
“Evaluation of superficial bladder transitional-cell carcinoma by optical coherence tomography,”
J. Endourol, 19 570
–574
(2005). 0892-7790 Google Scholar
F. Parazzini,
S. Franceschi,
C. Lavecchia, and
M. Fasoli,
“The epidemiology of ovarian-cancer,”
Gynecol. Oncol., 43 9
–23
(1991). 0090-8258 Google Scholar
M. A. Brewer,
U. Utzinger,
J. K. Barton,
J. B. Hoying,
N. D. Kirkpatrick,
W. R. Brands,
J. R. Davis,
K. Hunt,
S. J. Stevens, and
A. F. Gmitro,
“Imaging of the ovary,”
Technol. Cancer Res. Treat., 3 617
–627
(2004). 1533-0346 Google Scholar
P. J. Kneeshaw,
L. W. Turnbull, and
P. J. Drew,
“Current applications and future direction of MR mammography,”
Br. J. Cancer, 88 4
–10
(2003). https://doi.org/10.1038/sj.bjc.6600713 0007-0920 Google Scholar
M. Sabel and
H. Aichinger,
“Recent developments in breast imaging,”
Phys. Med. Biol., 41 315
–368
(1996). https://doi.org/10.1088/0031-9155/41/3/001 0031-9155 Google Scholar
A. A. Bravo,
S. G. Sheth, and
S. Chopra,
“Current concepts: Liver biopsy,”
N. Engl. J. Med., 344 495
–500
(2001). https://doi.org/10.1056/NEJM200102153440706 0028-4793 Google Scholar
G. Caletti and
A. Ferrari,
“Endoscopic ultrasonography,”
Endoscopy, 28 156
–173
(1996). 0013-726X Google Scholar
S. A. Boppart,
“Optical coherence tomography: Feasibility for basic research and image-guided surgery of breast cancer,”
Breast Cancer Res. Treat., 84 85
–97
(2004). https://doi.org/10.1023/B:BREA.0000018401.13609.54 0167-6806 Google Scholar
N. V. Iftimia,
B. E. Bouma,
M. B. Pitman,
B. Goldberg,
J. Bressner, and
G. J. Tearney,
“A portable, low coherence interferometry based instrument for fine needle aspiration biopsy guidance,”
Rev. Sci. Instrum., 76 064301
(2005). https://doi.org/10.1063/1.1921509 0034-6748 Google Scholar
W. Thorell,
“History of neurosurgical techniques in head injury,”
Neurosurg. Clin. N. Am., 12 11
(2001). 1042-3680 Google Scholar
H. Engelhard,
C. O. Andrews,
K. V. Slavin, and
F. T. Charbel,
“Current management of intraventricular hemorrhage,”
Surg. Neurol., 60 15
–22
(2003). 0090-3019 Google Scholar
G. Sinson,
“Intraoperative endovascular surgery for cerebral aneurysms,”
J. Neurosurg., 84 63
–70
(1996). 0022-3085 Google Scholar
P. M. Black,
T. Moriarty,
E. Alexander,
P. Stieg,
E. J. Woodard,
P. L. Gleason,
C. H. Martin,
R. Kikinis,
R. B. Schwartz, and
F. A. Jolesz,
“Development and implementation of intraoperative magnetic resonance imaging and its neurosurgical applications,”
Neurosurgery, 41 831
–842
(1997). 0148-396X Google Scholar
W. A. Hall,
H. Y. Liu, and
C. L. Truwit,
“Functional magnetic resonance imaging-guided resection of low-grade gliomas,”
Surg. Neurol., 64 20
–27
(2005). 0090-3019 Google Scholar
C. Schwindack,
E. Siminotto,
M. Meyer,
A. McNamara,
I. Marshall,
J. M. Wardlaw, and
I. R. Whittle,
“Real-time functional magnetic resonance imaging (rt-fMRI) in patients with brain tumours: Preliminary findings using motor and language paradigms,”
Br. J. Neurosurg., 19 25
–32
(2005). 0268-8697 Google Scholar
S. A. Boppart,
M. E. Brezinski,
C. Pitris, and
J. G. Fujimoto,
“Optical coherence tomography for neurosurgical imaging of human intracortical melanoma,”
Neurosurgery, 43 834
–841
(1998). 0148-396X Google Scholar
K. Bizheva,
A. Unterhuber,
B. Hermann,
B. Povazay,
H. Sattmann,
A. F. Fercher,
W. Drexler,
M. Preusser,
H. Budka,
A. Stingl, and
T. Le,
“Imaging ex vivo healthy and pathological human brain tissue with ultra-high-resolution optical coherence tomography,”
J. Biomed. Opt., 10
(2005). 1083-3668 Google Scholar
W. Hamel,
U. Fietzek,
A. Morsnowski,
B. Schrader,
J. Herzog,
D. Weinert,
G. Pfister,
D. Muller,
J. Volkmann,
G. Deuschl, and
H. M. Mehdorn,
“Deep brain stimulation of the subthalamic nucleus in Parkinson’s disease: evaluation of active electrode contacts,”
J. Neurol., Neurosurg. Psychiatry, 74 1036
–1046
(2003). https://doi.org/10.1136/jnnp.74.8.1036 0022-3050 Google Scholar
M. S. Jafri,
S. Farhang,
R. S. Tang,
N. Desai,
P. S. Fishman,
R. G. Rohwer,
C. M. Tang, and
J. M. Schmitt,
“Optical coherence tomography in the diagnosis and treatment of neurological disorders,”
J. Biomed. Opt., 10
(2005). 1083-3668 Google Scholar
|
||||||||||||||||||||||||||||||||||||||||||||||||||||||||||||||||||||||||||||||||||||||||||||||||||||||||||||||||||||||||||||||||||||||||||||||||||||||||||||||||||||||||||||||||||||||||||||||||||||||||||||||||||||||||||||||||||||||||||||


