
|
|
1.IntroductionCentral vision loss in wet-form age-related macular degeneration (AMD) is the leading cause of blindness in the elderly population in developed countries, and is caused by the growth of choroidal blood vessels into the normally avascular macular region of the retina. This choroidal neovascularization tends to be leaky with fluid exuded into the surrounding tissues, which adds to the vision loss. Currently, there is no cure for wet AMD, but patients do have therapeutic options: laser photocoagulation therapy, antivascular endothelial growth factor (VEGF) therapy, and photodynamic therapy.1, 2 In general, treatment is directed toward closing the blood vessels, i.e., occlusion. Laser photocoagulation therapy cauterizes blood vessels using a high intensity laser beam that causes local tissue heating. This cannot only cause collateral damage, but recurrence rates are high (up to 50%).2, 3 Photocoagulation is typically used for extrafoveal neovascularization to minimize damage to the central macula. Anti-VEGF therapy is a relatively new treatment for wet AMD using the drug (Eyetech and Pfizer, Incorporated, Cambridge, Massachusetts) but has several drawbacks. It does not stop the growth of blood vessels, but merely slows down growth, and it does not eliminate pre-existing neovasculature.1 The treatment, which is still being tested for optimal drug dose, requires direct intraocular injection, and effects beyond two years are not known.1, 4 Currently, the treatment has not shown damage to the healthy tissues surrounding the neovasculature. The standard treatment regime for wet AMD is photodynamic therapy (PDT), referred to here as one-photon excitation (OPE) PDT, using the porphyrin-based photosensitizer, (QLT Incorporated, Vancouver, British Columbia, Canada). This is activated by light and, in the presence of oxygen (Fig. 1 ), can produce apoptotic cell death within the treated tissue.5 localizes in areas of new tissue growth and therefore accumulates in the macular neovasculature in wet AMD. In practice, the patient is injected with of over a 10-min period, the drug is allowed to circulate and localize for 15-min, and the neovascular area is then treated with of 680-nm light (Fig. 2 ) for a period of .2 Although successful in closing choroidal neovasculature, it has been shown in the cynomolgus monkey model that OPE-PDT can also cause collateral damage to the retina and nearby tissue layers.6, 7 Fig. 1Jablonski diagram depicting the photophysical processes in OPE- and TPE-PDT. With Verteporfin, OPE occurs with 680-nm cw irradiation , whereas TPE is performed with pulsed laser light. After excitation in either case, the molecule relaxes radiationlessly to the lowest vibrational level of the first singlet excited state. From here, it can emit a photon (fluorescence) with an intensity maximum wavelength at or undergo intersystem crossing (ISC) into the first triplet state (more probable). From the triplet state, Verteporfin can phosphoresce , but more likely, it will nonradiatively transfer energy to convert molecular oxygen to singlet oxygen . Singlet oxygen can then activate the apoptotic cell death pathway.  Fig. 2Normalized one- (solid line) and two-photon (solid squares) absorption spectra of Verteporfin with various OPE and TPE excitation wavelengths indicated. The clinical OPE-PDT wavelength is indicated by the dashed arrow . The TPE pulsed laser light used here is indicated by the dotted arrows (at , the absorbed energy is equivalent to that from OPE at ). cw laser light used in control 2 is illustrated by the solid arrow at . Note that the cw excitation is outside Verteporfin’s single-photon absorption range.  In practice, the success of OPE-PDT is measured by the retention or gain in visual acuity and visualization of vessel leakage. These tests do not allow inspection of surrounding tissues, such as the retinal pigmented epithelium (RPE) and Bruch’s membrane, to quantify collateral damage. Human histological studies of these tissues are rare, as the treated eye must be excised to analyze damage. The first to report histological images of a human eye treated with OPE-PDT was Ghazi in 2001.8 One patient was studied and the tissue was received from a submacular membranectomy 27 days after OPE-PDT treatment. Ghazi primarily looked at structural changes in the vasculature; however, they did report structural changes in the RPE that were similar to those in untreated cases. Another important study by Schnurrbusch in 20019 looked at excised eyes from two patients who had undergone surgical extraction of the choroidal neovascularization three months after treatment with OPE-PDT. Schnurrbusch suggest that the RPE degeneration seen in these two cases could be caused by the PDT treatment, but results were inconclusive. Schlötzer-Schrehardt (2002)10 demonstrated that mild RPE detachment from Bruch’s membrane occurred after traditional OPE-PDT therapy. In this study, one eye from each of three patients with malignant melanoma of the uvea was used. The results from these studies are slightly contradictory and are not statistically relevant; however, damage to retinal tissues has been suggested. Additionally, optic nerve ischemia and retinal detachment have been observed in OPE-PDT treatment of papillary capillary hemangioma.11 We have hypothesized that two-photon excitation (TPE) PDT could be used to reduce this collateral damage, which may contribute to the need for repeated treatments in OPE-PDT for AMD and other choroidal neovascular diseases.12, 13 TPE is widely used in confocal microscopy.14 In general, it requires high fluxes of light that can be delivered using ultrafast pulsed and focused laser beams, usually in the near-infrared range (NIR, to ). TPE-PDT has the potential to eliminate the collateral damage in treating AMD, due to the limited focal volume that is excited. The probability of a molecule absorbing two photons simultaneously (each half the energy, i.e., twice the wavelength as in OPE) is extremely small and is proportional to the square of the light intensity. This process occurs only at the focal plane of a tightly focused laser beam, with focal volumes of a few femtoliters (defined by of the maximum intensity for a Gaussian beam), using a high numerical aperture lens .15 This highly confined TPE focal volume allows, in principle, selective activation of photosensitizer within the neovasculature, leaving over- and underlying tissues unaffected, even if they contain photosensitizer. There are a number of reports of TPE of photosensitizing drugs, including Photofrin, protoporphyrin IX (PpIX), psoralens, Rose Bengal, hematoporphyrin derivative (HPD), hypocrellins, and Verteporfin (the active ingredient in ). 13, 16, 17, 18, 19, 20, 21, 22, 23, 24, 25 We have confirmed using Verteporfin that, as would be expected, the photophysical processes remain the same after the molecule has reached its first excited state (Fig. 1), regardless of whether excitation occurs through one- or two-photon absorption.13, 25 Verteporfin has a larger two-photon cross section ( units at , where GM is units of Goppert-Meyer and ) compared to other clinical photosensitizers such as ( units at ).12, 24, 26 At , the wavelength used here, the value is units. Its one- and two-photon excitation spectra can be seen in Fig. 2. Recently, two articles have been published by the Toronto group demonstrating TPE-PDT in vitro. Karotki (2006)24 and Khurana (2006)26 showed that TPE-PDT of rat prostrate endothelial cells using Photofrin and resulted in cell death, with being an order of magnitude more potent than Photofrin. To our knowledge, there is no published evidence for the use of TPE-PDT to completely occlude blood vessels. Blood vessel occlusion by OPE-PDT has been shown in a number of models, including chicken chorioallantoic membrane (CAM), and the retinas of monkeys, rabbits, and rats. To prove the principle of TPE-PDT for blood vessel occlusion, we have chosen the CAM model, with a number of modifications as described later.27 The CAM grows between days 3 and 12 of gestation and is used as an external lung and waste exchange system.28, 29, 30 It is a good model for wet AMD, since it has a wide range of blood vessel sizes (a few microns to several hundred microns in diameter); the vessels are undergoing rapid angiogenesis from day 5 to 9 of gestation28 and are embedded in transparent tissue similar to the retina; it has been well characterized in studies of tumor angiogenesis, 31, 32, 33, 34, 35 biosensor and detector responses,36, 37, 38 and PDT itself; 27, 39, 40, 41, 42, 43, 44, 45, 46, 47 moreover the fertilized chicken eggs are widely available and inexpensive. To further enhance its relevance to wet AMD, only the CAM arteries were used, simulating the feeder vessels that are seen in this disease. In these feeder vessels, blood flows from the choriocapillaries into the subretinal space. In the CAM model, the arteries are the vessels with blood flowing away from the body of the embryo and are the vessels of interest. The veins, with blood flowing toward the embryo, were observed but were not treated. The ex ovo CAM was used previously in our laboratory to demonstrate its feasibility as a model for AMD, and to study photosensitizer distribution and localization.27 We demonstrated that when Verteporfin was injected into the blood vessels in microliter amounts, the photosensitizer flowed through the vessels as a compact drug bolus with the leading edge remaining compact, while the trailing edge distributed monoexponentially with time. Verteporfin localized most strongly in the upper surface of the CAM (closest to the shell when in ovo), indicating a potential target for TPE-PDT treatment. Using a highly focused laser beam, we were able to demonstrate partial or complete vessel ablation (visible physical tissue damage leading to necrosis), which allowed us to create “leaky” vessels in the absence of exogenous photosensitizer. However, as the focus of this study was to demonstrate the effectiveness of the CAM, we did not study the process of TPE-PDT; nor did we see any evidence of photosensitizer-induced blood vessel occlusion, although similar laser powers were used (40 to measured as the beam entered the microscope) to those reported later. The ablation that was observed in this ex ovo model occurred when the CAM was immobilized and slightly dehydrated. Moreover, the uppermost portions of the CAM were photothermally removed as part of the procedure used to close blood vessels photothermally. In the current study, we modified the model so that TPE-PDT treatment and response assessments could be performed in ovo. In this setting, the embryo remains in the shell, reducing potential damage to the CAM, yolk, or embryo, while the egg also retains heat more easily than in the ex ovo system and the CAM stays moist longer (up to ) without external application of Ringer’s solution. The embryo also has increased viability when it remains in the shell. We present novel, proof-of-principle results for TPE-PDT using the CAM, as well as briefly describe novel handling techniques for this membrane in ovo. 2.Materials and Methods2.1.Chorioallantoic Membrane PreparationFertilized chicken eggs were obtained from a local farm (Airdrie, Alberta, Canada) and stored at for up to two weeks. They were removed from the refrigerator at required intervals, cleaned with 70% v/v ethanol, and placed in a humidified incubator for the duration of their development. The eggs were not rotated so that the position of the embryo would be known, since it always rises to the uppermost portion of the egg. The terminology for the positioning of the egg and embryo is shown in Fig. 3a . On day 4.5 of incubation, the eggs were removed from the incubator, cleaned again with 70% v/v ethanol, “candled” to check the viability of the embryo, and then windowed by first draining 3 to of albumen from the blunt end using a 20-G syringe [Fig. 3b], then rotating the egg so that the embryo was temporarily on the bottom side [Fig. 3c]. Cellulose tape was used to cover the top side of the shell and a hole was cut using small dissecting scissors [Fig. 3c]. The window was then covered with cellulose tape and the egg returned to the incubator until experimentation on day 8 or 9 [Fig. 3d]. The embryo naturally rises to the top, windowed side of the egg, within minutes to hours. Fig. 3Illustration of the terminology and procedure for windowing the side of an egg to use in in ovo experiments. The terminology for the in ovo embryo is described in (a). The blunt end refers to the end of the egg with the lower radius of curvature and can be visualized as the end with the air sac. The pointed end of the egg has a higher radius of curvature and lacks an air sac. The top side of the egg refers to the position of the embryo, as it will always move to the uppermost portion of the egg. The bottom side of the egg refers to the portion of the shell directly across from the embryo. Incubation and experimentation were performed with the horizontal axis parallel to the ground. The preparation of the egg is shown in (a), (c), and (d) and described fully in Sec. 2.1.  On the day of experimentation, the egg was removed from the incubator, the cellulose tape was discarded, and the window widened by cutting away more shell, if necessary. The CAM remained sufficiently moist if the treatment procedure was kept under . After treatment was completed, the window could be covered again with fresh cellulose tape and the egg returned to the incubator for observation. 2.2.Photosensitizer Preparation and AdministrationA stock solution of Verteporfin (QLT Incorporated, Vancouver, British Columbia, Canada) was prepared by dissolving the lyophilized powder in dimethyl sulfoxide (Sigma, USA), as suggested by QLT Incorporated for optimum solubility and storage. The concentration was determined spectrophotometrically ( , ). Although dimethyl sulfoxide is used as a stock solution solvent, it is inappropriate to use large amounts of it when injecting into the CAM. Therefore, a liposomal injectate, 0.01-mg/mL Verteporfin to 1.0-mg/mL dioleoyl-phosphatidylcholine (DOPC), was designed to optimize the solubility of Verteporfin and vesicle size and function, while maintaining endogenous components. The injectate was prepared as follows. DOPC in chloroform (25 mg/mL; Avanti Lipids, USA) was added to a glass vial and the chloroform was evaporated off under a gentle stream of nitrogen gas. Verteporfin and phosphate buffer ( , pH 7.0) were then added and stirred for to resuspend the dried lipid. Lipid vesicles were formed by subjecting the Verteporfin-lipid solution to 10-min intervals of stirring and sonication in the dark until the solution cleared. We have previously shown that this protocol produces small unilamellar vesicles (SUVs) and some small multilamellar vesicles (SMVs, ).48 These solutions could be kept in the refrigerator for up to one week, with sonication on reuse to disperse any large aggregates. The liposomal solutions were filtered before use with a hydrophilic cellulose acetate syringe filter (Albet, USA) to remove dust, debris, or remaining aggregates that could potentially clog the capillary needles used for injection. 2.3.Two-Photon Excitation Photodynamic Therapy EquipmentThe TPE-PDT setup has been described previously.15, 27 Briefly, the laser beam was guided through a Zeiss objective lens with a 1.0-cm working distance and 0.4 numerical aperture. Laser intensities were measured at the back plane of the microscope. A 75% loss in intensity has been recorded through the objective lens, so the laser intensities reported have been adjusted to reflect this attenuation. Studies utilizing a Spectra Physics (Palo Alto, California) Tsunami laser ( or CW) were carried out at (Fig. 2). TPE experiments were performed with 100-fs pulse length at a repetition rate of at an average laser intensity of , for which the focal volume has previously been determined to be using fluorescence correlation spectroscopy (FCS) with streptavidin conjugated polystyrene FluoSpheres (Invitrogen, Missasauga, Canada).15 The radius of the TPE focal volume is and the height along the axis of light propagation is . The TPE focal volume was calculated using: where is the volume of a symmetrical ovoid and is . This volume is only weakly dependent on the two-photon cross section, so that the focal volume with Verteporfin volume was taken as equivalent to that measured with the FluoSpheres calibration standard.The average irradiance (average) of the TPE was calculated24 as: where is the average laser power at the sample , is the refractive index of the immersion media , is the wavelength , and is the semiaperture angle of the objective lens . From the average irradiance, the peak irradiance (peak) can be determined by assuming a Gaussian pulse shape in:where is the pulse duration [full width at half maximum (FWHM), ], and is the pulse repetition rate .Control experiments were undertaken with several different light sources. White light experiments illustrating OPE-PDT were executed with a dual-gooseneck overhead lamp ( , Mille Luce M1000, Novato, California). This light was unfocused and covered the entire surface of the CAM. Other OPE-PDT controls were performed using the previous laser system operating out of pulsed mode, such that the sample received a CW irradiation with a beam waist of , calculated from:49 The final control was undertaken with the pulsed light source without photosensitzer injection to rule out thermal effects.A microscope stage, altered to hold the eggs, was fabricated, starting from a standard Zeiss upright stage [Fig. 4a ]. A metal ring, shown in Fig. 4b, secures the egg horizontally with the window facing upward. This ring was then placed into the microscope stage. The main body of the stage allows for microinjection while observing the blood vessels through the microscope eyepiece using low intensity white light. Injection was performed while visualizing the CAM using a magnification objective lens (Zeiss). The micromanipulator and microinjection system were secured to the stage by a rigid arm that allowed the needle to move with the stage when focusing or recentering the needle or blood vessel within the field of view. Fig. 4Microscopy setup used for the CAM imaging and treatments. The upright microscope system is shown in (a). The laser beam enters through the back of the microscope and is reflected by a dichroic mirror through the objective lens and focused onto the CAM surface. The adapted stage holds the egg in a purpose-built ring shown in (b).  The injection system included an micromanipulator (MM-33: Sutter Instruments Company, Novato, California) that attaches to the stage arm [Fig. 4a]. The manual microinjector (Sutter) sits to the side of the microscope and Teflon tubing connects it to the needle, which is held in the micromanipulator by a plastic sleeve. The needles used for injection were made by pulling borosilicate glass capillaries (1.0 mm outer and 0.58 inner diameter) with a quick-fill filament (1B100F-4, World Precision Instruments Incorporated, Sarasota, Florida) using a micropipette puller (SP-30, Sutter). The tapered end of the needles were then beveled with a micropipette beveller (BV-10, Sutter) at on an optically flat abrasive plate (104D) at to achieve tips that would penetrate thicker blood vessel walls. The average outer diameter of the needle tips was . White-light images (still and video) were recorded with a digital camera (Canon PowerShot A70) through the ocular lens of the microscope before and immediately after treatment. The videos found at http://www.chem.ucalgary.ca/research/groups/dcramb appear green due to the dichroic mirror required for laser beam steering. This dichroic also enhances the image contrast between the blood vessels and the surrounding tissues. 2.4.Injection and Treatment Parameters20 eggs in total were used for the experimentations described within this article. Four studies were undertaken (TPE-PDT, and controls 1, 2, and 3), and each of these studies required five trials, with one egg/CAM used for each trial. Injections were always performed in an artery, specifically the largest feeder vessel accessible, downstream from a branch (Fig. 5 ), since, as mentioned before, the arteries are likely to best represent the feeder vessels seen in wet AMD. The diameter of these vessels was to . TPE-PDT treatment was always performed on at least the third branch (B3), as illustrated in Fig. 5. These blood vessels were approximately in diameter. For these small vessels, the laser was focused into the main blood stream for treatment. The horizontal and vertical cross sections of the focal volume relative to the treated blood vessels are illustrated in Figs. 5b and 5c. Fig. 5Illustration (not to scale) of the injection location, marked by the needle, relative to the treatment spot (a). (a) The needle was positioned on an artery feeder vessel, such that it was downstream from a branch and with the flow of blood. The injected drug flows through the feeder vessel and is carried along the branches (B1, B2, and B3). Treatment was performed on the smallest visible branch, normally B3. The dimensions of the excitation volume [faded circle (b) and faded oval (c)] relative to B3 are illustrated. The diameter of B3 is . The diameter of the TPE focal volume is (b) and its height is (c) .  For the experiments involving application of Verteporfin, of the injectate was administered over a period of several minutes, 2 to at a time, similar to the slow injection of clinically.2 Fast injection caused blood flow to cease in the vasculature directly surrounding the injection site, probably because the blood is displaced both downstream and upstream from the entry point of the needle. The TPE-PDT experiments were performed with a 780-nm pulsed laser beam at a power of and a peak intensity of for . This corresponds to an average irradiance of , a peak irradiance of , a fluence of , and . FCS was used to confirm that there was no significant broadening of the TPE focal volume as the laser beam passes through the CAM. The focal volume was first determined with Amino PEG quantum dots (Invitrogen) in water, and then measured in a blood vessel filled with the same quantum dot solution (see Appendix). The TPE-PDT treatment was repeated five times on different eggs. In each trial, only one CAM blood vessel was used. The treatment parameters and the corresponding controls are summarized in Table 1 . Evaluation of the treated area was undertaken by observation of the blood flow and the apparent structure of the blood vessels. Pre- and posttreatment photographs and videos are indicative of the vessel status. The stoppage of blood flow was used as an indicator for successful PDT, whether one- or two-photon. The validity of these evaluation techniques are discussed in the Results in Sec. 3. Table 1Summary of TPE-PDT and control experimental parameters. * indicates energy per pulse calculated from parameters provided.
3.Results and Discussion3.1.Chorioallantoic Membrane PreparationIn the past, in ovo windowing of the CAM has been performed through the blunt end of the egg, as reviewed by Richardson and Singh.35 Previous OPE-PDT studies using the CAM have utilized this technique. 39, 40, 41, 42, 43, 44, 45 In our work, the top side of the egg was windowed, such that there is a larger area of the CAM exposed [Fig. 4b]. Removing the shell from the side of the egg also removes the inner-shell membrane, reducing the risk of it adhering to the CAM and interfering with treatment. Initially, the eggs were windowed while the embryo remained at the top side. However, the CAM is quite sticky and often remains secured to the shell and, if cut or nicked, embryo viability decreases markedly. Yolk leakage also greatly reduces embryo survival.35 Therefore, the shells were always opened with the embryo in the bottom half [Fig. 3c]. Richardson and Singh35 recommend draining the albumin at day 3 or 4 and windowing between day 4 and 10. However, we have found that it is best to window the egg at day 4 to 5.5 to maximize embryo viability and surface tension of the CAM for injection. 3.2.Two-Photon Excitation Photodynamic Therapy ResponsesTPE-PDT experiments were performed with a pulsed beam (equivalent to 390-nm laser light, Fig. 2) at an intensity of and a peak intensity of for . The treatment parameters are found in Sec. 2, Materials and Methods, and summarized in Table 1. It was determined using FCS that TPE volume broadening was not occurring as the laser beam passed through the CAM. The TPE volume was first determined with amino PEG quantum dots (Invitrogen, Mississauga, Ontario, Canada) in water, and then measured in a blood vessel, filled with the same quantum dot solution. The effective TPE volume was found to be (see Appendix). The TPE-PDT treatments were successful in occluding small blood vessels in diameter in all five trials. Figure 6 shows white-light images before treatment (and injection) and immediately after treatment; preliminary results observing the blood vessels after treatment are available in the Appendix. In all cases, blood stasis (as noted in the small capillaries branching off of the treated vessel) occurred within the time span of the treatment, indicating that the irradiance required for occlusion may be less than what was used. This would have to be confirmed in separate experiments, since lower PDT doses may not induce permanent occlusion. White-light imaging was not used during the PDT irradiation to avoid causing additional light exposure, given that the light dose required for one-photon activation is orders of magnitude less than for two-photon.21 With our present experimental setup, it is virtually impossible to observe the CAM several hours posttreatment to determine whether vascular collapse has occurred. Moreover, because imaging the response after treatment with white light may cause additional OPE-PDT damage, we imaged immediately after treatment. This also allowed us to verify that the laser spot remained within the vessel of interest by visual inspection of the laser spot position on the CAM before and after treatment. In principle, movement of the embryo could cause the laser spot to shift off the blood vessel: this did not occur in any of the five trials. It is also very difficult to relocate the treatment spot at later times, given that the vessel virtually disappears in the white-light images when it becomes occluded [Fig. 6a], and also because the CAM is undergoing rapid angiogenesis. Marking the treatment area, for example using Teflon locator rings, dying the CAM, referencing shell fragments on the CAM surface, or relying on the pretreatment photographs, was attempted. Teflon rings and dying caused damage to the surrounding vasculature, so that changes solely due to TPE-PDT could not be isolated. Since the blood vessel pattern changes significantly over a few hours, identifying the treated vessel just by visual inspection was not feasible. Alternate lighting and imaging approaches to overcome this limitation and allow longer term response assessment, while still avoiding OPE-PDT artifacts, are being explored. Fig. 6A representative example of TPE-PDT response. Image (a) shows the CAM blood vessels prior to injection and irradiation (see Fig. 5 for relative focal volume spot size). The black open circle illustrates the position of the focused laser beam but is not representative of the actual spot size. The thin black arrows indicate blood flow. Image (b) shows the vessels immediately after the 5-min treatment. Blood is still flowing in surrounding vessels but has either evacuated the treated vessel (solid, bold arrow), or has stopped flowing (dashed arrow).  It is evident in Fig. 6b that the treated vessel shuts down completely: not only does the blood flow stop, but the red blood cells are completely evacuated from the treated region. (The movement of blood in surrounding vessels can be viewed with the supplementary videos provided at http://www.chem.ucalgary.ca/research/groups/dcramb). The observed emptying of blood from the vessels is similar to the findings of Lange 39 using OPE-PDT, and suggests that some level of vascular collapse has occurred; whether this is permanent occlusion has yet to be determined. In OPE-PDT, it has been shown that, in general, treated blood vessels undergo an initial period of stasis before apoptosis causes vascular collapse.5 In clinical OPE-PDT therapy for AMD, it is observed that although vascular collapse is immediate, reperfusion can occur over a period of days and weeks after treatment. The human studies conducted suggested that reperfusion occurs in vessels that were occluded, owing to a local inflammatory response, rather than directly occluded by PDT. It was also observed in clinical trials that almost all treated patients experienced a reoccurrence of some fluorescein leakage one to three months after OPE-PDT.50 However, this leakage is widely believed to be due to a recurrence of angiogenesis. Because we are observing the blood vessel closure immediately after treatment, there is some concern that the vessels have not closed permanently. Although we have demonstrated immediate occlusion by TPE-PDT, there is some evidence of partial reperfusion in the longer term (i.e., posttreatment, see Appendix). It is therefore important to address the term “immediate” when discussing the observation of vascular collapse and blood stasis caused by PDT treatment. We describe “immediate” within this work as seconds after the TPE-PDT treatment stops. Immediate stasis in a clinical sense (characterized by lack of vessel leakage) can be anywhere from several hours (i.e., 50) to one week.51 Clinically, the observation of changes in blood flow has not been documented in the time frame of a few seconds after terminating treatment. Therefore it is difficult to compare our TPE-PDT results with the clinical OPE-PDT, as the observations are on vastly different time scales. However, there is evidence in the literature that suggests OPE-PDT vessel closure, or at least stasis, can occur during blood vessel treatment and in the same time scale as described here. For instance, Li (2006)52 investigated real-time imaging of vasculature in the rat xenograft model of Dunning prostate cancer during PDT using Photofrin as the photosensitizer. Li found that although vessels had somewhat varying responses, significant decreases in blood flow (measured in vascular index) were observed with an average decrease of 76%. In some cases, complete stasis was observed without recovery up to after treatment. The vessels observed by Li 52 are four to five times larger than the ones observed in the TPE-PDT treatment described in our current study. Additionally, Lim (2006)53 observed vascular occlusion, implying stasis (from fluorescein injection), as well as complete vessel shutdown using the photosensitizer DH-I-180-3 in an EMT6 mammary tumor model. These observed vessel changes occurred on a time scale of a few minutes after treatment. In both of these cases, successful OPE-PDT treatment was reported, indicating that the results we see within seconds of terminating treatment are indicative of effective TPE-PDT. Although this is the first demonstration of complete blood vessel occlusion, there have been several other reports of TPE experiments. 13, 16, 17, 18, 23, 25, 54, 55 In particular, Karotki (2006)24 and Khurana (2006)26 measured the two-photon spectra of Verteporfin and Photofrin, and showed the quadratic dependence on TPE light dose of apoptotic cell death in a monolayer of cultured vascular endothelial cells. The corresponding treatment parameters are summarized in Table 1. Although the irradiation setup for TPE-PDT irradiation (which was done using a confocal laser-scanning microscope) was very different from that used in these CAM studies, the average and peak irradiances were of the same order of magnitude and also similar to those of King and Oh (2004),55 who reported singlet oxygen production using 5-(and 6)-chloro-methyl- , -dichlorodihydronuorescein diacetate, acetyl ester with a peak power density (or peak irradiance) of . The fluence for TPE-PDT blood vessel occlusion represents the total light dose delivered, assuming that the focal spot remains focused at the same spot on the blood vessel during treatment. However, any movement of the embryo can cause slight movements of the CAM. During these five trials, we assume that the laser spot remained somewhere within the treated vessel, because after the 5-min treatment, the laser spot was still within the blood vessel. We feel that this is a valid assumption, as any strong movement will cause the laser to wander off of the vessel, and in our experience it does not return to exactly the same location. Estimating the maximum movement to be (the diameter of the vessel) reduces the fluence to . This is also much greater than the value reported by Khurana 26 The difference is attributed to the intermittent application of light during the laser beam scanning process reported. In fact, one might expect that lower TPE-PDT dose levels are needed to kill a area of monolayer cultured cells than to close a vessel of diameter. Also, blood vessel closure occurred within the 5-min treatment, indicating the fluence may be too large (i.e., treatment time could be shortened). The pulse energy used here is lower than in some other TPE-PDT studies, e.g., to have been reported with beam waists varying from to several millimeters. 16, 17, 54, 55 However, the pulse energy does not take into account the size of the treatment (focal) volume or the laser repetition rate, and therefore is not a relevant PDT dose parameter to use in comparison to different TPE-PDT studies. Additionally, direct comparison between light dose for OPE-PDT and TPE-PDT can be misleading. Because of the miniscule cross sections for TPE, significant peak intensities are needed to drive the process. Therefore, one should consider the excitation rate of the sensitizer, instead of fluence, when comparing OPE versus TPE. As is demonstrated in the control experiments, even at high fluence, no collateral damage was observed. The measured focal volume ( , : ) for our studies fits easily within the blood vessels (Fig. 5), and the laser focal spot was focused within the upper half of the blood vessel for all experiments. The blood vessel wall is transparent and very thin compared to the height of the laser spot, and it is difficult to determine whether or not the laser spot was held directly on the blood vessel wall. However, in larger vessels the focal volume could be focused on the vessel wall to target directly the endothelial cells, as it is believed that the destruction of these cells during apoptosis is the cause for vascular collapse.5 The thickness of a blood vessel wall is typically of the blood vessel diameter,56 so that in vessels diameter, the beam could be localized within the vascular wall. In fact, a study of feeder vessel photocoagulation.57 indicated that the closure of vessels of diameter or smaller, lead to an increase in visual acuity and a reduction in choridal neovascularization (CNV) extent. However, in this study extensive collateral damage to the retina in the region of the feeder vessels was also observed. 3.3.ControlsEach of the following control exposures, summarized in Table 1, was carried out using five eggs, each CAM receiving treatment to one blood vessel. 3.3.1.Control 1: can blood vessel closure be achieved with white light?Control 1 used the same injection to determine if this was an appropriate drug dose and to provide a visual comparison for blood vessel closure in the TPE-PDT treatment. Several minutes after photosensitizer injection, the entire CAM surface was irradiated at with broad-spectrum white light from an overhead goose-neck lamp for . Images were recorded immediately after treatment ended. Control 1 (white light with Verteporfin injection, Table 1) was performed to illustrate that enough photosensitizing drug was present to induce a (single-photon) photodynamic response, and that wide-beam PDT treatment causes extensive vasculature damage, as illustrated in Fig. 7 . This was not an attempt to replicate the actual OPE-PDT treatment that occurs clinically, as the appropriate equipment (i.e., 680-nm laser) and were not available. It is evident that the OPE-PDT effect occurred strongly in the specific artery into which Verteporfin was injected, yet there was little damage to the surrounding veins, probably due simply to the dilution of the photosensitizer. Stasis can be observed throughout this entire vessel, confirming the sensitivity of these CAM vessels to Verteporfin OPE-PDT. The supplementary video shows that the blood flow essentially stopped throughout the entire artery and stasis also occurred in some of the smaller ( to diameter) directly adjacent neighboring veins, whereas the larger portions of the adjacent vein ( diameter) still maintained a constant blood flow. These results are similar to those found by Lange (2001),39 where Verteporfin was used to induce OPE-PDT in the CAM, although at much higher drug doses (2 to ) than we used here , but much lower light dose . In that study, complete vascular collapse was evidenced by the disappearance of blood vessels in the treated area. There is confirmation that stasis is being observed in the current control experiments, since in all five trials [illustrated in Figs. 7c and 7d and supplementary videos] blood flow completely ceased in small vessels (diameter ), whereas there was still some movement in vessels greater than diameter immediately after treatment. There is some evidence of the start of vascular constriction, where the blood vessels have become thinner [marked by the white arrows in Figs. 7c and 7d]. Fig. 7Representative images of control 1 (a) and (b) before and (c) and (d) immediately following treatment. (a) shows the vasculature before injection and irradiation of the entire CAM with white light. The arrows indicate the direction of blood flow in the arteries (white) and the veins (black). The white box indicates the area magnified in (b). Image (c) is after 5-min white light illumination. The artery is visibly occluded, as well as some of the small surrounding veins. Collapsed areas of the vessel are indicated by the white arrows, while the blood flow in the major veins is indicated by the thin black arrows. The white box in (c) illustrates the area magnified in (d). 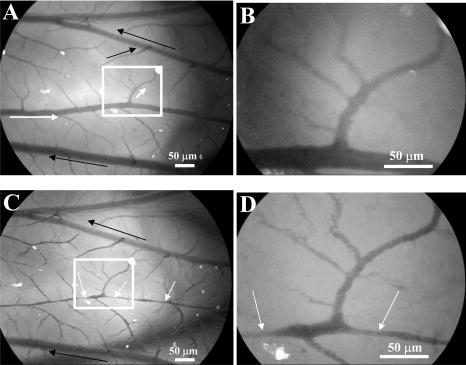 3.3.2.Control 2: does a cw laser beam cause the same blood vessel closure seen in two-photon excitation?The purpose of control 2 was to check if focused cw laser irradiation at causes the same blood vessel closure as seen in TPE with short-pulse irradiation at , i.e., is there any significant contribution from one-photon excitation at this wavelength? Treatments were performed with otherwise similar parameters ( injection, , for ). However, the effective spot sizes were not identical (1.8 and for pulsed and cw, respectively), so that the total fluences were slightly different. The peak irradiance with TPE was some 11 orders of magnitude higher than the average (constant) irradiance with cw treatment. Figure 8 shows that there was no blood vessel occlusion (or any other subocclusive responses) in any of the five cw controls, so that the responses in the TPE-PDT experiments can be attributed to two-photon activation. It should be noted that the blood slows nominally throughout treatment due to the cooling of the embryo. The slight decrease in overall vessel diameter seen in Fig. 8b is discussed next. Fig. 8Representative images of control 2 (photosensitizer cw focal 780-nm laser irradiation). Image (a) shows the CAM prior to injection and treatment, while (b) is immediately after the 5-min treatment. The thin black arrows indicate direction of blood flow, and the open circle in (a) indicates the location of the laser beam. The blood is still flowing rapidly after treatment.  3.3.3.Control 3: does a pulsed laser beam cause thermal damage to the blood vessels?The objective with control 3 was to check for any thermal effects due to the pulse-laser 780-nm irradiation, in the absence of photosensitizer. As shown in Fig. 9 and the supplementary videos, no structural damage or effect on blood flow was observed. We have shown previously that TPE-PDT ablation of CAM blood vessels could be achieved with much shorter irradiation times, using higher irradiances and burning through the upper portions of the membrane prior to ablating the blood vessel itself,27 but in that case the thermal damage was quite visible. It has recently been reported by Karotki (2006)24 that photomechanical damage in cultured endothelial cells appears at peak irradiances of about , while König, Rieman, and Fischer58 reported a threshold of . Our peak irradiance is below these threshold levels. Although the safety margin is not great, the lack of vessel closure in control 3 also suggests that there was no significant photomechanical damage. Fig. 9Representative still images of control 3 (pulsed laser irradiation, no photosensitizer). Blood is rapidly flowing in (a) the preirradiation image as well as (b) immediately postirradiation with no apparent damage to the treated vessel [indicated by the open black circle in (a)]. The bold black arrow in (b) indicates the treated vessel, which still has rapidly flowing blood running through it. The thin black arrows in each image represent the flow of blood.  We note that there was an overall decrease in vessel diameters (both treated and untreated) in Figs. 6b and 8b. Initially, we attributed this to slight PDT effects from imaging in white light, or possibly a drug response. However, because we see the same effect in the CAM with no Verteporfin injected [Fig. 9b], we performed another control (see Appendix) that illustrates that the decrease in vessel diameter is due to air exposure of the CAM, causing slight drying of the membrane and slight cooling. 4.ConclusionsThe proof-of-principle experiments presented here show that focal TPE-PDT with Verteporfin is capable of causing complete blood vessel occlusion in the chick CAM model. The experimental parameters, including wavelength, drug dose, and light dose, have not been completely optimized and this is part of ongoing work. The controls used show that the occlusion is not due to OPE-PDT or thermal damage from the pulsed laser source. Comparison to experimental OPE-PDT results found in the literature indicates that although we could not observe blood vessel closure over long periods of time, the treatment was successful. These results are encouraging for the development of TPE-PDT as a potential precise focal (e.g., feeder vessel targeted) treatment of choroidal neovascularization in wet AMD. Finally, these results suggest that with the development of better TPE-PDT sensitizers (higher TPE cross sections with good quantum yield), the treatment times and/or light doses can be decreased substantially. 5.Appendix5.1.TPE Volume MeasurementA comparison between the TPE volume in water to a blood vessel within the CAM was investigated in order to estimate treatment volume broadening due to scatter of the laser light in the CAM tissue. A solution of amino PEG quantum dots (Invitrogen, Mississauga, Canada) in water was prepared and aliquoted into a covered well slide. Using FCS, the average autocorrelation function (ACF) was collected (Fig. 10 , average of two 30-s runs). The same quantum dot solution was then injected into the CAM blood vessel. During the injection, an air bubble was introduced into the needle (and subsequently the blood vessel) before and after the quantum dot solution. This prevents movement of blood, allowing the quantum dot solution to be inside the vessel without mixing with the blood. The ACF was then collected in two blood vessels, approximately in diameter (Fig. 10). These are not the same diameter as those treated using TPE-PDT: the larger diameter and wall thickness of the vessels examined using FCS should lead to a greater broadening of the TPE volume than in the smaller PDT-treated vessels. Thus, the measurements represent the largest broadening of the TPE volume compared to water. Fig. 10Average autocorrelation functions (ACFs) for amino PEG quantum dots in water and a CAM blood vessel. The latter are noisier due to the shorter integration times.  The average ACF from water was fitted using the ACF for a single diffusing species:59, 60 where is the lag time, is the diffusion constant, is the laser beam radius at its focus, is the radius in the direction, and iswhere is Avogadro’s number, is the effective TPE volume, and represents the time-averaged concentration of quantum dots. The previously determined radius and height of the focal volume were held constant for a laser power of . The concentration and diffusion coefficient extracted from the average water ACF fit were then used to determine the TPE volume parameters for the CAM blood vessels ( and ). These results are summarized in Table 2 . The change in notable in Fig. 10 is due to a slight dilution of the dot solution upon injection. However, the decays of the ACFs are indistinguishable, confirming no change in TPE focal volume.The calculated TPE volumes for the water and blood vessel trials are the same within measurement error [ and ]. When the fitted values of the radius and height are considered, these parameters are similar for both water and the blood vessel. Identical or similar values of and are not as pertinent as the focal volume, which has much lower variance. These results indicate that there is little to no TPE focal volume broadening when irradiating through the CAM tissue. 5.2.Control 4: Why Does the Overall Diameter of the CAM Vessels Decrease Over Time?The majority of the vessels in the CAM showed a decrease in diameter over time during TPE-PDT treatment. The vessel constriction was observed for vessels with and without Verteporfin injection. This suggests that the mode for vessel shrinkage is independent of the PDT procedure. In order to illustrate this observable trend, three eggs were prepared as described in Sec. 2.1 of the article. Each of the three eggs was left open and untreated (with laser light or photosensitizer) in a darkened room for a period of . As illustrated in Fig. 11a , the images at time zero indicate a normal CAM, and the blurred look of the vessels are indicative of fast blood flow. The second image [Fig. 11b], was taken approximately later, and it is evident that the vessels have slightly decreased in diameter and the blood flow has slowed (vessels are more clearly depicted). The videos that demonstrate this slowing of blood flow can be seen with the other supplementary videos at http://www.chem.ucalgary.ca/research/groups/dcram 5.3.Preliminary TPE-PDT Responses afterIn an attempt to evaluate for long-term blood vessel occlusion, TPE-PDT, as described in Sec. 2.4, was performed on five eggs in a separate trial. Instead of imaging directly after treatment as described in Sec. 3.2, a low-intensity white light was used to verify that the laser spot had remained stationary during treatment, and the blood vessel of interest had indeed been occluded. The eggs were returned to an incubator in a darkened room to reduce exposure to light. Six hours after TPE-PDT, the treated blood vessels were observed. Of the five eggs in this trial only two were useable after incubation. At this time, it was shown that the treated vessel in one of the embryo’s CAM had partially reperfused, but blood stasis could still be observed downstream of the treatment spot (Fig. 12 and supplementary videos). In another CAM, there was also some evidence of reperfusion. Of the three remaining eggs, the original treated blood vessel could not be observed. Fig. 12Preliminary results for the long-term observation of TPE-PDT demonstrate partial vessel closure after . Image (A) is before treatment, with the open circle marking the treatment spot and the thin black arrows indicating direction of blood flow. Image (B) was taken after treatment. The solid black arrow demarks the position of the treatment spot and the dashed arrow indicates the start of blood stasis. Some reperfusion is evident in the region between the two arrows.  Table 2Summary of parameters used to determine the focal volume broadening in the CAM, measured using amino PEG quantum dots.
Note: Errors in brackets indicate the errors determined from fit. The errors indicate the parameters allowed to float, while the parameters with no reported error were fixed. Of the three other eggs, in two the feeder vessel injected into had shut down, indicating either the injection site had bled out or that a wider PDT effect had occurred from stray white light. In the remaining egg, the CAM had dried out significantly, and although blood flow in the main vessel was observed, the smaller, treated vessel could not be visualized. It is noted that these data do not provide an appropriate set of statistics to make sweeping conclusions about the whether or not the blood vessel closure using the treatment parameters described herein is transient or permanent. It has been suggested that the permanent success of PDT (marked by blood flow stasis and permanent vascular damage) is reliant on the amount of circulating photosensitizer and light dose.61 It is anticipated that permanent vessel closure will be achieved when the drug and TPE light dose has been optimized. AcknowledgmentsThis research was supported by the Natural Sciences and Engineering Council of Canada and the Canadian Institute for Photonics Innovation. Samkoe is grateful for support from eMPOWR and the Alberta Ingenuity Fund in the form of scholarships. The authors would like to enthusiastically acknowledge the support of QLT Incorporated and thank Cairine Logan (University of Calgary) for her knowledge of the chicken embryos and Bill Stell (University of Calgary) for many insightful suggestions. ReferencesH. Kourlas and
D. S. Schiller,
“Pegaptanib sodium for the treatment of neovascular age-related macular degeneration: A review,”
Clin. Ther., 28 36
–44
(2006). 0149-2918 Google Scholar
G. Soubrane and
N. M. Bressler,
“Treatment of subfoveal choroidal neovascularisation in age related macular degeneration: focus on clinical application of verteporfin photodynamic therapy,”
Br. J. Ophthamol., 85 483
–495
(2001). 0007-1161 Google Scholar
S. Harding,
“Photodynamic therapy in the treatment of subfoveal choroidal neovascularisation,”
Eye, 15 407
–412
(2001). 0950-222X Google Scholar
L. Gryziewicz,
“Regulatory aspects of drug approval for macular degeneration,”
Adv. Drug Delivery Rev., 57 2092
–2098
(2005). 0169-409X Google Scholar
U. Schmidt-Erfurth and
T. Hasan,
“Mechanisms of action of photodynamic therapy with verteporfin for the treatment of age-related macular degeneration,”
Surv. Ophthalmol., 45 195
–214
(2000). https://doi.org/10.1016/S0039-6257(00)00158-2 0039-6257 Google Scholar
M. Kramer,
J. W. Miller,
N. Michaud,
R. S. Moulton,
T. Hasan,
T. J. Flotte, and
E. S. Gragoudas,
“Liposomal benzoporphyrin derivative verteporfin photodynamic therapy—selective treatment of choroidal neovascularization in monkeys,”
Ophthalmology, 103 427
–438
(1996). 0161-6420 Google Scholar
M. H. Reinke,
C. Canakis,
D. Husain,
N. Michaud,
T. J. Flotte,
E. S. Gragoudas, and
J. W. Miller,
“Verteporfin photodynamic therapy retreatment of normal retina and choroid in the cynomolgus monkey,”
Ophthalmology, 106 1915
–1923
(1999). 0161-6420 Google Scholar
N. G. Ghazi,
N. M. Jabbour,
Z. C. De La Cruz, and
W. R. Green,
“Clinicopathologice studies of age-related macular degeneration with classic subfoveal choroidal neovasculariation treated with photodynamic therapy,”
Retina, 21 478
–486
(2001). 0275-004X Google Scholar
U. E. K. Schnurrbusch,
K. Welt,
L. C. Horn,
P. Wiedemann, and
S. Wolf,
“Histological findings of surgically excised choroidal neovascular membranes after photodynamic therapy,”
Br. J. Ophthamol., 85 1086
–1091
(2001). 0007-1161 Google Scholar
U. Schlotzer-Schrehardt,
A. Viestenz,
G. O. H. Naumann,
H. Laqua,
S. Michels, and
U. Schmidt-Erfurth,
“Dose-related structural effects of photodynamic therapy on choroidal and retinal structures of human eyes,”
Graefe's Arch. Clin. Exp. Ophthalmol., 240 748
–757
(2002). 0721-832X Google Scholar
U. M. Schmidt-Erfurth,
C. Kusserow,
I. A. Barbazetto, and
H. Laqua,
“Benefits and complications of photodynamic therapy of papillary capillary hemangiomas,”
Ophthalmology, 109 1256
–1266
(2002). 0161-6420 Google Scholar
D. T. Cramb and
R. Goyan,
“Dynamic behaviour of photosensitizers after multiphoton excitation,”
Proc. SPIE, 4262 41
–47
(2001). https://doi.org/10.1117/12.424585 0277-786X Google Scholar
R. L. Goyan and
D. T. Cramb,
“Near-infrared two-photon excitation of protoporphyrin IX: photodynamics and photoproduct generation,”
Photochem. Photobiol., 72 821
–827
(2000). https://doi.org/10.1562/0031-8655(2000)072<0821:NITPEO>2.0.CO;2 0031-8655 Google Scholar
P. T. C. So,
C. Y. Dong,
B. R. Masters, and
K. M. Berland,
“Two-photon excitation fluorescence microscopy,”
Annu. Rev. Biomed. Eng., 2 399
–429
(2000). https://doi.org/10.1146/annurev.bioeng.2.1.399 1523-9829 Google Scholar
R. Goyan,
R. Paul, and
D. T. Cramb,
“Photodynamics of latex nanospheres examined using two-photon fluorescence correlation spectroscopy,”
J. Phys. Chem. B, 105 2322
–2330
(2001). 1089-5647 Google Scholar
J. D. Bhawalkar,
N. D. Kumar,
C. F. Zhao, and
P. N. Prasad,
“Two-photon photodynamic therapy,”
J. Clin. Laser Med. Surg., 15 201
–204
(1997). 1044-5471 Google Scholar
W. G. Fisher,
W. P. Partridge,
C. Dees, and
E. A. Wachter,
“Simultaneous two-photon activation of type-I photodynamic therapy agents,”
Photochem. Photobiol., 66 141
–155
(1997). 0031-8655 Google Scholar
P. K. Frederiksen,
M. Jorgensen, and
P. R. Ogilby,
“Two-photon photosensitized production of singlet oxygen,”
J. Am. Chem. Soc., 123 1215
–1221
(2001). https://doi.org/10.1021/ja003468a 0002-7863 Google Scholar
S. Tobita,
Y. Kajii, and
K. Tanaka,
“Two-photon absorption and radiationless transitions of porphyrins,”
219
–230
(1986) Google Scholar
M. Schneider,
G. Graschew,
T. A. Roelofs,
E. Balanos,
S. Rakowsky,
H. J. Sinn, and
P. M. Schlag,
“Multiphoton excitation and photodynamic activity of macromolecular derivatized mTHPC,”
Proc. SPIE, 3909 60
–65
(2000). https://doi.org/10.1117/12.379882 0277-786X Google Scholar
S. J. Madsen,
C. H. Sun,
B. J. Tromberg,
V. P. Wallace, and
H. Hirschberg,
“Photodynamic therapy of human glioma spheroids using 5-aminolevulinic acid,”
Photochem. Photobiol., 72 128
–134
(2000). https://doi.org/10.1562/0031-8655(2000)072<0128:PTOHGS>2.0.CO;2 0031-8655 Google Scholar
J. Liu,
Y. W. Zhao,
J. Q. Zhao,
A. D. Xia,
L. J. Jiang,
S. Wu,
L. Ma, and
Y. Q. Dong,
“Two-photon excitation studies of hypocrellins for photodynamic therapy,”
J. Photochem. Photobiol., B, 68 156
–164
(2002). 1011-1344 Google Scholar
G. H. Patterson and
D. W. Piston,
“Photobleaching in two-photon excitation microscopy,”
Biophys. J., 78 2159
–2162
(2000). 0006-3495 Google Scholar
A. Karotki,
M. Khurana,
J. R. Lepock, and
B. C. Wilson,
“Simultaneous two-photon excitation of in relation to photodynamic therapy,”
Photochem. Photobiol., 82 442
–452
(2006). 0031-8655 Google Scholar
K. S. Samkoe,
M. S. Fecica,
R. L. Goyan,
J. L. Buchholz,
C. Campbell,
N. M. Kelly, and
D. T. Cramb,
“Photobleaching kinetics of optically trapped multilamellar vesicles containing verteporfin using two-photon excitation,”
Photochem. Photobiol., 82 152
–157
(2006). https://doi.org/10.1562/2005-05-28-RA-549 0031-8655 Google Scholar
M. Khurana,
A. Karotki,
H. Collins,
H. L. Anderson, and
B. C. Wilson,
“In vitro studies of the efficiency of the two-photon activation of photodynamic therapy agents,”
Proc. SPIE, 6343 634306
(2006). 0277-786X Google Scholar
K. S. Samkoe and
D. T. Cramb,
“Application of an ex ovo chicken chorioallantoic membrane model for two-photon excitation photodynamic therapy of age-related macular degeneration,”
J. Biomed. Opt., 8
(3), 410
–417
(2003). https://doi.org/10.1117/1.1577117 1083-3668 Google Scholar
P. Schlatter,
M. F. Konig,
L. M. Karlsson, and
P. H. Burri,
“Quantitative study of intussusceptive capillary growth in the chorioallantoic membrane (CAM) of the chicken embryo,”
Microvasc. Res., 54 65
–73
(1997). https://doi.org/10.1006/mvre.1997.2022 0026-2862 Google Scholar
M. E. Stewart and
A. R. Terepka,
“Transport functions of the chick chorio-allanoic membrane. I. Normal histology and evidence for active electrolyte transport from the allantoic fluid in vivo,”
Exp. Cell Res., 58 93
–106
(1969). https://doi.org/10.1016/0014-4827(69)90119-0 0014-4827 Google Scholar
A. R. Terepka,
M. E. Stewart, and
N. Merkel,
“Transport functions of the chick chorio-allantoic membrane. II. Active calcium transport in vivo,”
Exp. Cell Res., 58 107
–117
(1969). https://doi.org/10.1016/0014-4827(69)90120-7 0014-4827 Google Scholar
D. Ribatti,
B. Nico,
A. Vacca,
L. Roncali,
P. H. Burri, and
V. Djonov,
“Chorioallantoic membrane capillary bed: A useful target for studying angiogenesis and anti-angiogenesis in vivo,”
Anat. Rec., 264 317
–324
(2001). https://doi.org/10.1002/ar.10021 0003-276X Google Scholar
D. Ribatti,
D. Leali,
A. Vacca,
R. Giuliani,
A. Gualandris,
L. Roncali,
M. L. Nolli, and
M. Presta,
“In vivo angiogenic activity of urokinase: role of endogenous fibroblast growth factor-2,”
J. Cell. Sci., 112 4213
–4221
(1999). 0021-9533 Google Scholar
L. M. DeFouw and
D. O. DeFouw,
“Vascular endothelial growth factor fails to acutely modulate endothelial permeability during early angiogenesis in the chick chorioallantoic membrane,”
Microvasc. Res., 60 212
–221
(2000). 0026-2862 Google Scholar
G. Melkonian,
C. Le,
W. Zheng,
P. Talbot, and
M. Martins-Green,
“Normal patterns of angiogenesis and extracellular matrix deposition in chick chorioallantoic membranes are disrupted by mainstream and sidestream cigarette smoke,”
Toxicol. Appl. Pharmacol., 163 26
–37
(2000). 0041-008X Google Scholar
M. Richardson and
G. Singh,
“Observations on the use of the avian chorioallantoic membrane (CAM) model in investigations into angiogenesis,”
Curr. Drug Targets Cardiovas. Haematolog. Disorders, 3 155
–185
(2003). Google Scholar
U. Klueh,
D. I. Dorsky,
F. Moussy, and
D. L. Kreutzer,
“Ex ova chick chorioallantoic membrane as a novel model for evaluation of tissue responses to biomaterials and implants,”
J. Biomed. Mater. Res., 67A 838
–843
(2003). 0021-9304 Google Scholar
T. I. Valdes,
D. Kreutzer, and
F. Moussy,
“The chick chorioallantoic membrane as a novel in vivo model for the testing of biomaterials,”
J. Biomed. Mater. Res., 62 273
–282
(2002). 0021-9304 Google Scholar
T. I. Valdes,
U. Klueh,
D. Kreutzer, and
F. Moussy,
“Ex ova chick chorioallantoic membrane as a novel in vivo model for testing biosensors,”
J. Biomed. Mater. Res., 67A 215
–223
(2003). 0021-9304 Google Scholar
N. Lange,
J. P. Ballini,
G. Wagnieres, and
H. van den Bergh,
“A new drug-screening procedure for photosensitizing agents used in photodynamic therapy for CNV,”
Invest. Ophthalmol. Visual Sci., 42 38
–46
(2001). 0146-0404 Google Scholar
V. Gottfried,
R. Davidi,
C. Acerbuj, and
S. Kimel,
“In vivo damage to chorioallantoid membrane blood vessels by porphycene-induced photodynamic therapy,”
J. Photochem. Photobiol., B, 30 115
–121
(1995). https://doi.org/10.1016/1011-1344(95)07180-A 1011-1344 Google Scholar
M. J. Hammer-Wilson,
L. Akian,
J. Espinoza,
S. Kimel, and
M. W. Berns,
“Photodynamic parameters in the chick chorioallantoic membrane (CAM) bioassay for topically applied photosensitizers,”
J. Photochem. Photobiol., B, 53 44
–52
(1999). https://doi.org/10.1016/S1011-1344(99)00124-4 1011-1344 Google Scholar
R. Hornung,
M. J. Hammer-Wilson,
S. Kimel,
L. H. Liaw,
Y. Tadir, and
M. W. Berns,
“Systemic application of photosensitizers in the chick chorioallantoic membrane (CAM) model: photodynamic response of CAM vessels and 5-aminolevulinic acid uptake kinetics by transplantable tumors,”
J. Photochem. Photobiol., B, 49 41
–49
(1999). https://doi.org/10.1016/S1011-1344(99)00014-7 1011-1344 Google Scholar
W. S. L. Strauss,
R. Sailer,
H. Schneckenburger,
N. Akgun,
V. Gottfried,
L. Chetwer, and
S. Kimel,
“Photodynamic efficacy of naturally occurring porphyrins in endothelial cells in vitro and microvasculature in vivo,”
J. Photochem. Photobiol., B, 39 176
–184
(1997). https://doi.org/10.1016/S1011-1344(97)00002-X 1011-1344 Google Scholar
A. Vargas,
B. Pegaz,
E. Debefve,
Y. Konan-Kouakou,
N. Lange,
J.-P. Ballini,
H. van den Berg,
R. Gurny, and
F. Delie,
“Improved photodynamic activity of porphyrin loaded into nanoparticles: an in vivo evaluation using chick embryos,”
Int. J. Pharm., 286 131
–145
(2004). 0378-5173 Google Scholar
K. M. Kelly,
S. Kimel,
T. Smith,
A. Stacy,
M. J. Hammer-Wilson,
L. O. Svaasand, and
J. S. Nelson,
“Combined photodynamic and photothermal induced injury enhances damage to in vivo model blood vessels,”
Lasers Surg. Med., 34 407
–413
(2004). 0196-8092 Google Scholar
B. Pegaz,
E. Debefve,
J. P. Ballini,
G. Wagnieres,
S. Spaniol,
V. Albrecht,
D. V. Scheglmann,
N. E. Nifantiev,
H. van den Bergh, and
Y. Konan-Kouakou,
“Photothrombic activity of m-THPC-loaded liposomal formulations: Pre-clinical assessment on chick chorioallantoic membrane model,”
Eur. J. Pharm. Sci., 28 134
–140
(2006). 0928-0987 Google Scholar
B. Pegaz,
E. Debefve,
F. Borle,
J. P. Ballini,
G. Wagnieres,
S. Spaniol,
V. Albrecht,
D. Scheglmann,
N. E. Nifantiev,
H. van den Bergh, and
Y. N. Konan,
“Preclinical evaluation of a novel water-soluble chlorin E-6 derivative (BLC 1010) as photosensitizer for the closure of the neovessels,”
Photochem. Photobiol., 81 1505
–1510
(2005). 0031-8655 Google Scholar
Z. V. Leonenko,
A. Carnini, and
D. T. Cramb,
“Supported planar bilayer formation by vesicle fusion: the interaction of phosolipid vesicles with surfaces and the effect of gramicidin on bilayer properties using atomic force microscopy,”
Biochim. Biophys. Acta, 1509 131
–147
(2000). https://doi.org/10.1016/S0005-2736(00)00288-1 0006-3002 Google Scholar
E. Gratton,
S. Breusegem,
N. Barry,
Q. Ruan, and
J. Eid,
“Fluctuation correlation spectroscopy in cells: Determination of molecular aggregation,”
Biophotonics: Optical Science and Engineering for the Century, 1
–14 Springer, Berlin (2006). Google Scholar
U. Schmidt-Erfurth,
M. Niemeyer,
W. Geitzenauer, and
S. Michels,
“Time course and morphology of vascular effects associated with photodynamic therapy,”
Ophthalmology, 112 2061
–2069
(2005). 0161-6420 Google Scholar
U. Schmidt-Erfurth,
J. Miller,
M. Sickenberg,
A. Bunse,
H. Laqua,
E. Gragoudas,
L. Zografos,
R. Birngruber,
H. van den Bergh,
A. Strong,
U. Manjuris,
M. Fsadni,
A. M. Lane,
B. Piguet, and
N. M. Bressler,
“Photodynamic therapy of subfoveal choroidal neovascularization: Clinical and angiographic examples,”
Graefe's Arch. Clin. Exp. Ophthalmol., 236 365
–374
(1998). https://doi.org/10.1007/s004170050092 0721-832X Google Scholar
H. Li,
B. A. Standish,
A. Mariampillai,
N. R. Munce,
Y. Mao,
S. Chiu,
N. E. Marcon,
B. C. Wilson,
A. Vitkin, and
V. X. D. Yang,
“Feasibility of interstitial Doppler optical coherence tomograph for in vivo detection of microvascular changes during photodynamic therapy,”
Lasers Surg. Med., 38 754
–761
(2006). https://doi.org/10.1002/lsm.20387 0196-8092 Google Scholar
D. S. Lim,
S. H. Ko,
C. H. Lee,
W. S. Ahn, and
W. Y. Lee,
“DH-I-180-3-mediated photodynamic therapy: biodistribution and tumor vascular damage,”
Photochem. Photobiol., 82 600
–605
(2006). https://doi.org/10.1562/2005-09-13-RA-683 0031-8655 Google Scholar
M. Kruk,
A. Karotki,
M. Drobizhev,
V. Kuzmitsky,
V. Gael, and
A. Rebane,
“Two-photon absorption of tetraphenylporphin free base,”
J. Lumin., 105 45
–55
(2003). 0022-2313 Google Scholar
B. A. King and
D. H. Oh,
“Spatial control of reactive oxygen species formation in fibroblasts using two-photon excitation,”
Photochem. Photobiol., 80 1
–6
(2004). https://doi.org/10.1562/2004-03-01-RA-093.1 0031-8655 Google Scholar
K. Sandau and
H. Kurz,
“Modelling of vascular growth processes: a stochastic biophysical approach to embryonic angiogenesis,”
J. Microsc., 175 205
–213
(1994). 0022-2720 Google Scholar
G. Staurenghi,
N. Orzalesi,
A. La Capri, and
M. Ascho,
“Laser treatment of feeder vessels in subfoveal choroidal neovascular membranes: A revisitation using dynamic indocyanine green angiography,”
Ophthalmology, 105 2297
–2305
(1998). 0161-6420 Google Scholar
K. Konig,
I. Rieman, and
P. Fischer,
“Photodynamic therapy by nonresonant two-photon excitation,”
Proc. SPIE, 3592 43
–49
(1999). https://doi.org/10.1117/12.351512 0277-786X Google Scholar
P. Schwille,
“Fluorescence correlation spectroscopy and its potential for intracellular applications,”
Cell Biochem. Biophys., 34 383
–408
(2001). https://doi.org/10.1385/CBB:34:3:383 1085-9195 Google Scholar
J. L. Swift,
R. Heuff, and
D. T. Cramb,
“A two-photon excitation fluorescence cross-correlation assay for a model ligand-receptor binding system using quantum dots,”
Biophys. J, 90 1396
–1410
(2006). Google Scholar
U. Schmidt-Erfurth and
T. Hasan,
“Mechanisms of action of photodynamic therapy with verteporfin for the treatment of age-related macular degeneration,”
Survey of Ophthalmology, 45 195
–214
(2000). Google Scholar
|


