
|
|
1.IntroductionQuantitative instrumental methods offer a potentially objective means of assessing skin health that can supplement the conventional visual clinical observations. Moreover, such approaches can be used to provide early markers for tumor responses and to learn about the pathophysiology of the disease and its changes in response to treatment. Near-infrared spectroscopy (NIRS) is a noncontact and noninvasive method of monitoring changes in tissue blood volume and fractions of and Hb. NIRS interrogates blood in the capillaries, arterioles, and venules of tissue and enables direct and noninvasive measurements of the tissue oxygen saturation by examining absorption differences in the spectra of oxygen carriers, such as hemoglobin, myoglobin, and cytochrome aa3.1 The concentrations of these analytes, such as and Hb, in tissue may be used to diagnose disease and to monitor changes in various conditions.2, 3, 4 Assessing these analytes is complicated by other pigments in the skin, i.e., melanin and hemosiderin, but it is possible to correct for such pigments with NIRS. This research will address these limitations and present a method that describes quantitative changes in functional parameters. Instrumentation and techniques for spectroscopic imaging have been developed to visualize skin hemodynamics and tissue water content to test tissue viability of skin flaps.5, 6 Port-wine stains have been studied with NIRS because they are characterized by an abnormal density of blood vessels in the upper dermis.7 NIRS has been used to follow port-wine stains through laser treatment that destroys the vessels to the extent necessary to obtain normal skin coloration. Ryatt 8 used reflectance spectrophotometry to obtain indices of hemoglobin and melanin content of psoriatic lesions and adjacent clinically normal skin. Results showed that the lesional hemoglobin was 2.8 times greater than that of adjacent uninvolved skin.8 Researchers have used NIRS to diagnose acute maxillary rhinosinusitis9 and characterize the synovium of the small finger joints in both early and late rheumatoid arthritis.10 However, previous studies using NIRS have just shown relative changes in tissue oxygenation, hydration, or blood volume (i.e., increase or decrease). This study investigates the use of NIRS to assess Kaposi’s sarcoma (KS) lesions. KS is a highly vascular tumor that is a frequent cause of morbidity and mortality among people infected with acquired immunodeficiency syndrome (AIDS).11 Angiogenesis and capillary permeability play important roles in the development and progression of KS.12, 13 The most distinguishing visual characteristic of KS lesions is their color, which typically ranges from light brown to deep purple, with the latter color being the characteristic color for active lesions. Some of that color may be attributed to increased blood volume in the lesion. Visually inspecting, measuring, and palpating skin lesions have long been used to assess the course of cutaneous disease in patients with KS. However, reliable assessment of these parameters requires a highly trained evaluator and evaluations made by different observers or even by the same observer at different times can be inconsistent. Quantitative instrumental methods offer a potentially more objective means of assessing skin and lesion characteristics to supplement the visual clinical observations. NIR spectroscopy has the potential to add functional information such as tumor and tissue oxygenation and blood volume that may aid in assessing the pathogenesis of the status and changes of the tumors during drug therapy. Moreover, this approach may provide early markers for tumor responses to treatment and allow one to learn more about the pathophysiology of the disease. 2.Materials and Methods2.1.InstrumentationThe multispectral imager used in this work contains a cooled charge-coupled device (CCD) (CCD-612-TKB, Roper Scientific, Trenton, New Jersey) with a spatial resolution of pixels, and each image comprises a 16-bit digital signal. This array detector captures sequentially six images after the image-forming light is passed through a set of narrow-band interference filters (having a bandwidth of at FWHM) centered at 700, 750, 800, 850, 900, and . This filter set is located on a computer-controlled rotating filter wheel positioned in front of the camera lens used to project the image into the CCD. The schematic diagram of the imaging system is shown in Fig. 1a . The tissue is illuminated by a white-light source (Dolan-Jenner Model 180, Edmund Optics, Barrington, New Jersey), which uses a EKE quartz halogen lamp. The illumination light is transported from the control unit via a -diameter optical fiber bundle. Polarization discrimination elements were used in order to remove the specular reflection component (which contains no functional information) from the recorded image.14 Specifically, a first linear polarizer was placed at the output of the light-transporting fiber bundle after passing through a red filter ( -long wavelength pass) (FS40-NIR-I, CVI Laser, Albuquerque, New Mexico) used to protect the polarizer from excessive heating. A second linear polarizer was positioned in front of the CCD camera with its polarization orientation orthogonal to that of the illumination. Both polarizers were sheet polarizers for wavelengths 740 to [Thermo Oriel (now Newport), Stratford, Connecticut, Part #27361]. Since initially constructing the system, changes have been made in the illumination assembly to make calibration easier. The schematic of the new instrumentation is shown in Fig. 1b. In the upgraded system, the light-transporting fiber bundle was terminated with an o-ring arrangement of the fibers to achieve nearly perpendicular incidence of the light with respect to the tissue surface from the approximately angle in the original arrangement. Fig. 1(a) Schematic of the original NIR multispectral imaging system. The filter wheel in front of the CCD camera contains six filters of 700, 750, 800, 850, 900, and . (b) Schematic of upgraded NIR spectroscopy system. The light source is projected directly in front of the CCD camera so that the light shines perpendicular to the object surface.  The system is operated using a personal computer running the Windows operating system (Microsoft, Seattle, Washington) and incorporates a frame-grabber card as the data-acquisition hardware interface. Software has been developed to control the instrument driver routines for the CCD detector. The in-house software was written using LabVIEW (National Instruments, Austin, Texas), an icon-based programming language designed for instrument control applications. The software allows the user to select experimental parameters such as the CCD detector shutter exposure time. An example of the six images collected by the CCD detector is shown in the top row of Fig. 2 . The gray-scale bar shows the intensity of the reflected light, with white being a higher intensity. Images collected from the original and upgraded systems were calibrated for the light intensity, light source, and camera, and curvature corrected, as described in the following section. Fig. 2Spectral images of a normal subject’s arm at six NIR wavelengths (top row) before any calibrations and (bottom row) after intensity, source, and camera calibrations. The gray-scale bar shows the intensity of the reflected light. Note that tissue image intensity is normalized after the calibrations.  2.2.Calibrations and Curvature CorrectionThe images collected from the system were calibrated to remove all elements of bias, including light intensity variations in space, wavelength-dependent camera sensitivity, and wavelength-dependent light intensity variations of the source. First, the light intensity variations in space were calibrated by normalizing the measured reflectance from the sample to the reflectance collected from a standard reference card (Eastman Kodak, Rochester, New York). This standard reference card provides 90% reflectance for unpolarized illumination and measurement conditions. However, it is not characterized for polarization-sensitive images, which were used in these experiments. For this reason, only the spatial distribution of the intensity in the cross-polarization image of the reference card was utilized (which was normalized assuming an average peak intensity equal to 1) to correct the images for the nonuniform illumination conditions. Since these images were not used as an absolute calibration standard, the calibration procedure involved two additional steps. The next calibration step involved the correction for the wavelength-dependent sensitivity of the camera. A standard source of spectral irradiance between 250 to (Oriel Part 63358, Spectra Physics Oriel, Stratford, Connecticut) was used to determine the camera calibration curve including the CCD response and the optical elements attached. These values were then divided by the corresponding value at resulting in a normalization factor of 1 at . The results are summarized in Table 1 . The high value in Table 1 at (2.3) is mainly due to the lower transmission of the polarizer at this wavelength. On the other hand, the high value at (3.8) is due to the low sensitivity of the CCD. After each set of spectral images were normalized for the spatial variation of the illumination, they were then multiplied by the corresponding wavelength-dependent camera calibration factor. Table 1Source and camera calibration factors by wavelength.
Finally, the images have undergone a third normalization process to account for the wavelength-dependent light intensity variations of the illumination source. Images of the 90% reflectance card (also used in the first calibration step) after they were corrected for the spectral response of the camera were then used to determine the average intensity at 700, 750, 800, 850, 900, and to extract the normalization factor for each wavelength (which is also normalized to 1 at as shown in Table 1). The imaging system provides a field of view of . This differs from other approaches where pointlike detectors are used to acquire information at multiple locations. However, such an image can be analyzed to individual pixels or sets of pixels and thus treated as equivalent to a multisource, multidetector system. A set of initial and three-step calibration-corrected images are shown in Fig. 2. A major challenge when collecting images from human tissue including extremities such as arms and legs is the natural curvature. In order to remove the curvature effects in the multispectral images, a curvature removal algorithm was developed. After the three calibrations were performed on a set of images, the image was rotated to fit the primary curvature to the and axes. Then the average intensity for each column and each row was calculated, creating vertical and horizontal intensity curves, respectively. The vertical and horizontal intensity curves for each wavelength were then normalized and averaged over the utilized wavelengths. Then each pixel in the image was divided by the normalized values of the corresponding and intensity curves. This allowed the effects of the curvature in the horizontal and vertical direction to be removed, without changing the underlying hemodynamic effects. This correction assumed the primary effect in intensity came from the curvature and averaging simply removed the fluctuations. Averaging the utilized wavelengths should also improve the model as any changes in intensity due to geometry should be wavelength-independent. Visible lesion areas were disregarded for these calculations as they have intrinsically lower intensity than the surrounding tissue. In patients with nonvisible tumors, including the tumor in the analysis, did not strongly affect the results, as the primary intensity effect was curvature. 2.3.Mathematical Optical Skin ModelThis research uses a mathematical optical skin model to determine the physiological tissue parameters of interest through a best-fit multivariate analysis. The light passes through the epidermis layer, diffusely reflects through the dermis layer, passes again through the epidermis layer, and is detected by the CCD camera. This yields the following general mathematical optical skin model equation: where is the wavelength (i.e., 700, 750, 800, 850, 900, and ), is the detected intensity at each pixel for each wavelength, is the combined calibration factor for each wavelength (see column 4 in Table 1), is the scaling factor, is the attenuation of the light intensity after passing through the epidermis for each wavelength, and is the attenuation of the light intensity after diffusely reflecting through the dermis layer for each wavelength. The epidermis takes melanin into account and the dermis includes the contributions from blood volume and blood oxygenation.2.3.1.Epidermis layerThe effect of the thin epidermis layer on the intensity of the diffusely reflected light is based on the volume fraction of melanin in the epidermis and the epidermal thickness.15 The effective attenuation of light through the epidermis, , can be determined by Beer’s law, giving: where is the wavelength [nm], is the epidermis absorption coefficient , and is the thickness of the epidermis [mm]. The epidermis absorption coefficient, , depends on the percent of melanin in the skin and is given by:where is the volume fraction of melanin depending on the complexion of the skin, is the melanin absorption coefficient , and is the absorption coefficient of normal skin excluding melanin (baseline) . For the results in this paper, previously reported values for 16 and 17 have been used (see Table 2 ). The remaining variable is the volume fraction of melanin in the epidermis, . The absorption coefficient for normal skin was considered the same for the epidermis and dermis layers. This model does not consider epidermal scattering because the probability of one scattering event in an epidermis of is very small (less than 5%).Table 2Optical properties used in the mathematical skin model.
2.3.2.Dermis layerThe influence of the much thicker, highly scattering dermis layer on the skin reflectance is estimated by a stochastic model of photon migration, e.g., random-walk theory. Given the known random-walk expression for diffuse reflectivity, of a semi-infinite medium with absorbing boundary and no index mismatch18: where is the ratio of absorption and scattering coefficients . To simplify computations, Eq. 4, as a function of , has been fitted by a power law plus constant. It was shown that for reasonable values of optical parameters of tissues in the red/near-infrared spectral range , Eq. 4 is well approximated by:In case of the dermis, , where and are the reduced scattering and absorption coefficients of the dermis, respectively. Plugging into Eq. 5 yields the equation for the dermis attenuation used in Eq. 1:The dermis absorption coefficient depends on the volume fraction of blood in the tissue and the percent of that blood that is oxygenated (relative fractions of and Hb in the blood). The dermis absorption coefficient is calculated by:where is the volume fraction of blood in the dermis layer and is the absorption coefficient of skin . The absorption coefficient of whole blood is calculated as :where is the fraction of blood that is oxygenated, is the absorption coefficient of , and is the absorption coefficient of Hb. For and , previously published values were used.19 The reduced scattering coefficient, , is calculated by combining 40% Mie and 60% Rayleigh scattering components given by20: These percentages for Mie and Rayleigh scattering components gave reasonable results when analyzing tissue from normal subjects. The wavelength dependence of the reduced scattering coefficient obtained from Eqs. 9, 10 is shown in Table 2. This combination represents the distribution of sizes of different types of scatterers in tissue, from granules to cells. Other analytes such as hemosiderin, iron deposits created after hemoglobin is degraded, may be added into the model in the future.2.3.3.AnalysisThe sampling volume, considered to be the area of tissue that affects the light absorption and reflectance, is larger than the individual pixel on the surface of the skin. Each image pixel is affected by the surrounding tissue and therefore the reconstructed images of blood volume and blood oxygenation are averages of the sampling volume and are influenced by the tissue surrounding that area. The sampling volume also depends on the penetration depth of the near-infrared light source. Preliminary Monte-Carlo simulations of the multispectral system and skin model have been run to determine the maximum penetration depth. The volume visited by the photons depends on the wavelength. Moreover, seems to be the limit of the photon penetration for the theoretical instrumental setup, i.e., the photons mainly remain in the epidermal and dermal layer. It is interesting to notice that the voxels “visited” by the photons appear to be situated vertically and symmetrically under the detection pixel. In practice, this means that an image formed at the skin surface should carry information concerning the tissue mainly situated under each pixel. Equation 1 also contains a scaling factor required to balance the two sides of the equation. This scale factor varies between and among subjects, but a standardized equation has been developed: where is the scaling factor and is the average intensity of a region of interest from the wavelengths of interest. The scale factor has a linear relationship with the calibrated intensity averaged across the four wavelengths (Fig. 3 ). This equation was developed by analyzing normal subject data where reasonable values of tissue oxygenation and blood volume based on published data were calculated.Fig. 3Fit of the standardized scaling factor that is used in Eq. 1 . This factor is different for each person and each visit. Each point on the graph indicates a normal subject with reasonable values of tissue oxygenation and blood volume based on published data.  A nonlinear fit of the calibrated intensity of each pixel to the attenuation of light through both layers of the mathematical optical model is performed using the Levenberg-Marquardt algorithm. For each pixel, four equations are created, one per wavelength at 700, 750, 800, and , of Eq. 1. By inserting Eqs. 2, 3, 6, 7, 8, 9, 10 into Eq. 1, four unknown physiological parameters can be solved for , , , and . The multispectral imaging system has the capability to use six wavelength images and solve for two additional parameters. In future studies, when the 900- and images are used, one must account for the absorption of water and lipids in the model and consider their volumes as variables. For this research, was considered to be based on previous research.21 The value of was considered constant for each subject based on the range published by Jacques for different skin types.20 Performing a best-fit analysis of this set of equations allows us to solve for oxygenated hemoglobin and tissue blood volume. The spatial map of oxygenated hemoglobin obtained from this analysis presents the fraction of blood in a given volume of tissue that is oxygenated. The values can range from zero to one. For example, a value of 0.80 means that the blood in a specific area of tissue is 80% oxygenated. Similarly, the spatial map of blood volume shows the fraction of blood in the tissue sampling volume (it can also vary between zero and one). For example, a value of 0.05 means that the sampled volume of tissue contains 5% blood. 2.4.Laser Doppler Imaging (LDI)This study combines multispectral imaging and laser Doppler imaging (LDI) to determine changes in blood volume, oxygenation state, and blood velocity of the microvasculature. Using both imaging modalities provides a detailed analysis of tissue function that can be assessed as a possible predictive tool for the outcome and individualization of therapeutic strategies. LDI enables noninvasive analysis of blood flow patterns in skin up to an approximate depth of . We used a dual-wavelength (MoorLDI, Moor Instrument, Inc., United Kingdom) imager for simultaneous scanning at two wavelengths, (visible red) and (NIR) with spatial resolution of approximately for assessing blood flow from differing microvascular beds.22 LDI produces a two-dimensional image of tissue blood perfusion by scanning a low-power solid-state laser beam ( helium-neon) over the tissue of interest. The light is scattered by moving red blood cells, and LDI measures the Doppler shift due to this movement. The output of LDI commonly used to describe blood flow measurement is “flux”: a quantity proportional to the product of the average speed of the blood cells (often referred to a blood velocity) and their number concentration (referred to as blood volume). LDI more directly measures the blood perfusion of small blood vessels in tissue, which generally increases as the blood supply increases during angiogenesis.23, 24 3.Results and Discussion3.1.Normal SubjectsTo quantify possible changes in physiological parameters due to disease presence/progression, a preliminary study of healthy subjects is required. A clinical protocol was approved by the institutional review board of the National Institute of Child Health and Human Development to study healthy tissue, and all subjects gave informed consent. Twelve healthy subjects were studied during the following experiments. One of the first experiments we conducted compared a similar area on both arms of the same healthy subject (Figs. 4 and 5 ). The first column of both figures shows two images collected from the multispectral imaging system of the left and right forearm of the same subject. The second and third columns show the reconstructed images presenting the fractions of and , respectively, of similar areas on the left and right forearm of one subject. Observed values of oxygenated hemoglobin in both figures are lower than 0.6, corresponding to blood oxygenation below 60%. Similarly, values of blood volume are lower than 0.2, corresponding to blood of less than 20% per sampling volume. Both figures shows an average value of 0.07 for the background skin blood volume, meaning that each tissue sampling volume contains an average of 7% blood, which is close to agreement with the range given by Jacques of 0.2–5%.20 Interestingly, a higher blood volume was observed in the vasculature compared to the surrounding tissue. The blood vessels detected by this technique are veins and arteries. Also, a higher percentage of appears in the vasculature compared to the surrounding tissue, showing an average of approximately 47% oxygenated hemoglobin in the sampled tissue volume. The images also show consistent percentages of oxygenated hemoglobin and volume of blood in the vasculature and surrounding tissue on both arms. Fig. 4Images comparing a normal subject’s left and right forearm. Column 1 shows the calibrated multispectral images collected from the system of each forearm. Column 2 shows the spatial maps of blood volume and oxygenated hemoglobin that were reconstructed from the set of NIR spectral images. Note that both arms show similar quantitative values for oxygenated hemoglobin and blood volume.  Fig. 5Images comparing a normal subject’s left and right forearm. Column 1 shows the calibrated multispectral images collected from the system of each forearm. Column 2 shows the spatial maps of blood volume and oxygenated hemoglobin that were reconstructed from the set of NIR spectral images. Note that both arms show similar quantitative values for oxygenated hemoglobin and blood volume.  The next study followed healthy subjects through reactive hyperemia. A pressure cuff was inflated around the subject’s upper arm to induce temporary ischemia, which was relieved after several minutes. Spectroscopic image sets were taken every at different time points: before the occlusion , during the occlusion (0.5 to ), and after the occlusion was released (5.5 to ). An example of these changes is presented in Fig. 6 at three time points: before the occlusion, after of occlusion, and after the occlusion was released. The pairs of spectroscopic images illustrate the changes in the distributions of oxygenated hemoglobin and blood volume fractions, reconstructed from these data sets. The tissue around the vasculature appears substantially more deoxygenated during the occlusion episode than afterward. In the bottom row of Fig. 6, the skin shows a slight increase in background blood volume during the occlusion period. This follows previous results showing that during an occlusion, there will be an increase in blood volume and a decrease in oxygenated hemoglobin.25, 26, 27 When the occlusion was released, the oxygenated hemoglobin increased past the baseline and then returned to the baseline following several minutes. Fig. 6Experiment showing (top row) oxygenated hemoglobin and (bottom row) blood volume during occlusion showing reactive hyperemia: (a) , (b) after of occlusion, and (c) after releasing occlusion. During the occlusion, decreased and then when the occlusion was released, increased above the initial state. A slight increase in was seen after a occlusion period.  Additional reactive hyperemia experiments were conducted on healthy subjects in a more longitudinal manner. Figure 7 shows the results of two visits by one healthy subject. Similar patterns of changes in and during the experiments can be seen. In addition, similar values of initial blood volume and oxygenated hemoglobin in the vasculature and surrounding tissue were observed. This experiment helps to show the stability of the system and the reconstruction algorithm. In general, spectroscopic images allow us to quantify circulatory changes of the skin in time to study physiological variations in different tissue locations. Fig. 7Experiment showing oxygenated hemoglobin and blood volume during occlusion showing reactive hyperemia for the same subject on two visits (top row is visit 1 and bottom row is visit 2). (Bottom row) visit 2: (a) at , (b) after of occlusion, (c) after releasing occlusion, (d) at , (e) after of occlusion, and (f) after releasing occlusion. During the occlusion, decreased and then when the occlusion was released, increased above the initial state. A slight increase in was seen after a occlusion period and decreased toward the initial state after releasing the occlusion.  3.2.Kaposi’s Sarcoma SubjectsTo study diseased tissue, clinical protocols were approved by the institutional review board of the National Cancer Institute to study subjects with Kaposi’s sarcoma lesions. Written consent was obtained from all subjects and lesions were considered for measurement if they were at least in diameter. Immediately prior to imaging, each patient removed sufficient garments and accessories to expose the entire area to be recorded including the contralateral side. Prior to and during imaging, the subjects were seated at rest in a closed room around . Figure 8 shows a set of comparative images from one visit of a Kaposi’s sarcoma subject. The digital image in the top left shows the visible location of the surface lesion; however, the noninvasive imaging techniques show additional information about the lesion and its vasculature. To allow the visualization of the lesion in each modality image, a black line marks the location of the lesion based on the digital camera image. One should note the presence of a vasculature network surrounding the tumor. The average oxygenation of veins in the bottom left image corresponds to the known value of approximately 47%. There is increased blood flux (top right), blood volume (bottom right), and fraction of (bottom left) in the lesion compared to the surrounding tissue. Fig. 8Images of Kaposi’s sarcoma subject on entry onto drug treatment protocol: (top left) digital image; (top right) laser Doppler image showing blood flux; (bottom left) reconstructed map of fraction of oxygenated hemoglobin; and (bottom right) reconstructed map of fraction of blood in tissue. There is increased blood flux, blood volume, and fraction of in the lesion compared to the surrounding tissue.  To date, more than 30 patients have been studied at entry onto treatment protocols of several experimental therapies. The overall clinical response of KS to this treatment regimen was assessed using a minor modification of the AIDS Clinical Treatment Group (ACTG) KS parameters as previously published.28, 29 In short, responses were based on changes in the total number of KS lesions, the number of nodular KS lesions, the sum of the products of the larger perpendicular diameters of five representative “marker” lesions selected at entry onto the protocol, tumor-associated edema or effusions, and visceral disease. A complete response was defined as the absence of all detectable disease for at least 4 weeks with a biopsy of at least one previous representative lesion showing the absence of malignant cells. Many patients that did not experience a positive response on one therapy tried a different one. Figure 9 shows a set of comparative images of a KS patient undergoing an experimental drug therapy. It is important to note that as this patient returned for subsequent visits, the clinical assessment was stable disease. After 3 weeks of experimental treatment, increased blood flux and blood volume can be seen in the lesion compared to the surrounding tissue. Fig. 9Images of Kaposi’s sarcoma subject (top row) on entry onto drug treatment protocol and (bottom row) after 3 weeks of experimental therapy: (a) digital image; (b) laser Doppler image showing blood flux; (c) reconstructed map of fraction of oxygenated hemoglobin; and (d) reconstructed map of fraction of blood in tissue. The lesions appear hypoxic compared to the surrounding, but the laser Doppler and blood volume images show higher blood flux and volume in the lesions. 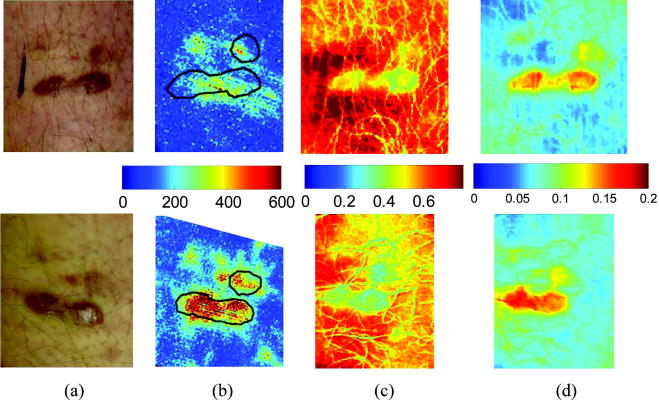 Fig. 10Images of Kaposi’s sarcoma subject receiving antiretroviral therapy (left column) upon entry onto protocol at 0 weeks and (right column) follow-up 19 weeks later: (top) digital image; (row one) reconstructed map of oxygenated hemoglobin; (row two) reconstructed map of blood volume; (row three) laser Doppler images; and (row 4) spectroscopic image showing the four ROIs used to average the oxygenated hemoglobin and blood volume outside the lesion. This patient had a clinical diagnosis of progressive disease before the follow-up visit. Decreased oxygenated hemoglobin fraction, blood volume, and blood flux in the lesion are apparent at the follow-up visit. Increased overall vasculature and oxygenated hemoglobin can be seen in the laser Doppler and oxygenated hemoglobin images at follow-up.  Table 3Quantitative results from reconstructed NIR spectroscopy images of a KS subject with progressive disease of oxygenated hemoglobin and blood volume.
A set of comparative images of a KS patient collected at baseline (0 weeks) and at follow-up (19 weeks later) is shown in Fig. 10 . The clinical assessment of this patient, who was receiving retroviral therapy only (no experimental drug therapy), was progressive disease by week 13. The images in the left column show increased and tissue blood volume fractions and blood flux values in the lesion compared to the background at baseline. Note that a ballpoint pen was used to write a number next to the lesion (here a 4). This ink appears to have low values; however, the ink pixels were not used to calibrate the image, but the ink has strong absorption properties and behaves differently than tissue in the reconstruction. It is left in the image as a visual reference for the clinician, but its values can be disregarded. Nineteen weeks later, the images in the right column show a lower fraction in the lesion compared to the background, but continue to show increased tissue blood fraction and blood flux in the lesion area compared to the background tissue. The laser Doppler images show increased blood circulation in the entire viewing area after 19 weeks. The tissue blood volume fractions were both approximately 6% in the tissue surrounding the lesion. A square region of interest (ROI) was selected inside the lesion and compared to the reference region outside the lesion. A ROI of pixels was chosen inside the lesion (unless the lesion was smaller than this and then an area of was chosen). The four pixel ROIs chosen as the reference regions and averaged together are shown in the last row of Fig. 10. Parameter averages were calculated for both areas. Table 3 shows the quantitative results of tissue and blood volume fractions from the subject in Fig. 10. Results from this patient shows that as the disease progressed, the lesion became more hypoxic and the surrounding tissue became more oxygenated. Blood volume was fairly constant as the disease progressed. The blood flux, as shown in the laser Doppler images, shows a slight decrease inside the lesion as the disease progressed, but an increase of blood circulation in the area surrounding the lesion. A strong correlation between temperature, measured by thermal imaging, and blood velocity, as well as with blood volume, was previously found.30 Further analysis of the data we are collecting promises to further the understanding of tumor angiogenesis and the effects of experimental therapies by using multispectral imaging, LDI, and thermal imaging. 4.ConclusionsThe multispectral imaging system reconstructs images with contrast based on spatial changes in the concentrations of analytes. The results show that quantitative spectroscopic imaging can be used for dermatological examinations. Objective information on skin health is obtainable noninvasively and without skin contact, up to a depth of approximately . Quantitative tissue oxygenation and blood volume data can be provided independently, with detailed indications of variability with location, in the form of images. The quantitative reconstructed values, or contrast, have shown utility in revealing spatial patterns of analyte concentration that correlate with KS tumor regions and can be used to show informative changes indicative of patient response to therapy. Consistent with their angiogenic nature, the KS lesions studied had greater blood volume than surrounding normal tissues. However, some appeared to be relatively hypoxic compared to the surrounding tissue, while others appeared to have increased blood oxygenation. KS involves a degree of inflammation, and it is possible that the areas of increased oxygenation reflect inflammation. It will be interesting to correlate these variations with other parameters of the KS lesions in future analyses. It should be noted that these techniques involve modeling based on certain assumptions and calculations, and it may be possible to refine the techniques further as we proceed. For example, the model now does not include subcutaneous hemosiderin, and including this parameter may yield improved methodology, especially in KS lesions. Overall, multispectral imaging is a noninvasive technique that can detect the progression of disease before these changes are visibly apparent. This technique is now also being considered for use in studies of other skin characteristics, including erythema, blanching, edema, and fibrosis. Near-infrared spectroscopic imaging has potential to be the technique of choice to supplement visual examination. AcknowledgmentsThis research was funded by the Intramural Research Program of the National Institute of Child Health and Human Development and the National Cancer Institute of the National Institutes of Health. This work was also performed in part at Lawrence Livermore National Laboratory under the auspices of the U.S. department of Energy under Contract W-7405–Eng-48. The authors would also like to thank Kathleen Wyvill and Karen Aleman who assisted with the KS patient visits and Israel Gannot for his numerous useful discussions. ReferencesD. Taylor and
S. Simonson,
“Use of near-infrared spectroscopy to monitor tissue oxygenation,”
New Horiz, 4
(4), 420
–425
(1996). 1063-7389 Google Scholar
N. Kollias,
R. Gillies,
J. A. Muccini,
R. Uyeyama,
S. Phillips, and
L. Drake,
“A single parameter, oxygenated hemoglobin, can be used to quantify experimental irritant-induced inflammation,”
J. Invest. Dermatol., 104
(3), 421
–424
(1995). https://doi.org/10.1111/1523-1747.ep12666001 0022-202X Google Scholar
G. Wagnieres,
S. Cheng,
M. Zellweger,
N. Utke,
D. Braichotte,
J. P. Ballini, and
H. van den Bergh,
“An optical phantom with tissue-like properties in the visible for use in PDT and fluorescence spectroscopy,”
Phys. Med. Biol., 42 1415
–1426
(1997). https://doi.org/10.1088/0031-9155/42/7/014 0031-9155 Google Scholar
N. Shah,
A. Cerussi,
C. Eker,
J. Espinoza,
J. Butler,
J. Fishkin,
R. Hornung, and
B. Tromberg,
“Noninvasive functional optical spectroscopy of human breast tissue,”
Proc. Natl. Acad. Sci. U.S.A., 98
(8), 4420
–4425
(2001). https://doi.org/10.1073/pnas.071511098 0027-8424 Google Scholar
M. F. Stranc,
M. G. Sowa,
B. Abdulrauf, and
H. H. Mantsch,
“Assessment of tissue viability using near-infrared spectroscopy,”
Br. J. Plast. Surg., 51 210
–217
(1998). 0007-1226 Google Scholar
M. Attas,
M. Hewko,
J. Payette,
T. Posthumus,
M. Sowa, and
H. Mantsch,
“Visualization of cutaneous hemoglobin oxygenation and skin hydration using near-infrared spectroscopic imaging,”
Skin Res. Technol., 7 238
–245
(2001). 0909-752X Google Scholar
L. O. Svaasand,
L. T. Norvang,
E. J. Fiskerstrand,
E. K. S. Stopps,
M. W. Berns, and
J. S. Nelson,
“Tissue parameters determining the visual appearance of normal skin and port-wine stains,”
Lasers Med. Sci., 10 55
–65
(1995). 0268-8921 Google Scholar
K. Ryatt,
J. Feather,
J. Dawson, and
J. Cotterill,
“The usefulness of reflectance spectrophotometric measurements during psoralens and ultraviolet A therapy for psoriasis,”
J. Am. Acad. Dermatol., 9
(4), 558
–562
(1983). 0190-9622 Google Scholar
C. Mansfield,
E. Attas, and
R. Gall,
“Evaluation of static thermal and near-infrared hyperspectral imaging for the diagnosis of acute maxillary rhinosinusitis,”
J. Otolaryngol., 34
(2), 99
–108
(2005). 0381-6605 Google Scholar
J. M. G. Canvin,
S. Bernatsky,
“Infrared spectroscopy: shedding light on synovitis in patients with rheumatoid arthritis,”
Rheumatology, 42 76
–82
(2003). 0080-2727 Google Scholar
R. Yarchoan,
G. Tosato, and
R. F. Little,
“Therapy insight: AIDS-related malignancies—the influence of antiviral therapy on pathogenesis and management,”
Nature Clin. Prac. Oncol., 2
(8), 406
–415
(2005). Google Scholar
E. Cornali,
C. Zietz,
“Vascular endothelial growth factor regulates angiogenesis and vascular permeability in Kaposi’s sarcoma,”
Am. J. Pathol., 149
(6), 1851
–1869
(1996). 0002-9440 Google Scholar
P. Redondo,
I. Sanchez-Carpintero,
J. Vazquez-Doval, and
E. Quintanilla,
“Classic Kaposi’s sarcoma and vascular endothelial growth factor,”
Acta Derm Venereol, 80
(3), 218
–219
(2000). 0001-5555 Google Scholar
S. Demos and
R. Alfano,
“Optical polarization imaging,”
Appl. Opt., 36 150
–155
(1997). 0003-6935 Google Scholar
S. Jacques,
J. Roman, and
K. Lee,
“Imaging superficial tissues with polarized light,”
Lasers Surg. Med., 26
(2), 119
–129
(2000). https://doi.org/10.1002/(SICI)1096-9101(2000)26:2<119::AID-LSM3>3.0.CO;2-Y 0196-8092 Google Scholar
I. V. Meglinski and
S. J. Matcher,
“Quantitative assessment of skin layers absorption and skin reflectance spectra simulation in the visible and near-infrared spectral regions,”
Physiol. Meas, 23 743
–753
(2002). 0967-3334 Google Scholar
S. L. Jacques,
“Skin optics,”
(1998) http://omlc.ogi.edu/news/jan98/skinoptics.html Google Scholar
A. H. Gandjbakhche and
G. H. Weiss,
“Random walk and diffusion-like models of photon migration in turbid media,”
Prog. Opt., XXXIV
(V), 335
–402
(1995). 0079-6638 Google Scholar
D. T. Delpy,
T. M. Cope,
P. Vanderzee,
S. Arridge,
S. Wray, and
J. Wyatt,
“Estimation of optical pathlength through tissue from direct time of fright measurement,”
Phys. Med. Biol., 33
(12), 1433
–1442
(1998). https://doi.org/10.1088/0031-9155/33/12/008 0031-9155 Google Scholar
S. L. Jacqies,
“Origins of tissue optical of tissue optical properties in the UVA, visible, and NIR Regions,”
(1996) Google Scholar
I. Nishidate,
Y. Aizu, and
H. Mishima,
“Estimation of absorbing components in a local layer embedded in the turbid media on the basis of visible and near-infrared (VIS-NIR) reflectance spectra,”
Opt. Rev., 10
(5), 427
–435
(2003). https://doi.org/10.1007/s10043-003-0427-7 1340-6000 Google Scholar
K. Wardell,
A. Jakobsson, and
G. E. Nelson,
“Laser Doppler perfusion imaging by dynamic light scattering,”
IEEE Trans. Biomed. Eng., 40
(4), 309
–316
(1993). https://doi.org/10.1109/10.222322 0018-9294 Google Scholar
J. Sorensen,
M. Bengtsson,
E. L. Malmqvist,
G. Nilsson, and
F. Sjoberg,
“Laser Doppler perfusion imager (LDPI)—for the assessment of skin blood flow changes following sympathetic blocks,”
Acta Anaesthesiol. Scand., 40
(9), 1145
–1148
(1996). 0001-5172 Google Scholar
A. Rivard,
J. E. Fabre,
“Age-dependent impairment of angiogenesis,”
Circulation, 99
(1), 111
–120
(1999). 0009-7322 Google Scholar
H. M. Kooijman,
M. T. E. Hopman,
W. N. J. M. C. Colier, J. A. van der Vliet, B. Oeseburg,
“Near infrared spectroscopy for noninvasive assessment of claudication,”
J. Surg. Res., 72 1
–7
(1997). https://doi.org/10.1006/jsre.1997.5164 0022-4804 Google Scholar
R. Kragelj,
T. Jarm,
T. Erjavec,
M. Presern-Strukelj, and
D. Miklavcic,
“Reproducibility of parameters of postocclusive reactive hyperemia measured by near infrared spectroscopy and transcutaneous oximetry,”
Ann. Biomed. Eng., 28 168
–173
(2000). https://doi.org/10.1114/1.241 0090-6964 Google Scholar
R. Kragelj,
T. Jarm, and
J. Huang,
“Parameters of postocclusive reactive hyperemia measured by near infrared spectroscopy in patients with peripheral vascular disease and in healthy volunteers,”
Ann. Biomed. Eng., 29 311
–320
(2001). https://doi.org/10.1114/1.1359451 0090-6964 Google Scholar
S. E. Krown,
M. A. Testa, D. Miklavcic,
“AIDS-related Kaposi’s sarcoma: prospective validation of the AIDS Clinical Trials Group staging classification. AIDS Clinical Trials Group Oncology Committee,”
J. Clin. Oncol., 15
(9), 3085
–3092
(1997). 0732-183X Google Scholar
R. F. Little,
K. M. Wyvill,
“Activity of thalidomide in AIDS-related Kaposi’s sarcoma,”
J. Clin. Oncol., 18
(13), 2593
–2602
(2000). 0732-183X Google Scholar
M. Hassan,
R. F. Little,
A. Vogel,
K. Aleman,
K. Wyvill, R. Yarchoan, A. H. Gandjbakhche,
“Quantitative assessment of tumor vasculature and response to therapy in Kaposi’s sarcoma using functional noninvasive imaging,”
Technol. Cancer Res. Treat., 3
(5), 451
–457
(2004). 1533-0346 Google Scholar
|
||||||||||||||||||||||||||||||||||||||||||||||||||||||||||||||||||||||||||||||||||||||


