
|
|
1.IntroductionNear-infrared fluorescence-enhanced diffuse optical tomography (fDOT) is an emerging cost-effective modality for small animal imaging.1, 2 It allows one to obtain quantitative functional measurements, and enables the three-dimensional localization of the fluorescent targeted areas. Reference 3 presents a mice carcinoma follow-up using this technique and shows that when specific cancer markers are used, cancer activity can be quantified. Masciotti present in Ref. 4 a comparison of magnetic resonance imaging (MRI) and optical techniques and highlights the benefits that one can gain from combining them, having anatomy information from one side and functional information from the other. A review of optical animal imaging techniques is done by Hielscher in Ref. 5. Namely, in the last part of the paper, fluorescence optical tomography is detailed and its interest highlighted. Compared to other functional imaging modalities such as positron emission tomography, fDOT may become easier to use and cheaper. A fDOT system has been developed in our laboratory. Our continuous-wave system allows noncontact measurements and does not require animal immersion in an optical adaptation liquid. After being injected with a cancer specific marker, the animal is scanned with near-infrared light over the lung area. The system records the outgoing transmitted and emitted fluorescence light, and then reconstructs the 3-D fluorescence map to infer cancer localization and activity. To carry out in vivo experiments on small animals, the reconstruction method must take into account heterogeneous optical properties and complex shaped object geometries. A reconstruction methodology has been developed to this effect in the laboratory.6 The developed reconstruction scheme at first corrects the light propagation model from optical heterogeneities and boundary effects by using the transmitted excitation light measurements and the description of acquisition geometry, and then reconstructs the fluorescence yield from the fluorescence light emissions, using an algebraic reconstruction technique (ART) algorithm. It exploits the fact that boundary effects can be taken into account through a model using additional attenuation around the borders.7 We briefly present in this paper the experimental setup of the system that we have developed and the associated reconstruction method. Then, experimental results obtained on heterogeneous phantoms validate the use of our system for highly heterogeneous regions inspection. The last part of the paper details a study on Swiss nude mice bearing mammary murine carcinoma to validate its use in vivo. The lungs of the different mice are inspected at different stages after the tumor implantation. We want to demonstrate that our system is capable of measuring the degree of illness of cancerous mice. 2.Experimental SetupThe experimental setup (Fig. 1 ) consists of a laser source ( , , Powertechnology), two motorized translation stages (Newport), and a cooled 12-bit CCD camera (Orca EG, Hamamatsu). The animal is positioned on a heating holder and gently maintained between two glass plates to reduce its movements. At first, a diode illumination by the sides of the animal delimits the areas in contact with the upper glass plate. Then, thanks to the motorized stages, the lung region of the animal is scanned by the laser. In this study, the excitation sources describe a regular 2-mm spaced grid ( field of view) over the mice lungs. For each source position, the CCD camera focused upon the upper glass window records at first the transmitted (excitation) images. Then a Schott high-pass RG9 filter (cutoff at ) is inserted and the fluorescence (emission) images are recorded. Characteristics of the experimental setup in terms of SNR have already been described in Ref. 6. Fig. 1Experimental setup. The tomograph is composed of a cooled CCD camera and a laser source coupled to translation stages. The system is also equipped with a FRI system and a diode lateral illumination system coupled to the mouse support.  In order to also enable fluorescence reflectance imaging (FRI) technique, our bench is also equipped with a FRI system based on LEDs . Each animal is imaged by FRI before the fDOT scan. This functionality is used in this study to assess coherence between the two imaging modes and to evaluate their respective performances. LEDs at are not available off the shelf, so we used the nearest we found, at . 3.Reconstruction MethodThe 3-D reconstruction of the fluorescence yield is achieved by using the method presented in Ref. 7. Its main interest is its ability to reconstruct the fluorescence distribution in media presenting heterogeneous optical properties and high attenuation defined by such as the lungs and to deal with complex geometries typical of small animals. The reconstruction is performed according to two successive main steps: attenuation reconstruction, then fluorescence reconstruction. The optical attenuation map is computed from the excitation measurements in an iterative four-step process:
This leads to a forward model where the Green’s functions describe the propagation of the light in a heterogeneous medium. Furthermore, as light outgoing from the object doesn’t come back, we showed that the complex geometry of the animal can be addressed in the same way through a model by adding high-attenuation material around the borders.8 As we did not immerse the mice in Intralipid, we need to estimate the 3-D locations of the projection of the detector elements onto the animal. For the mice maintained between two glass plates, this is determined by the contact points. Therefore, an illumination of the animal with LEDs from the lateral sides gives an image of the contact area between the mouse and the upper glass plate: the sides of the mouse appear bright whereas the contact area appears to be shaded [see Fig. 2a ]. A threshold is then applied to this image to select within the area defined by the scan, defined by the red rectangle in Fig. 2, the pixels belonging to the contact area (in black); see Fig. 2b. These pixels set out the subarea of the acquired images to be used for reconstructing, shown in green in Fig. 2b (color online only). Fig. 2Mouse contact area determination. (a) The diode lateral illumination image. The rectangle of the scan area is superimposed in red on the image. On this image, the mouse sides appears bright whereas the contact area appears shaded. A threshold applied to this image gives the image presented in (b) with the selected contact area in green. (Color online only.) 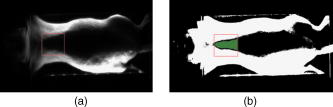 Since often only a third of the pixels in the region of interest (ROI) are in contact with the upper glass plate, the number of measurements is too restricted to allow good reconstructions. Therefore, to increase its size, the mouse surface is extrapolated by an additional surface. The equation of this surface has been empirically obtained by a matching between a function and a mouse acquired surface and is described in Ref. 9. However, to limit potential estimation discrepancies, we limit this extension with a maximum variation thickness of . Future work will deal with adding a surface laser scanner to the bench to make actual measurements of the surface and to confidently enlarge the usable region. Once this step is done, the fluorescence yield can be reconstructed from emission of fluorescent light using a classical iterative ART algorithm.10 Convergence of the algorithm is achieved within 15 iterations and a relaxation factor of 0.1. The error given by the norm has stopped its decrease. (Further iterations with this relaxation factor induce nonsignificant norm variations.) 4.Results on Phantom ExperimentsA study is conducted to verify linearity of the system with concentration and fluorophore position in depth. A glass capillary tube of in diameter is filled with different concentrations of Alexa 750 ( to in a sample of of Intralipid). To give a comparison, the concentration used for the animals is , 1% of the injected dose is targeted per gram of tumor, that is, tumor, and highly diseased lungs weigh around . The capillary is positioned successively at four different depths (0.3, 0.6, 0.9, and ) in a 1.5-cm-thick tank. The tank is filled with a diffusing medium mixture (Intralipid and ink). The concentration of the mixture has been chosen to obtain optical properties similar to the animal ones ( and ). Figure 3 shows the linearity of the system independently of the position of the capillary in depth inside the tank. The fluorescence is summed up on all the reconstructed volumes and is presented in arbitrary units. Fig. 3Curves of the reconstructed fluorescence with respect to the concentration for four different depths (0.3, 0.6, 0.9, and ) of a capillary inserted in a 1.5-cm-thick tank. Linearity of the system with respect to the fluorochrome concentration ( to ) is independent of the capillary depth.  To validate the reconstruction provided by our approach in the presence of an absorber, we designed a heterogeneous phantom. Its bulk material is composed of a mixture of epoxy resin, titanium dioxide powder for scattering material, and black ink as the absorber . It is roughly a parallelepiped, large, long, and high. An 8-mm-diameter cylinder, long, has been drilled at from the bottom, then refilled with a mixture of attenuated (black ink) and fluorescent medium (Alexa 750) and scattering material . The estimated concentration of the fluorophore is . A fluorescent inclusion (fluorescent glass fragment), of , can be positioned at the side inside this absorbing cylinder to imitate fluorescence of nodules inside a globally fluorescent absorbing medium such as diseased lungs (see Fig. 4 ). Fig. 4Phantom schema (dimensions: large, long, and high). The optical properties of the material are , for the phantom and , for the cylinder. The fluorescent inclusion positioned inside the 8-mm-diameter fluorescent absorbent cylinder is shown in red. 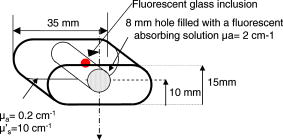 A first experiment is carried out without inclusion in the fluorescent cylinder. We compare the reconstruction using a normalized Born correction11 to the one obtained with our method. Reconstructed fluorescence volumes are presented in Fig. 5 . The cylinder is well positioned in the volume in both cases, and it is underestimated ( in diameter instead of ) in the case of the normalized Born correction [Fig. 5a]. The fluorescence map distribution is more accurate (owing to the size of the cylinder) when using our heterogeneities correction model [Fig. 5b]. Fig. 5Three-dimensional view of the reconstructed fluorescence in phantom: (a) Using a normalized Born correction approach and (b) using the heterogeneities correction model. The diameter of the fluorescent cylinder is underestimated when using a normalized Born approach. The real size and position of the cylinder is indicated in black. 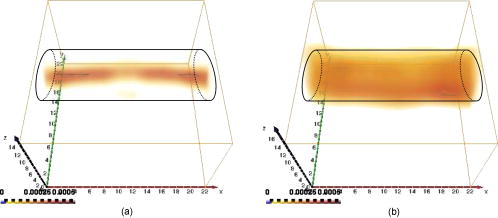 A second experiment is done while inserting a fluorescent inclusion inside the cylinder. Results are presented in Fig. 6 . Again, the size of the fluorescent cylinder is underestimated in the reconstruction using the Born ratio approach [Fig. 6a] and the fluorescent inclusion is not clearly visible, whereas the fluorescent inclusion is visible in the reconstruction using the heterogeneities correction model [Fig. 6b]. Fig. 6Three-dimensional view of the reconstructed fluorescence in phantom: (a) Using a normalized Born correction approach and (b) using the heterogeneities correction model. The fluorescent inclusion is not visible when using a normalized Born approach. The real size and position of the cylinder is indicated in black.  The paths of the light joining a source to a detector close to or inside the absorbent area are curved. With the Born ratio approach, all the light paths are straight, therefore the model is inaccurate at the border of the absorbent cylinder; this is why the fluorescence recovered by the Born ratio approach is threadlike. Our model, which takes absorption into account, allows curved light paths and leads to a more accurate reconstruction of the shape of the fluorescent area. 5.Results on In Vivo Mice Experiments5.1.ProtocolWe conducted a set of in vivo experiments on female Swiss nude mice in order to follow up the growth of mammary murine tumors at 10, 12, and 14 days after the primary tumor cells implantation ( TSA/pc cells in PBS). This delay of 10 days in the disease development was chosen after a histological study on several mice of the same model. We did not image all the mice each day (we did not know at this stage of development how the diseased mice would react to multiple injections of the fluorophore). So, on a set of seven mice, only three were imaged the first day in order to keep the others as a replacement pool. A delay of 2 days between two successive measurements was chosen because it is the necessary time for the animal to totally eliminate the fluorescent probe. All the mice came from the same animal model and had the same weight prior to the experiment. The tumor cells are injected by the tail vein (not in situ); the first organs encountered are the lungs and the cells stay fixed there. A similar study has previously been carried out on mice immersed in an optical index matching liquid.12 Here, the mouse lies on its dorsal side and is gently maintained between two glass plates and is no more immersed. To begin with, an illumination of the animal by the lateral sides gives an image of the contact area between the mouse and the upper glass plate. This image is then analyzed to determine which detector measurements are used. During reconstruction, only the detectors in contact with the animal or in the neighboring extrapolated area are considered; the other measurements (60%) are discarded. The mouse is injected with a specific marker (an intravenous injection of -Alexa700) . It has been shown that this probe targets the integrin, which is over-expressed in tumors.13, 14 Use of this probe conjugated to Cy5 fluorophore has already been published.15, 16 We have chosen Alexa 700, which is more adapted to our experimental setup. The chemistry group of LEDSS at UJF (CNRS UMR 5616 France) who developed this probe has established the conjugation. The advantage of using this probe instead of Transferrine-A750 is that it is not fixed in the liver and in that way does not interfere with the signal coming from the lungs. Then, later, the mouse is anesthetized with a warm-up gas (isoflurane/oxygen 3.5%) system (Minerve, veterinary anaesthesia and reanimation equipment manufacturer, Esternay, France) and imaged. The lung area is scanned with infrared light describing an 2-mm spaced grid and the signal acquisitions at the emission and excitation wavelengths are done. The mice are positioned to always have the same area scanned. A FRI image of the mouse is also acquired to have a fluorescence image of the whole body of the animal, and to be able to verify the consistencies between FRI and fDOT and to point out their complementarities. The results are presented as a 3-D view of the reconstructed area. The reconstructed area is a volume meshed with a 2-mm sample rate in the and directions and in the direction (depth) that leads to a size of approximately voxels and may vary slightly according to the animal thickness. Each experiment corresponds typically to 121 source positions, 1800 detector elements, and 1200 voxels. It takes on a Intel Xeon to reconstruct the fluorescence distribution. The reconstructed volumes presented below are viewed as a smooth interpolation perspective. All the reconstructions for mice are presented in the same color scale to allow level comparison. They are focused on the lung area of the animal and positioned as indicated in Fig. 7 : head of the animal at left, tail at right, front up, and back down. 5.2.Control Experiments on Healthy MiceA control experiment was conducted on a healthy mouse that was not injected with -Alexa700. In this case, the reconstruction area does not present any fluorescence. We also verified on three other healthy mice that the multiple injections of fluorophores did not induce cumulative fluorescence reconstruction as summarized in Fig. 8 . For the mouse H1 (Fig. 8, line 1), the observed fluorescence did increase from injection 1 to injection 2, but this was accounted for by an inflammation of its lungs and trachea following a capillary tube inserted for another experiment. For the mice H2 (Fig. 8, line 3) and H3 (Fig. 8, line 4), the reconstructed area presents only some slight artifacts, comparable from the first injection to the second. Fig. 8Three-dimensional view of the reconstructed fluorescence in healthy mice lungs. Three healthy mice are imaged twice, with a first then a second injection of fluorophore. Results shows that there is no increase of the fluorescence within multiple injections. Mouse H1 has also been imaged with a capillary tube in the trachea (line 2). A circle is drawn around the recovered capillary tube for this mouse, and the fluorescence did increase due to an inflammation of its lungs and trachea following the capillary tube insertion. All the volumes are presented in the same color scale to allow level comparison.  In a second experiment, mouse H1 has a capillary tube inserted in its trachea in order to verify that the expected concentration is detectable. The capillary tube was filled with a solution of Intralipid and 20 pmol Alexa 700 in . Results show that this weak concentration is detectable; see Fig. 8, line 2 where a circle is drawn around the recovered capillary tube. 5.3.Diseased MiceFigure 9 presents a summary of the different experiments conducted on diseased mice. Some of them died during the marker injection and could not be imaged until day 14. We notice that the level of fluorescence increases significantly from day 10 to day 14. This is clearly visible for mouse D1 for which we have the three measures, but also for D5 and D6. At day 14, disease has invaded all the lungs. Fig. 9Three-dimensional view of the reconstructed fluorescence in mouse lungs over days passing for seven diseased mice D1 to D7. The mice are imaged at day 10, day 12, or day 14 after the tumor implantation. All the volumes are presented in the same color scale to allow level comparison. The level of fluorescence increases significantly with the days, i.e., with the tumor stage.  For the mice imaged on day 10, the signal is globally of the same level (D1 and D2). The observed signal for D3 is greater but this mouse died the day after, confirming a higher level of cancer development. The same analysis can be done for mice imaged on day 12. D2 and D4 have a greater level of detected fluorescence and they died the day after. Figure 10 summarizes the detected fluorescence values averaged over all the voxels of the reconstructed volumes (arbitrary units). These figures confirm the qualitative analysis done on the images:
Fig. 10Average fluorescence values in the reconstructed volumes (arbitrary units). The level of fluorescence is higher for the diseased mice (D1 to D7) than for the healthy ones (H1 to H3) and than for the benchmark W. The level of fluorescence increases significantly with the tumor stage.  The superimposition of the reconstructed volumes of mouse D1 at day 10, 12, and 14 onto the white light images (Fig. 11 ) gives a better view of the scanned area and shows the progression of the cancer lung invasion. Fig. 11Three-dimensional view of the reconstructed fluorescence superimposed on the white light image for mouse D1: at (a) day 10, (b) day 12, and (c) day 14 after the tumor implantation. The increase of the fluorescence follows the development of the disease, i.e., the days after tumor implentation. 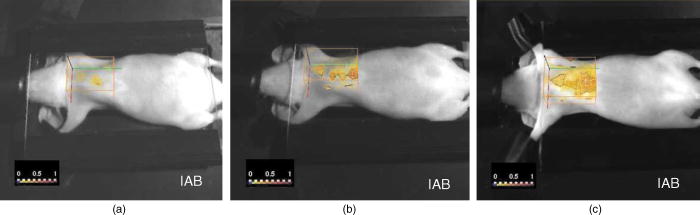 Figure 12 presents the reconstructed fluorescence in cross sections for mouse D1 at day 12 (a) and day 14 (b). The cross sections are presented from top to bottom for (animal back) to (animal front). The total thickness of this animal was when compressed. We can see the evolution of the tumors between the 2 days particularly in sections , , and . The two series of cross sections are presented in the same color map to allow comparison. The growth of some structures indicated by the arrows can be followed through the days. Fig. 12Result of reconstruction for mouse D1 at (a) day 12 and (b) day 14. cross sections are presented in the same color map from top to bottom for (animal back) to (animal front). Evolution of the tumors between the 2 days is particularly seen in sections , , and . Furthermore, some structures can be followed between these 2 days, as indicated by the arrows.  6.Comparison to FRI MeasurementsFor comparison, Fig. 13 presents the FRI images of mouse D1 at day 10, 12, and 14. The evolution of the disease cannot be seen clearly on the FRI images themselves so we performed an analysis of the images on the left and right lung regions of interest. The chosen ROI is an elliptic area centered over the lungs, of (1070 pixels) for the left lung and (1179 pixels) for the right lung, as shown superimposed in yellow on the FRI images in Fig. 13 (color online only). The ROI has been chosen in order to approximately select the lungs. The average FRI values in these ROI measured in gray levels are reported in Fig. 14 for all the mice. We notice that there is an important dispersion in the signal according to the development stage of the tumor. It is also shown that the FRI signal of the diseased mice cannot significantly be distinguished from the FRI signal of the healthy ones and that the tumor evolution can be followed up for one particular mouse (D1, for example) but not from one mouse to the other. Fig. 13FRI image for mouse D1: at (a) day 10, (b) day 12, and (c) day 14 after the tumor implantation (gray level 200–4000). The ellipsis ROI used for the FRI signal analysis is shown superimposed in yellow. No indication of the tumor growth is given by these images. (Color online only.)  Fig. 14FRI signal over the lungs according to tumor age for diseased mice D1 to D7, for healthy mice H1 to H3 at the first injection, and for the benchmark mouse W. The FRI signal of the diseased mice cannot significantly be distinguished from the FRI signal of the healthy ones. The tumor evolution can be followed up for one particular mouse (D1, for example) but not from one mouse to the other.  7.DissectionAfter having been imaged, the mice were sacrificed and dissected at day 14 or after the occurrence of their death. The lungs and heart were extracted and weighed. In the mass of cells that grows during the disease, 80% of the weight comes from the tumors and the remainder from the edema. We can observe in Fig. 15 that the three mice that died during the experiment had a higher lung weight: . As the mice had the same weight prior to the cancer implantation, the weight difference is really due to a higher cancer development and explains their early death. The other diseased mice had a lung weight of around and the healthy ones a weight of around . Figure 16 presents FRI lungs images of two dissected mice. Figure 16a is the lungs and heart FRI image of healthy mouse H3; the lungs are homogeneous and smooth. Figure 16b is the lungs and heart FRI image of diseased mouse D7. The lung structure appears crumbly, and the lung volume is higher than for the healthy mouse. The disease is visible. 8.Conclusion and DiscussionThese reconstructions and their consistency with FRI and observations on dissected animals show the usefulness of our continuous-wave fDOT system and its dedicated methodology for studying small animal lung tumor evolution. In particular, this study validates the use of our reconstruction method in body regions such as the lungs, which present especially high optical attenuation and heterogeneities. We showed that the system allows a distinction between diseased and healthy mice, and that the reconstructed fluorescence yield figures increase with the tumor development allowing a follow-up of the tumor growth on the same animal. We proved on healthy mice that successive marker injections have no incidence on the fluorescence yield reconstruction. These experiments show that fluorescence yield reconstruction gives a good quantitative indication of tumor development and is in good agreement with other information (lung weight, FRI). It allows distinction between healthy and diseased mice in vivo, whereas the current practice is dissection. The three main benefits of the 3-D reconstruction proposed here are, first, a 3-D detection of the tumors in the animal, in vivo, second, that it allows the follow-up of the tumor development on the same animal, and, third, that it allows a comparison interanimals (distinction between healthy and diseased ones). Compared to FRI, it allows the detection of deeper phenomena. This mice campaign can be used to dimension another campaign concerning a longitudinal study of cancer growth. On three mice imaged here the first day, only one survived until day 14. If we do a simple interpolation, in order to have a statistical sample of 10 animals imaged three times, we need to image 30 animals. Work in progress deals with removing the upper glass plate to obtain a real noncontact tomography system.17 The boundary of the animal will be measured by a laser scanner to allow the computation of the projections of the detectors upon it. Further problems are expected and will have to be processed: more movement (breathing and heart beats) artifacts and a significantly larger thickness limiting the light flux. In order to localize the fluorescent sources in the mouse anatomy, the matching in 3-D with the X-CT modality has been conducted with cylindrical geometry. Some results are presented in Ref. 18. Furthermore, all the 3-D analyses presented here remain global (an average of the total reconstructed fluorescence) and do not exploit all the biologically relevant information present in the reconstructions. Further work to refine the analysis needs to be carried out in collaboration with biologists to assess and to improve the relevance of all the 3-D information. For example, some deeper interpretation of the reconstructed volume taking into account the benefits of 3-D information (lung segmentation, analysis of the fluorescence position) can be done. AcknowledgmentsThis work has been partly funded by CLARA, IPA project, Emil DiMI Network of Excellence, and the RTB. ReferencesR. Weissleder and
V. Ntziachristos,
“Shedding light onto live molecular targets,”
Nat. Med., 9
(1), 123
–128
(2003). 1078-8956 Google Scholar
V. Ntziachristos,
E. A. Schellenberger,
J. Ripoll,
D. Yessayan,
E. Graves,
A. Bogdanov,
L. Josephson, and
R. Weissleder,
“Visualization of antitumor treatment by means of fluorescence molecular tomography with an annexin V-Cy5.5 conjugate,”
Proc. Natl. Acad. Sci. U.S.A., 101
(33), 12294
–12299
(2004). https://doi.org/10.1073/pnas.0401137101 0027-8424 Google Scholar
H. A. Shih,
S. D. Windsor,
R. Weissleder, and
V. Ntziachristos,
“In vivo characterization of Her-2/neu carcinogenesis in mice using fluorescence molecular tomography,”
Biomedical Optics 2006 Technical Digest, Optical Society of America, Washington, DC (2006). Google Scholar
J. Masciotti,
G. Abdoulaev,
F. Provenzano,
J. Hur,
J. Papa,
J. Bae,
J. Huang,
D. Yamashiro,
J. Kandel, and
A. Hielscher,
“Optical tomographic and magnetic resonance imaging of tumor growth and regression in mice treated with VEGF blockade,”
205
–208
(2005). Google Scholar
A. H. Hielscher,
“Optical tomographic imaging of small animals,”
Curr. Opin. Biotechnol., 16
(1), 79
–88
(2005). https://doi.org/10.1016/j.copbio.2005.01.002 0958-1669 Google Scholar
L. Hervé,
A. Koenig,
A. Da Silva,
M. Berger,
J. Boutet,
J. M. Dinten,
P. Peltié, and
P. Rizo,
“Noncontact fluorescence diffuse optical tomography of heterogeneous media,”
Appl. Opt., 46 4896
–4906
(2007). https://doi.org/10.1364/AO.46.004896 0003-6935 Google Scholar
L. Hervé,
“Fluorescence tomography enhanced by taking into account the medium heterogeneity,”
Nucl. Instrum. Methods Phys. Res. A, 571
(1–2), 60
–63
(2007). https://doi.org/10.1016/j.nima.2006.10.029 0168-9002 Google Scholar
L. Hervé,
A. Da Silva,
J. Boutet,
A. Frassati, J.-M. Dinten, P. Peltié, and
P. Rizo,
“Non contact fluorescence optical tomography by means of numerical and analytical approaches,”
Nucl. Instrum. Methods Phys. Res. A, 571
(1–2), 203
–206
(2007). https://doi.org/10.1016/j.nima.2006.10.063 0168-9002 Google Scholar
L. Hervé,
“In vivo fluorescence enhanced optical tomography reconstruction of lungs cancer of non immersed small animals,”
Proc. SPIE, 6434 643410
(2007). https://doi.org/10.1117/12.700337 0277-786X Google Scholar
S. R. Arridge,
“Optical tomography in medical imaging,”
Inverse Probl., 15 R41
–R93
(1999). https://doi.org/10.1088/0266-5611/15/2/022 0266-5611 Google Scholar
V. Ntziachristos and
R. Weissleder,
“Experimental three-dimensional fluorescence reconstruction of diffuse media using a normalized Born approximation,”
Opt. Lett., 26
(12), 893
–895
(2001). https://doi.org/10.1364/OL.26.000893 0146-9592 Google Scholar
A. Koenig,
“Whole body small animal examination with a diffuse optical tomography instrument,”
Nucl. Instrum. Methods Phys. Res. A, 571
(1–2), 56
–59
(2007). https://doi.org/10.1016/j.nima.2006.10.028 0168-9002 Google Scholar
D. Boturyn,
J. L. Coll,
E. Garanger,
M. C. Favrot, and
P. Dumy,
“Template assembled cyclopeptides as multimeric system for integrin targeting and endocytosis,”
J. Am. Chem. Soc., 126
(18), 5730
–5739
(May 2004). https://doi.org/10.1021/ja049926n 0002-7863 Google Scholar
E. Garanger,
D. Boturyn,
Z. Jin,
P. Dumy,
M. C. Favrot, and
J. L. Coll,
“New multifunctional molecular conjugate vector for targeting, imaging, and therapy of tumors,”
Mol. Imaging, 12
(6), 1168
–1175
(Dec. 2005). 1535-3508 Google Scholar
Z. H. Jin,
J. Razkin,
V. Josserand,
D. Boturyn,
A. Grichine,
I. Texier,
M. C. Favrot,
P. Dumy, and
J. L. Coll,
“In vivo noninvasive optical imaging of receptor-mediated RGD internalization using self-quenched Cy5-labeled RAFT-c(-RGDfK-)(4),”
Mol. Imaging, 6
(1), 43
–55
(2007). 1535-3508 Google Scholar
Z. H. Jin,
V. Josserand,
J. Razkin,
E. Garanger,
D. Boturyn,
M. C. Favrot,
P. Dumy, and
J. L. Coll,
“Noninvasive optical imaging of ovarian metastases using Cy5-labeled RAFT-c(-RGDfK-)4,”
Mol. Imaging, 5
(3), 188
–197
(2006). 1535-3508 Google Scholar
R. B. Schulz,
J. Ripoll, and
V. Ntziachristos,
“Experimental fluorescence tomography of tissues with noncontact measurements,”
IEEE Trans. Med. Imaging, 23
(4), 492
–500
(April 2004). https://doi.org/10.1109/TMI.2004.825633 0278-0062 Google Scholar
A. Da Silva,
T. Bordy,
M. Debourdeau,
J.-M. Dinten,
P. Peltié, and
P. Rizo,
“Whole body in vivo examination of small animals by simultaneous x-rays/optical tomography: comparison between the reconstructions obtained with different types of fluorescent labels,”
Proc. SPIE, 6629 662911
(2007). 0277-786X Google Scholar
|


