|
|
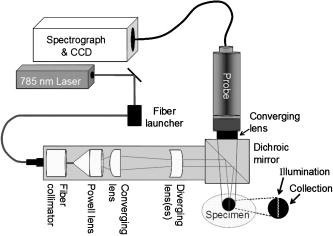
1.IntroductionRaman spectroscopy is a potential noninvasive measurement technique for longitudinal studies of bone development,1, 2 bone biomechanics3, 4, 5 in humans and in animals, and diagnosis of bone diseases.6, 7, 8, 9 To realize this potential, it is necessary to develop both spectroscopic instrumentation for transcutaneous measurements of bone tissue composition and ancillary techniques, such as optical clearing,10 that enhance the recovery of subsurface spectra. Skin presents a formidable barrier to bone Raman spectroscopy, both because the tissue, especially the stratum corneum, is highly scattering, and because melanocytes, which contain the skin pigment melanin, absorb even in the near-infrared (NIR) spectrum and fluoresce intensely. Raman spectroscopy has been used to study skin and skin diseases.11, 12, 13 To date, dermatological Raman spectroscopy has aimed primarily to measure the moisture content and drug penetration in skin at depths that do not exceed .14, 15 Similarly, arterial plaque16, 17, 18 and blood components12, 19, 20, 21 have been measured using arteries that lie close to the surface of the skin. Although it has not previously been applied to Raman spectroscopy, optical clearing is well known in other areas of biomedical optics, including NIR spectroscopy and optical coherence tomography.10, 22, 23, 24, 25 With this methodology, a liquid is used to penetrate the stratum corneum and displace the native water, because it has an index of refraction that is closer to that of proteins. Clearing agents may also disrupt the internal hydrogen bonding of collagen, which partially disorders the fibrils and increases their transparency.22, 26 The use of an optical clearing agent decreases scattering, thereby increasing light penetration into the tissue.10 Glycerol is one of the most commonly employed clearing agents. It is nontoxic, has a high index of refraction , and disrupts the internal hydrogen bonding of collagen. For these reasons, we have used glycerol in this study. With the development of spatially resolved Raman spectroscopy,27, 28 transcutaneous measurements at depths of several millimeters or greater have become feasible. In human cadaveric tissue, we have shown that transcutaneous bone Raman spectra can be obtained with a commercially available fiber optic probe that uses distributed laser power and an array of collection fibers.29, 30 Using a recently developed ring/disk probe,31, 32, 33 we have demonstrated the recovery of Raman spectra from canine bone tissue at a depth of below the skin surface.34 This work demonstrated several difficulties that must be addressed in the development of noninvasive bone Raman spectroscopy. These include a high background fluorescence, multiple scattering that is characteristic of almost all tissue,35, 36, 37 and the limitations of existing fiber optic Raman probes. In this communication we discuss the use of optical clearing to improve the Raman signal and reduce the effects of scattering. We show that a very simple protocol with glycerol as a clearing agent increases the signal-to-noise ratio and reduces the systematic error incurred as a result of incompletely resolved surface and subsurface spectra using multivariate techniques. We also demonstrate a fiber probe with line-focused laser delivery that is better suited to small animal limb studies than ring-focused probes. 2.Materials and Methods2.1.Specimens and ReagentsThe specimens used for in-vitro transcutaneous Raman measurements through skin and overlying tissue were tibiae from mice sacrificed between the ages of 12 and in the course of other unrelated studies. These mice were sacrificed according to study designs and protocols approved by the University of Michigan Committee on Use and Care of Animals. Both tibiae from healthy female animals from four randomly selected mice strains were used. The depilatory agent was Sally Hansen Hair Removal Lotion (Sally Hansen Corporation, Uniondale, New York). The optical clearing agent was American Chemical Society reagent grade glycerol (Sigma-Aldrich Corporation, Milwaukee, Wisconsin). 2.2.InstrumentationA schematic of the Raman instrument is shown in Fig. 1 . A , external cavity diode laser (Invictus, Kaiser Optical Systems, Incorporated, Ann Arbor, Michigan) was used for excitation. The laser beam was passed through a core NIR optical fiber (PCN200 4-FF-HT-GN, Multimode Fiber Optics, Hackettstown, New Jersey). The light was collimated with a fiber optic collimator (F230FC-B, Thorlabs Incorporated, Newton, New Jersey) and directed through a fan angle Powell lens/collimating optics assembly (C10, StockerYale Montreal, Quebec, Canada) and a focal length NIR coated achromat (AC254-075-B, Thorlabs Incorporated, Newton, New Jersey) to obtain a line illumination. A nonconfocal fiber optic probe (PhAT probe, Kaiser Optical Systems, Incorporated) was employed to collect backscattered Raman shifted light and present it to the spectrograph. The probe contained a circular bundle of fifty core collection fibers. At the probe head, a focal length lens was employed to obtain a -diam circular field of view. A dichroic mirror (Chroma Technology Corporation, Rockingham, Vermont) reflected the light to the sample and transmitted the Raman signal to the collection fibers. A NIR-optimized imaging spectrograph (HoloSpec f/1.8i, Kaiser Optical Systems) fitted with a slit was used to provide a spectral resolution. The detector was a thermoelectrically cooled, deep-depletion charged-coupled device (CCD) camera (DU420-BR-DD, Andor Technology, Belfast, Northern Ireland) operated at with no binning. 2.3.Spectroscopic MeasurementsTranscutaneous Raman spectroscopic measurements were made on intact, sacrificed animals. Prior to measurement, the depilatory lotion was used on the tibiae to facilitate hair removal with a tissue paper wipe from the region of interest. Excess depilatory was rinsed off with distilled water after hair removal was complete. After transcutaneous measurements, the entire tibia was excised, and overlying tissue was removed with a scalpel. The Raman spectrum of the exposed bone was then measured in the same region. Transcutaneous Raman spectra were acquired with the illumination line and the collection disk focused onto the skin at the medial side of the tibia mid-diaphysis just below the tibial proximal tuberosity. The laser line was positioned so that the long axis of the line was parallel to the bone and centered over the bone. The power of the laser light at the specimen was . The acquisition time was for transcutaneous measurements and for exposed bone measurements. For optical clearing experiments, glycerol was applied topically with a cotton swab. The glycerol was left to diffuse into the skin for approximately three minutes before spectra were acquired. For six of the tibiae, seven sequential replicate spectra were acquired prior to optical clearing. After application of glycerol and a three minute wait, seven replicate spectra were acquired in the same location. For one of the tibiae, only five measurements were taken before optical clearing, and five afterward. After the sequence of transcutaneous measurements was completed, soft tissue was removed, and 20 consecutive Raman spectra of the exposed bone were acquired. 2.4.Data AnalysisData reduction was performed in Matlab 6.1 (The Mathworks Incorporated, Natick, Massachusetts) using vendor-supplied scripts and locally written scripts that had been described previously. Statistical analyses were performed in SAS, version 9.1 (SAS Institute Incorporated, Cary, North Carolina). A single CCD frame contained 256 Raman spectra. Initial preprocessing included CCD calibration against a neon discharge lamp, with a check against a Teflon® Raman spectrum. White light correction and dark current subtraction were used to account for the spectral response of the detector. The image was then corrected for curvature caused by the large gathering angle of the spectrograph. The spectrum from each of the 50 collection fibers of the probe was imaged onto slightly more than five rows of the CCD. To avoid cross talk, spectra from only the central three rows of each fiber image were used. These three spectra were averaged to generate one spectrum for each collection fiber. Finally, the region of interest (ROI) was selected. This region contains the mineral phosphate P–O and carbonate C–O stretches, and matrix bands including collagen amide III and wag.2, 8, 38 The amount of noise in the transcutaneous measurements was quantified using spectral averages, that is, without background correction and without separation into bone and overlying tissue components. The three spectra from each of the 50 collection fibers were averaged, and the power spectrum of each averaged spectrum was computed. For this purpose, the dispersion axis was not converted to wavenumber, but was left in wavelength (nm) so that the noise contribution from each pixel would be equally weighted. The root-mean-square (rms) value was calculated for the high transform frequency region between 0.02 and . Data from one tibia were excluded, because the probe was improperly aligned during the measurements. For each of the remaining six tibiae, the mean rms values were computed for each of the seven sequential acquisitions. For each tibia, a paired t-test was used to assess the difference in rms noise magnitudes between spectra of each tibia acquired with and without optical clearing. The effect of optical clearing on the noise rms values was examined for all six tibiae using a repeated measures analysis of variance (ANOVA). Using a mixed-effects model,39 optical clearing was treated as a fixed factor with two levels (glycerol-treated and controls). The repeated measure was the series of measurements made on each mouse. The series had seven (or five) levels and was treated as a random effect. A significance level of 0.05 was used for all statistical calculations. Recovery of a bone factor for each transcutaneous measurement followed previously described procedures.40 An iterative background removal with a fifth-order polynomial was used to subtract the background fluorescence.41, 42 The resulting spectra were normalized, the covariance matrix was calculated, and band target entropy minimization (BTEM)40, 43, 44 was used to recover the spectral factors. A interval around the phosphate band (ca. ) was chosen for band targeting. Between 3 and 23 eigenvectors from the dataset were included for the calculation of Raman spectral factors. Eigenvectors containing predominantly random noise were used to improve the signal-to-noise ratio of the recovered bone spectra. An eigenvector weight distribution test for selecting the appropriate number of eigenvectors was used, as described elsewhere.40 A stopping point was reached when additional eigenvectors added only noise. Once the bone spectral factors were calculated, the cross-correlation coefficient between the bone factor and the exposed bone measurement was calculated using the “xcorr” function of the Matlab signal processing toolbox. To exclude the intense P–O stretch, while including enough of the spectrum for computation, the interval used was . The mean cross-correlation coefficient was computed for the average of the spectra from each of the six tibiae. For each tibia, a paired t-test, as described before, was used to examine the difference in the cross-correlation coefficients between transcutaneous spectra measured with and without optical clearing. The effect of optical clearing on the correlation between transcutaneous and exposed bone measurements was tested for all six tibiae using a repeated measures ANOVA. Optical clearing was treated as a fixed factor with two levels (glycerol-treated and controls), and the repeated measure was the series of measurements on each mouse, which had seven (or five) levels and was treated as a random effect. 3.Results and Discussion3.1.Noise Level Determined by Power SpectraTranscutaneous Raman spectra taken through approximately of tissue on a mouse tibia are shown in Fig. 2a . CCD white light correction, dark current subtraction, and correction of spectrograph-induced curvature was applied, but no further processing was done. The measurements made after glycerol application have visibly less intense and more reproducible background fluorescence than those from the control spectra, which were acquired prior to optical clearing. The power spectra for these Raman spectra are shown in Fig. 2b. In the high transform frequency region , where mostly noise is represented, the measurements made after optical clearing have both lower noise power and reduced measurement-to-measurement variability. Fig. 2Raman spectra of a murine tibia (distal diaphysis). The bone tissue is approximately below the skin. The gray traces are raw spectra obtained without optical clearing, and the black traces are spectra obtained after glycerol application. (a) transcutaneous Raman spectra and (b) power spectra. 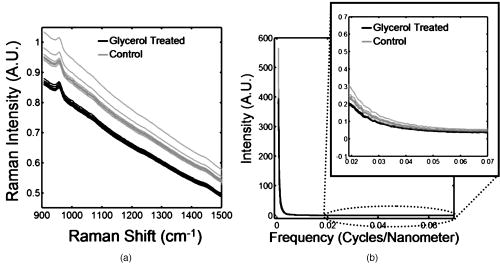 We attribute the spectroscopic effects of optical clearing to reduced specimen fluorescence in the acquired spectra. With excitation, the most important source of fluorescence is melanin, which is located in the melanocytes. In mice, as in humans and other mammals, the melanocytes lie just below the stratum corneum.45 Decreasing the scattering at and just below the skin surface decreases the amount of fluorescence that is generated and the amount reaching the collection fibers, thereby decreasing its contribution to the total collected signal. Some photobleaching may also be occurring during the first few minutes of laser illumination. The background decreases rapidly between the first and second spectrum acquisition, but slowly thereafter [Fig. 2a]. Bar graphs of noise levels and measurement variability for each tibia are shown in Fig. 3a . The measurements taken after optical clearing had a significantly lower noise level in four out of the six tibiae. In addition, the variability in a set of spectra, indicated by the error bars, was lower for spectra acquired after the application of glycerol, although the differences were not statistically significant in tibiae 2 and 6. The mean noise levels for the six tibiae are presented in Fig. 3b. The spectra acquired after optical clearing have significantly less noise . Fig. 3rms intensity for power spectra in high transform frequency region ( deviation). (a) Results for measurements made on six different tibiae. (b) Results across tibiae from all mice.  Recovery of the bone spectrum depends on separation of the bone component from that of the overlying tissue, which includes skin, tendon, blood vessels, and even some adipose tissue. Optical clearing can actually degrade the recovered bone spectrum if the fiber optic probe is not aligned to maximize the contribution from bone and minimize the contribution from overlying tissue. This effect is illustrated in Fig. 4 . The illumination line must be positioned directly over the bone, and the collection fibers must be centered on this line, as shown in Fig. 4a. The field of view of the collection fibers is then as illustrated in Fig. 4b. Fig. 4Effect of not centering the illumination line in the center of the collection fibers. (a) Correct alignment of illumination line and collection disk with respect to the bone. (b) Field of view of the collection fibers for proper alignment. (c) Field of view of the collection fibers for improper alignment. (d) Resulting noise levels in measurements made with improper alignment (compare to Fig. 3). (e) Mean transcutaneous spectra, after baselining and normalizing, for a measurement before and after glycerol application.  However, if the collection fibers are not positioned directly over the bone and centered on the illumination line, spectra from soft tissue are oversampled. We demonstrated these effects by misaligning the probe. The field of view of the collection fibers was shifted toward the medial side of the tibia while the illumination line centered over the bone. The improper collection fiber alignment is shown in Fig. 4c. The rms noise for the control and optical clearing cases are shown in Fig. 4d. Significantly more noise was observed in the measurement made after glycerol application . This seemingly contradictory result is caused by the reduction of light scattering by the skin, allowing oversampling of Raman scatter from the soft tissue directly below. As expected, the overall intensity of the bone component of the recovered spectrum is decreased. The effect is seen most clearly in the phosphate band at [Fig. 4e]. The absolute intensity of the phosphate band recovered with the misaligned probe is not as great as that obtained when the probe is properly aligned. Because the signal-to-noise ratio is reduced and the contribution from skin and tendon collagen is increased by probe misalignment, the accuracy of the recovered bone factor is also lowered. 3.2.Cross-Correlation CoefficientsThe cross-correlation coefficients between bone factors recovered from transcutaneous and exposed bone spectra further illustrate the effects of optical clearing. Because in the mouse tibia the bone lies only about below the skin, a strong phosphate band is actually visible in the spectrum, after removal of fluorescence background (Fig. 5 ). The Raman spectrum of type-1 collagen in skin and tendon is similar to that of type-1 collagen in bone. As a consequence, the collagen bands are much more intense than the similar bands in exposed bone, as comparison to the exposed bone spectrum shows. Collagen bands near the region effectively mask the carbonate band at . By reducing the skin collagen contribution, optical clearing with glycerol improves the accuracy of the recovered bone factor, as shown in Fig. 5b. The difference is clearest in the less intense bands. Fig. 5(a) Typical mean transcutaneous spectrum (gray) and typical mean exposed bone spectrum (black). (b) Recovered bone factor without an optical clearing agent (gray), recovered bone factor after glycerol application (black), and exposed bone measurement (dotted).  To quantify the difference between the recovered bone factors and the exposed bone measurements, cross-correlation coefficients were calculated in the low signal-to-noise portion of the recovered spectra, i.e., excluding the phosphate band (Fig. 6 ). The spectra acquired after optical clearing had a significantly higher correlation with the exposed bone spectra in four of the six tibiae. The mean cross-correlation coefficients are shown in Fig. 6b. The measurements made after optical clearing have a significantly higher correlation with the exposed bone spectra than those of controls, without optical clearing. 4.ConclusionsOptical clearing improves the signal-to-noise ratio of transcutaneously measured bone Raman spectra. Our initial experiments employed only one clearing agent, glycerol, and a simple protocol. Glycerol was chosen because it is known to be effective and safe for use on humans. Other clearing agents and application protocols may prove even more effective. For example, dermabrasion to remove a portion of the stratum corneum is known to improve penetration of clearing agents. Compression or stretching of the skin has also been shown to improve light transmission.10 The use of one or more of these techniques should allow transcutaneous measurement of bone Raman spectra with an even better signal-to-noise ratio. Further development of the line-focused probe could also improve the performance of the system. The available Powell lens assembly was not coated for , nor was its internal collimator adjustable to correct for beam divergence. As a result, throughput was reduced. The delivered power was from a laser. Unlike the ring/disk system, the present configuration does not allow for adjustment of the distance between the entry and collection points. Moreover, the collection fibers are arranged in a disk, resulting in undersampling of the offset points at the periphery of the field of view. These problems can be mitigated with a rectangular collection fiber array and line-forming optics that are designed to work properly with the output from a multimode optical fiber. Development of this system is underway, and its performance will be reported at a later date. AcknowledgmentsThe authors acknowledge support through NIH grant R01 AR052010 and by the University of Michigan Musculoskeletal Core Research Center, NIH grant P30 AR46024, and University of Michigan Claude D. Pepper Older Americans Independence Center AG014824. Author Cole acknowledges support through an NIH Kirschstein-NRSA T90 DK070071-03, and author Dooley acknowledges support through NIH training grant T32 GM008353. ReferencesK. M. Kozloff,
A. Carden,
C. Bergwitz,
A. Forlino,
T. E. Uveges, M. D. Morris,
J. C. Marini, and
S. A. Goldstein,
“Brittle IV mouse model for osteogenesis imperfecta IV demonstrates postpubertal adaptations to improve whole bone strength,”
J. Bone Miner. Res., 19
(4), 614
–622
(2004). https://doi.org/10.1359/JBMR.040111 0884-0431 Google Scholar
C. P. Tarnowski, M. A. I. Jr., M. D. Morris,
“Mineralization of developing mouse calvaria as revealed by Raman microspectroscopy,”
J. Bone Miner. Res., 17
(6), 1118
–1126
(2002). https://doi.org/10.1359/jbmr.2002.17.6.1118 0884-0431 Google Scholar
C. P. Tarnowski, M. A. I. Jr., W. Wang,
J. M. Taboas,
S. A. Goldstein, and
M. D. Morris,
“Earliest mineral and matrix changes in force-induced musculoskeletal disease as revealed by Raman microspectroscopic imaging,”
J. Bone Miner. Res., 19
(1), 64
–71
(2004). https://doi.org/10.1359/JBMR.0301201 0884-0431 Google Scholar
D. H. Kohn,
N. D. Sahar,
S. I. Hong,
K. Golcuk, and
M. D. Morris,
“Local mineral and matrix changes associated with bone adaptation and microdamage,”
Mater. Res. Soc. Symp. Proc., 898E
(L09-03), 1
–11
(2006). 0272-9172 Google Scholar
A. Carden,
R. M. Rajachar,
M. D. Morris, and
D. H. Kohn,
“Ultrastructural changes accompanying the mechanical deformation of bone tissue: a Raman imaging study,”
Calcif. Tissue Int., 72 166
–175
(2003). https://doi.org/10.1007/s00223-002-1039-0 0171-967X Google Scholar
T. C. Chen,
K. Kozloff,
S. Goldstein, and
M. Morris,
“Bone tissue ultrastructural defects in a mouse model for osteogenesis imperfecta: a Raman spectroscopy study,”
Proc. SPIE, 5321 85
–92
(2004). 0277-786X Google Scholar
D. Faibish,
S. M. Ott, and
A. L. Boskey,
“Mineral changes in osteoporosis a review,”
Clin. Orthop. Relat. Res., 443 28
–38
(2006). https://doi.org/10.1097/01.blo.0000200241.14684.4e 0009-921X Google Scholar
B. R. McCreadie,
M. D. Morris,
T. C. Chen,
D. S. Rao,
W. F. Finney,
E. Widjaja, and
S. A. Goldstein,
“Bone extracellular matrix compositional differences in women with and without osteoporotic fracture,”
Bone (N.Y.), 39 1190
–1195
(2006). 8756-3282 Google Scholar
K. A. Dehring,
N. J. Crane,
A. R. Smukler,
J. B. McHugh,
B. J. Roessler, and
M. D. Morris,
“Identifying chemical changes in subchondral bone taken from murine knee joints using Raman spectroscopy,”
Appl. Spectrosc., 60
(10), 1134
–1141
(2006). 0003-7028 Google Scholar
V. V. Tuchin, Optical Clearing of Tissue and Blood,
(2006) Google Scholar
N. S. Eikje,
Y. Ozaki,
K. Aizawa, and
S. Arase,
“Fiber optic near-infrared Raman spectroscopy for clinical noninvasive determination of water content in diseased skin and assessment of cutaneous edema,”
J. Biomed. Opt., 10 014013
(2005). https://doi.org/10.1117/1.1854682 1083-3668 Google Scholar
P. J. Caspers,
G. W. Lucassen, and
G. J. Puppels,
“Combined in vivo confocal Raman spectroscopy and confocal microscopy of human skin,”
Biophys. J., 85 572
–580
(2003). 0006-3495 Google Scholar
B. R. Hammond and
B. R. Wooten,
“Resonance Raman spectroscopic measurement of carotenoids in the skin and retina,”
J. Biomed. Opt., 10
(5), 054002
(2005). https://doi.org/10.1117/1.2116767 1083-3668 Google Scholar
P. J. Caspers,
A. C. Williams,
E. A. Carter,
H. G. M. Edwards,
B. W. Barry,
H. A. Bruining, and
G. J. Puppels,
“Monitoring the penetration enhancer dimethyl sulfoxide in human stratum corneum in vivo by confocal Raman spectroscopy,”
Pharm. Res., 19
(10), 1577
–1580
(2002). https://doi.org/10.1023/A:1020481305420 0724-8741 Google Scholar
Y. Song,
C. Xiao,
R. Mendelsohn,
T. Zheng,
L. Strekowski, and
B. Michniak,
“Investigation of iminosulfuranes as novel transdermal penetration enhancers: enhancement activity and cytotoxicity,”
Pharm. Res., 22
(11), 1918
–1925
(2005). 0724-8741 Google Scholar
J. T. Motz,
M. Fitzmaurice,
A. Miller,
S. J. Gandhi,
A. S. Haka,
L. H. Galindo,
R. R. Dasari,
J. R. Kramer, and
M. S. Feld,
“In vivo Raman spectral pathology of human atherosclerosis and vulnerable plaque,”
J. Biomed. Opt., 11
(2), 021003
(2006). https://doi.org/10.1117/1.2190967 1083-3668 Google Scholar
J. T. Motz,
S. J. Gandhi,
O. R. Scepanovic,
A. S. Haka,
J. R. Kramer,
R. R. Dasari, and
M. S. Feld,
“Real-time Raman system for in vivo disease diagnosis,”
J. Biomed. Opt., 10
(3), 031113
(2005). https://doi.org/10.1117/1.1920247 1083-3668 Google Scholar
O. R. Scepanovic,
M. Fitzmaurice,
J. A. Gardecki,
G. O. Angheloiu,
S. Awasthi,
J. T. Motz,
J. R. Kramer,
R. R. Dasari, and
M. S. Feld,
“Detection of morphological markers of vulnerable atherosclerotic plaque using multimodal spectroscopy,”
J. Biomed. Opt., 11
(2), 021007
(2006). https://doi.org/10.1117/1.2187943 1083-3668 Google Scholar
A. M. K. Enejder,
T. W. Koo,
J. Oh,
M. Hunter,
S. Sasic, and
M. S. Feld,
“Blood analysis by Raman spectroscopy,”
Opt. Lett., 27
(22), 2004
–2006
(2003). 0146-9592 Google Scholar
A. M. K. Enejder,
T. G. Scecina,
J. Oh,
M. Hunter,
W. C. Shih,
S. Sasic,
G. L. Horowitz, and
M. S. Feld,
“Raman spectroscopy for noninvasive glucose measurements,”
J. Biomed. Opt., 10
(3), 031114
(2005). https://doi.org/10.1117/1.1920212 1083-3668 Google Scholar
S. Pilotto,
M. T. T. Pacheco, L. S. Jr., A. B. Villaverde, and
R. A. Zângaro,
“Analysis of near-infrared Raman spectroscopy as a new technique for a transcutaneous non-invasive diagnosis of blood components,”
Lasers Med. Sci., 16
(1), 2
–9
(2001). 0268-8921 Google Scholar
A. T. Yeh, and
J. Hirshburg,
“Molecular interactions of exogenous chemical agents with collagen—implications for tissue optical clearing,”
J. Biomed. Opt., 11
(1), 014003
(2006). https://doi.org/10.1117/1.2166381 1083-3668 Google Scholar
R. Cicchi,
D. Massi,
D. Stambouli,
D. D. Sampson, and
F. S. Pavone,
“Contrast enhancement in combined two-photon second harmonic imaging of skin by using hyperosmotic agents,”
Proc. SPIE, 6089 60890X
(2006). 0277-786X Google Scholar
X. Xu and
R. K. Wang,
“The role of water desorption on optical clearing of biotissue: Studied with near infrared reflectance spectroscopy,”
Med. Phys., 30
(6), 1246
–1253
(2003). https://doi.org/10.1118/1.1576228 0094-2405 Google Scholar
Y. He and
R. K. Wang,
“Dynamic optical clearing effect of tissue impregnated with hyperosmotic agents and studied with optical coherence tomography,”
J. Biomed. Opt., 9
(1), 200
–206
(2004). https://doi.org/10.1117/1.1629682 1083-3668 Google Scholar
A. T. Yeh,
B. Choi,
J. S. Nelson, and
B. J. Tromberg,
“Reversible dissociation of collagen in tissues,”
J. Invest. Dermatol., 121
(6), 1332
–1335
(2003). https://doi.org/10.1046/j.1523-1747.2003.12634.x 0022-202X Google Scholar
P. Matousek,
I. P. CLark,
E. R. C. Draper,
M. D. Morris,
A. E. Goodship,
N. Everall,
M. Towrie,
W. F. Finney, and
A. W. Parker,
“Subsurface probing in diffusely scattering media using spatially offset Raman spectroscopy,”
Appl. Spectrosc., 59
(4), 393
–400
(2005). 0003-7028 Google Scholar
P. Matousek,
M. D. Morris,
N. Everall,
I. P. Clark,
M. Towrie,
E. Draper,
A. Goodship, and
A. W. Parker,
“Numerical simulations of subsurface probing in diffusely scattering media using spatially offset Raman spectroscopy,”
Appl. Spectrosc., 59
(12), 1485
–1492
(2005). https://doi.org/10.1366/000370205775142548 0003-7028 Google Scholar
M. V. Schulmerich,
W. F. Finney,
V. Popescu,
M. D. Morris,
T. M. Vanasse, and
S. A. Goldstein,
“Transcutaneous Raman spectroscopy of bone tissue using a non-confocal fiber optic array probe,”
Proc. SPIE, 6093 609300
(2006). 0277-786X Google Scholar
M. V. Schulmerich,
W. F. Finney,
R. A. Fredricks, and
M. D. Morris,
“Subsurface Raman spectroscopy and mapping using a globally illuminated non-confocal fiber-optic array probe in the presence of Raman photon migration,”
Appl. Spectrosc., 60
(2), 109
–114
(2006). https://doi.org/10.1366/000370206776023340 0003-7028 Google Scholar
M. V. Schulmerich,
K. A. Dooley,
M. D. Morris,
T. M. Vanasse, and
S. A. Goldstein,
“Transcutaneous fiber optic Raman spectroscopy of bone using annular illumination and a circular array of collection fibers,”
J. Biomed. Opt., 11
(6), 060502
(2006). https://doi.org/10.1117/1.2400233 1083-3668 Google Scholar
M. V. Schulmerich,
M. D. Morris,
T. M. Vanasse, S. A. Goldstein,
“Transcutaneous Raman spectroscopy of bone: global sampling and ring/disk fiber optic probes,”
Proc. SPIE, 6430 1
–8
(2007). 0277-786X Google Scholar
P. Matousek,
“Inverse spatially offset Raman spectroscopy for deep noninvasive probing of turbid media,”
Appl. Spectrosc., 60
(11), 1341
–1347
(2006). 0003-7028 Google Scholar
M. V. Schulmerich,
K. A. Dooley,
T. M. Vanasse,
S. A. Goldstein, and
M. D. Morris,
“Subsurface and transcutaneous Raman spectroscopy and mapping using concentric illumination rings and collection with a circular fiber-optic array,”
Appl. Spectrosc., 61
(7), 671
–678
(2007). 0003-7028 Google Scholar
R. Richards-Kortum and
E. Sevick-Muraca,
“Quantitative Optical Spectroscopy for Tissue Disagnosis,”
Annu. Rev. Phys. Chem., 47 555
–606
(1996). https://doi.org/10.1146/annurev.physchem.47.1.555 0066-426X Google Scholar
V. Tuchin, Tissue Optics Light Scattering Methods and Instruments for Medical Diagnosis,
(2000) Google Scholar
T. Vo-Dinh, Biomedical Photonics Handbook, CRC Press, Boca Raton, Florida
(2003). Google Scholar
A. Carden and
M. D. Morris,
“Application of vibrational spectroscopy to the study of mineralized tissues (review),”
J. Biomed. Opt., 5
(3), 259
–268
(2000). https://doi.org/10.1117/1.429994 1083-3668 Google Scholar
J. L. Devore, Probability and Statistics for Engineering and the Sciences,
(2004) Google Scholar
E. Widjaja,
N. Crane,
T. C. Chen,
M. D. Morris,
M. A. Ignelzi, and
B. R. McCreadie,
“Band-target entropy minimization (BTEM) applied to hyperspectral Raman image data,”
Appl. Spectrosc., 57
(11), 1353
–1362
(2003). https://doi.org/10.1366/000370203322554509 0003-7028 Google Scholar
M. Leger and
A. Ryder,
“Comparison of derivative preprocessing and automated polynomial baseline correction method for classification and quantification of narcotics in solid mixtures,”
Appl. Spectrosc., 60
(2), 182
–193
(2006). 0003-7028 Google Scholar
C. A. Lieber and
A. Mahadevan-Jansen,
“Automated method for subtraction of fluorescence from biological Raman spectra,”
Appl. Spectrosc., 57
(11), 1363
–1367
(2003). https://doi.org/10.1366/000370203322554518 0003-7028 Google Scholar
W. Chew,
E. Widjaja, and
M. Garland,
“Band-target entropy minimization (BTEM): an advanced method for recovering unknown pure component spectra. Application to the FTIR spectra of unstable organometallic mixtures,”
Organometallics, 21 1982
–1990
(2002). 0276-7333 Google Scholar
E. Widjaja,
C. Li, and
M. Garland,
“Semi-batch homogeneous catalytic in-situ spectroscopic data. FTIR spectral reconstructions using band-target entropy minimization (BTEM) without spectral preconditioning,”
Organometallics, 21 1991
–1997
(2002). 0276-7333 Google Scholar
R. A. Briggaman, C. E. Wheeler Jr.,
“The epidermal-dermal junction,”
J. Invest. Dermatol., 65
(1), 71
–84
(1975). 0022-202X Google Scholar
|