|
|
1.IntroductionNature has provided a window in the near-infrared portion of the electromagnetic spectrum for probing the chemistry of biological samples with light. The near-infrared window, commonly , is delimited by strong absorbance of hemoglobin and skin pigments at the low end, and by water absorption at the high end.1 An interesting subset of this range is the Herschel region, which starts at and ends at and is the portion accessible by low-cost, silicon semiconductor-based sensors. One of the most successful applications of near-infrared spectroscopy is in-vitro and in-vivo measurement of blood oxygen saturation and hemoglobin concentration.2, 3, 4 Consequently, the absorption of oxy- and deoxyhemoglobin has been well studied.5, 6, 7, 8, 9 The impact of temperature on these measurements has received less attention. Refsum and Sveinsson reported a temperature effect on the optical density of hemolyzed blood at 576 and in 1956.10 Refsum expanded on this with measurements of optical density on heparinized venous blood between 3 and at 576, 560, and .11 The first multispectral results, from , were reported by San Biagio and showed the absorbance of oxy- and deoxyhemoglobin at and approximately in phosphate buffer.12 They took care to subtract the effect of the water absorption band at from their measurements and found that the near-infrared and visible absorption bands of hemoglobin were influenced by temperature. Chuknyiski, Alston, and Rifkind explored the hemoglobin subunits responsible for the temperature dependence in the region13 in 1985. In 1986, Cordone reported measurements of a hemoglobin-water-glycerol solution from .14 They found the absorption bands of hemoglobin become narrower and shift in wavelength as temperature is decreased. In 1992, Steinke and Shepherd reported optical absorbance spectra of oxy-, carboxy-, and deoxyhemoglobin at wavelengths from and three temperatures: 20, 30, and . They investigated the error temperature could introduce in a CO-oximeter.15 In 1997, Sfareni reported temperature-dependent changes of hemoglobin derivatives from for the near-infrared region .16 Hemoglobin was obtained from lyzed human blood cells and the effect measured in a phosphate buffer. All of these earlier studies used hemoglobin solutions. But the operation of red blood cells is critically dependent on the intact cell membrane to perform normal oxygen transport and other physiological functions. In this study, we have made near-infrared optical measurements on whole blood so that the results are more directly related to changes that occur in vivo. Our measurements covered temperatures between 30 and , typical of the range found throughout the human body. The results from these measurements will aid in the understanding and precision of clinical near-infrared measurements on blood. In particular, we see benefits for analysis using full spectrum measurements of blood, such as absolute quantification of oxygen saturation,17 venous oxyhemoglobin measurements,18 and measurement of blood pH.19 2.MethodThe near-infrared optical transmission of fresh ( -old) human blood was measured at six different temperatures between 30 and for each of three different oxygen saturations (80, 90, and 100%). A replicate set of measurements was obtained (next day) using a new sample of blood. The equipment used in the experiment is illustrated in Fig. 1 . The measurement order was randomized (separately) for temperature (36, 32, 40, 34, 30, and ) and oxygen saturation (80, 100, and 90%) to reduce temporal correlation. Fig. 1Schematic illustration of the experimental setup for near-infrared measurement of whole blood. 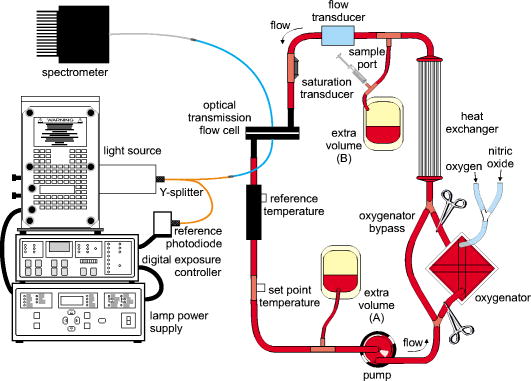 The optical density was measured in a transmission configuration using a custom-designed flow cell with a physical path length of about (Fig. 2 ). The sample was illuminated using a halogen lamp mounted in an Oriel lamp housing. Source intensity was stabilized using a Spectra-Physics digital exposure control and Oriel radiometric power supply (Table 1 ). The transmitted light was measured using a Zeiss MMS-1 spectrometer. The spectrometer and analogue-to-digital (ADC) electronics were kept at constant temperature in a temperature-controlled housing. The light source and spectrometer were connected to the flow cell using optical fibers. The source intensity was measured using an integrating sphere (3P-GPS-033-SL, LabSphere®, North Sutton, New Hampshire) in place of the flow cell. Transmittance was calculated as the ratio of blood spectra to the integrating sphere measurement, scaled by (this scale factor models the attenuation by the integrating sphere). Fig. 2(a) Cross section of optical flow cell, (b) and photograph of optical flow cell (foreground, left), and temperature measurement flow cell (foreground, right). The source fiber comes in on the left in the photograph. 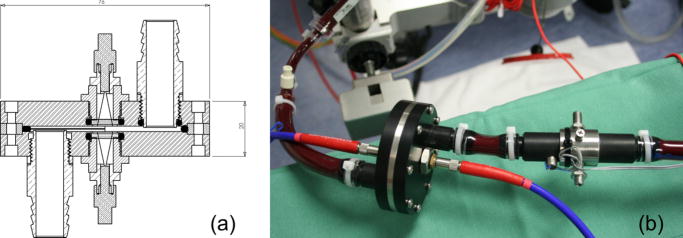 Table 1Details of components used in the circuit for near-infrared measurement of whole blood.
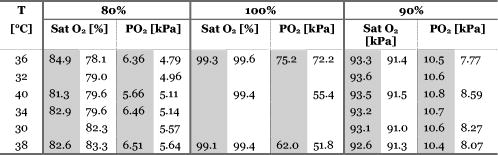
Blood temperature was monitored using a bead thermistor positioned in the center of the flow a short distance (less than ) downstream from the optical flow cell. The thermistor resistance was measured using a Keithly multimeter (Keithly, Cleveland, Ohio), then converted to temperature using a prior calibration of the thermistor against a reference thermometer (Hart Scientific 5612, American Fork, Utah). Precision was better than . A LabView™ (National Instruments, Austin, Texas) program automatically recorded both the spectra and blood temperature. Fresh human whole blood was sourced from the local blood bank and refrigerated during transportation to the test site. The whole blood obtained was of insufficient volume for transfusion and would be discarded ordinarily. Four bags of blood were obtained: two O+ (628 and ) and one each of A+ and AB+ . All were from different donors. Two sets of replicate measurements were obtained across two days. The first with the O+ blood, and the second with the A+ and AB+ blood to make up sufficient volume for the circuit. In each case, the samples were mixed thoroughly. Ethics approval to use discarded human blood was obtained from the Ministry of Health Northern Regional Ethics Committee (approval number NTY/07/35/EXP). A circuit constructed from standard components used during cardiopulmonary bypass (Fig. 1) controlled blood flow, oxygen saturation, and temperature of the blood passing through the optical transmission flow cell. Approximately of blood was circulated at by a centrifugal pump past an oxygenator, heat exchanger, flow transducer, saturation transducer, the optical flow cell, and temperature sensors. The circuit included a bypass loop around the oxygenator. Details for the components used in the circuit are listed in Table 1. The circuit was initially primed with Plasmalyte® 148 (Baxter Healthcare Pty Limited, New South Wales, Australia). The blood was added to the circuit, replacing the Plasmalyte®. Blood additional to the circuit volume was stored in infusion bag A (Fig. 1). Blood volume withdrawn for sampling was automatically replaced from bag A, maintaining a constant volume in the circuit throughout the experiment. The membrane oxygenator was included in the circuit only when altering the oxygen saturation of the blood. The saturation of the blood was altered by ventilating the oxygenator with a combination of oxygen and nitric oxide gases. The oxygen saturation was monitored using the Biotrend saturation transducer and the light transmitted by the optical flow cell (which had a faster response than the saturation monitor). Once the target saturation was achieved, the oxygenator was bypassed (by selectively clamping the tubing) to maintain constant oxygen saturation in the circuit. The oxygen saturation was confirmed by blood gas analysis of a sample drawn from the sample port (Fig. 1). Subsamples were also taken at regular intervals to measure free-plasma hemoglobin. Blood gas analysis (Radiometer® ABL800Flex, Brønshøj, Denmark) of these samples was used for measurement of saturation and hematocrit. The hospital’s (Auckland City Hospital, New Zealand) regular diagnostic service was used for measurement of free-plasma hemoglobin. As samples were taken, replacement blood automatically added from infusion bag A (Fig. 1) introduced a small but measurable change (less than 5%) in the oxygen saturation of the circuit volume. 3.ResultsThe blood chemistry measurements of the subsamples are reported in Table 2 . At 80% nominal saturation, there was a small increase in oxygen saturation with each measurement in the second replicate. This occurred when the oxygen saturation of blood replacing the subsample volume from the reservoir was different from the oxygen saturation in the circuit blood. Hematocrit remained constant throughout the experiment at and for the first and second replicate, respectively. (Errors are reported as two standard deviations: a 95% confidence interval.) This is below the normal physiological range of 40 to 54% (male) and 38 to 46% (female), but selection was limited. The lower hematocrit resulted in a scattering coefficient lower than for blood from the “normal” range. Table 2Summary of oxygen saturation (sat O2 ) and oxygen partial pressure (PO2) measured throughout the experiment with a blood gas analyzer for replicate 1 (shaded) and replicate 2. Results are reported in the sequence measured.
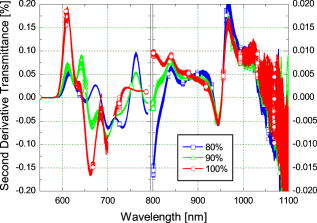
The amount of free hemoglobin in the blood plasma was measured regularly throughout the experiment as an indication of hemolysis. For the first replicate, median plasma hemoglobin was . For the second replicate, median plasma hemoglobin was . There was no clear trend to suggest damage during the experiment. Together, these values suggest only minimal hemolysis of the blood cells so the optical measurement should not be unduly influenced by free hemoglobin in the blood plasma. The optical transmission spectra for the two samples are plotted in Fig. 3 . The separation into three distinct groups, by nominal oxygen saturation, around is caused by the large difference in absorption for oxy- and deoxyhemoglobin.16 The variation within each group is due to temperature. Below , the absorption coefficient for oxy- and deoxyhemoglobin increases rapidly so the blood in this region transmits almost no light. As oxygen saturation decreased, the absorption peak in deoxyhemoglobin became apparent. The second derivative spectrum (Fig. 4 ) shows more detail beyond , revealing the 840- and water absorption bands. These absorptions are probably due to the water that makes up the bulk of the blood plasma. In the second derivative, the deoxyhemoglobin peak clearly increased as expected when the oxygen saturation decreased, demonstrating that the blood reached full saturation for the 100% measurement. 4.DiscussionResolving transmission into an absorption coefficient is difficult for scattering samples, such as whole blood, because the optical path length is not known and is generally much larger than the physical path length. However, it is possible to roughly estimate the optical path length from these measurements using Beer’s law. For this we have assumed that the absorption coefficient of blood is dominated by that of water and oxyhemoglobin (at 100% oxygen saturation).20 The hemoglobin concentration for the two replicates is about . For the transmission observed, this implies a mean optical path length between about at (the strongest water absorption band in our data, though oxyhemoglobin is still the stronger absorber), and about at . Around , scattering dominates; the optical path length is more than 20 times the physical path length. At , in contrast, absorption has a larger effect, with the optical path only about six times the physical path length. More generally, optical density (the negative natural logarithm of transmittance) incorporates the absorption coefficient in a scattering sample. For a nonscattering transmission measurement, dividing the negative logarithm of transmittance by the path length yields the absorption coefficient. In a scattering solution, the optical path length depends on wavelength and scatter concentration, as well as the physical path length between source and detector, so the absorbance cannot be measured by a simple transmission experiment. However, if scatter concentration and absorption do not vary much (as here, for constant oxygen saturation), small changes in absorption produce approximately linear changes in optical density. The three oxygen saturation states were treated separately, so that the large changes in absorption with oxygen saturation did not dominate the relationship. The temperature coefficient of optical density measurements is plotted in Fig. 5 . The temperature coefficient is the slope of a least-squares regression line fitted to temperature versus optical density. For comparison, the absorption temperature coefficient for pure oxyhemoglobin and deoxyhemoglobin,16 and water20 are also plotted. Fig. 5The temperature coefficient for optical density for each whole blood sample at the three different levels of oxygen saturation is plotted along with the temperature coefficient for the main constituents of blood: water,20 oxyhemoglobin,16 and deoxyhemoglobin.16 The hemoglobin and water absorption have been scaled to their approximate molar concentration in whole blood, 30% hematocrit. Note the change in vertical scale at . 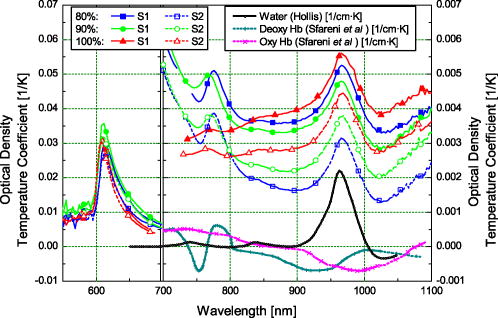 Several features of the data stand out. The temperature coefficients for replicate one are larger than for replicate two. This is probably related to the difference in hematocrit between the two samples. The change in optical density with temperature will act over a longer path length due to more scattering with the higher hematocrit. The measurements are dominated by large temperature sensitivity below that falls sharply at . A positive temperature coefficient for hemoglobin in phosphate buffer down to has been reported.12 However, very little light is transmitted at the low end of this range in our measurements, suggesting we are seeing only the tail of this effect. The main effect is lost in the instrument noise. The water absorption temperature coefficient around is prominent at all oxygen saturations. It is also the likely cause of the subtle bump visible at . The origin of the small bump on the 100% oxygen saturation at data is less clear. It could be the water temperature coefficient peak shifted by the sloping optical density (Fig. 3) but more data are needed to substantiate this. It is clear then that water makes an important contribution to the temperature coefficient of whole blood in the near-infrared portion of the optical spectrum, particularly between 900 and . The deoxyhemoglobin temperature coefficient is most apparent in the optical density of whole blood between 750 and . As oxygen saturation drops from 100 to 80 and 90%, a wobble appears in the temperature coefficient of whole blood around , as Sfareni found for deoxyhemoglobin.16 The deoxyhemoglobin peak seems disproportionately large compared to the water peak at . We believe this is caused by the difference in path length at the two wavelengths. Also apparent in the data is a general positive temperature effect of that is largely independent of wavelength. With only two replicates, it is difficult to identify the cause of this. A increase in path length might explain it; though this is 100 times greater than can be expected from thermal expansion of the aluminium ring separating the source and detector.21 The effect is also larger than can be explained by a change in the density of the blood with temperature (approximately at 22). One possibility is flexure of the flow cell, which is constructed from an acetal plastic. Additional work is planned to resolve this question. Finally, there is a general decrease in the temperature coefficient around as oxygen saturation decreases, mirrored by an increase below . We suspect two factors contributing to this: path length changing with oxygen saturation and hemoglobin’s affinity for oxygen changing with temperature and oxygen saturation.23 In a scattering medium, the mean path length traveled between the source and detector depends on both the scattering and absorption coefficients. Typically, as absorption gets smaller, light is scattered through a longer path before being absorbed. For example, when the absorption coefficient of whole blood at decreases as the oxygen saturation decreases (shifting the balance between oxy- and deoxyhemoglobin absorbers), the mean path length between the source and detector will increase. Optical density does not separate absorption and path length. The increased path length can increase the optical density and its temperature coefficient. Monte Carlo simulation of photon transport in the flow cell could be used to quantify this effect. Nonetheless, an increasing path length, which would increase the optical density temperature coefficient with oxygen saturation, is contrary to the result in Fig. 5. Again, with only two replicates it is difficult to be conclusive; however, the path length effect may be small or countered by some other effect. The change in hemoglobin oxygen affinity with temperature would normally cause a change in oxygen saturation: as temperature increases, the oxygen saturation would decrease. The absorption coefficients of oxy- and deoxyhemoglobin are dramatically different, so this shift in oxygen saturation changes the optical density and contributes to the temperature coefficient. A decrease in oxygen saturation increases the absorption coefficient of blood below and decreases it above . This affects the optical density similarly and matches the result observed in the optical density temperature coefficient. In our experimental system, there is very little oxygen available to shift the oxygen saturation when temperature changes, only that dissolved in the plasma. We made rough calculations of the optical density change expected from changes in hemoglobin affinity when a surplus of oxygen is available using the mean optical density we measured at 80, 90, and 100%. From this, we suspect the optical density temperature coefficient is 2 to 3 times smaller at 90% and 5 to 7 times smaller at 80% than if more oxygen was available to shift oxygen saturation as hemoglobin affinity changed. Like our experimental setup, the mammalian arterial system lacks a ready supply of oxygen; gas exchange principally occurs in the lungs and capillary bed. So we believe the results reported here will reflect the behavior of arterial blood, but not blood in the lungs or capillaries. This simple experiment to document the near-infrared temperature coefficient of whole blood has revealed several interesting aspects. More work is planned to explore them further. 5.ConclusionThe effect of temperature on near-infrared transmission spectra of whole human blood, including whole red blood cells with intact physiological function, at three levels of oxygen saturation is measured. As expected, the spectra are dominated by hemoglobin absorption, particularly below . At , an absorption band is detected and is probably due to absorption by water in the plasma. An optical density temperature coefficient is calculated for each nominal oxygen saturation. Features in the temperature coefficient spectra closely match those of the constituents: oxyhemoglobin, deoxyhemoglobin, and water. The contribution of water to the absorption and temperature coefficient spectra is not apparent in previously reported measurements of hemoglobin using lyzed blood cells. Although the effects are quite small, they may become important when measuring whole blood, particularly in situations involving extreme temperatures, such as during cardiopulmonary bypass. From , water absorption makes the largest contribution to the temperature coefficient of blood. The temperature response of the water absorption at is approximately ten times smaller than the temperature response of the oxyhemoglobin component in the blood at . In the method used here, a surplus of oxygen was not available as temperature changed. If surplus oxygen is available, we suspect a larger effect from changes in hemoglobin affinity would be observed in the temperature coefficient. Additional work is planned to explore this. AcknowledgmentsThis work was conducted with funding from the New Zealand Foundation for Research, Science and Technology (contract C06X0402). We thank Dean Barker for helpful discussions on the turbulent nature of fluids, Tim Lowe for helpful discussions on the physiological properties of blood, and James Pinfold and Lynn Cate for design and construction of the flow cell. We thank the New Zealand Blood Service and donors for providing blood, otherwise unsuitable for transfusion, used in this work. ReferencesV. V. Tuchin,
“Light-tissue interactions,”
Biomedical Photonics Handbook, CRC Press, Oak Ridge, TN
(2003). Google Scholar
R. N. Pittman,
“In vivo photometric analysis of haemoglobin,”
Ann. Biomed. Eng., 14 119
–137
(1986). https://doi.org/10.1007/BF02584263 0090-6964 Google Scholar
G. A. Millikan,
“The oximeter, an instrument for measuring continuously the oxygen saturation of arterial blood in man,”
Rev. Sci. Instrum., 13 434
–444
(1942). https://doi.org/10.1063/1.1769941 0034-6748 Google Scholar
N. V. Iftimia,
D. X. Hammer,
C. E. Bigelow,
D. I. Rose,
T. Ustun,
A. A. Ferrante,
V. Danthu, and
R. D. Ferguson,
“Toward non-invasive measurement of blood hematocrit using spectral domain low coherence interferometry and retinal tracking,”
Opt. Express, 14
(8), 3377
–3388
(2006). https://doi.org/10.1364/OE.14.003377 1094-4087 Google Scholar
M. Friebel and
M. Meinke,
“Determination of the complex refractive index of highly concentrated hemoglobin solutions using transmittance and reflectance measurements,”
J. Biomed. Opt., 10
(6), 064019
(2005). https://doi.org/10.1117/1.2138027 1083-3668 Google Scholar
A. Roggan,
M. Friebel,
K. Dörschel,
A. Hahn, and
G. Müller,
“Optical properties of circulating human blood in the wavelength range ,”
J. Biomed. Opt., 4
(1), 36
–46
(1999). https://doi.org/10.1117/1.429919 1083-3668 Google Scholar
M. L. Adams and
T. M. Schuster,
“Phosphate-dependent spectroscopic changes in liganded haemoglobin,”
Biochem. Biophys. Res. Commun., 58 525
–531
(1974). 0006-291X Google Scholar
F. C. Knowles,
M. J. McDonald, and
Q. M. Gibson,
“The Ørigin of the Adams-Schuster difference spectrum of oxyhemoglobin,”
Biochem. Biophys. Res. Commun., 66 556
–563
(1975). 0006-291X Google Scholar
B. L. Horecker,
“The absorption spectra of haemoglobin and its derivatives in the visible and near infra-red regions,”
J. Biol. Chem., 148
(1), 173
–183
(1943). 0021-9258 Google Scholar
H. E. Refsum and
S. L. Sveinsson,
“Spectrophotometric determination of haemoglobin oxygen saturation in hemolyzed whole blood,”
Scand. J. Clin. Lab. Invest., 8 67
(1956). 0036-5513 Google Scholar
H. E. Refsum,
“Influence of hemolysis and temperature on the spectrophotometric determination of haemoglobin oxygen saturation in hemolyzed whole blood,”
Scand. J. Clin. Lab. Invest., 9 85
–88
(1957). 0036-5513 Google Scholar
P. L. San Biagio,
E. Vitrano,
A. Cupane,
F. Madonia, and
M. Palma,
“Temperature induced difference spectra of oxy and deoxy hemoglobin in the near IR, visible and soret regions,”
Biochem. Biophys. Res. Commun., 77
(4), 1158
–1165
(1977). 0006-291X Google Scholar
P. Chuknyiski,
K. Alston, and
J. Rifkind,
“Temperature dependent spectral changes of iron and nickel hemoglobins and their derivatives,”
Biochem. Biophys. Res. Commun., 128
(2), 721
–727
(1985). 0006-291X Google Scholar
L. Cordone,
A. Cupane,
M. Leone, and
E. Vitrano,
“Optical absorption spectra of deoxy- and oxyhemoglobin in the temperature range ,”
Biophys. Chem., 24 259
–275
(1986). https://doi.org/10.1016/0301-4622(86)85031-1 0301-4622 Google Scholar
J. M. Steinke and
A. P. Shepherd,
“Effects of temperature on optical absorbance spectra of oxy-, carboxy- and deoxyhemoglobin,”
Clin. Chem., 38
(7), 1360
–1364
(1992). 0009-9147 Google Scholar
R. Sfareni,
A. Boffi,
V. Quaresima, and
M. Ferrari,
“Near infrared absorption spectra of human deoxy- and oxyhaemoglobin in the temperature range ,”
Biochim. Biophys. Acta, 1340
(2), 165
–169
(1997). 0006-3002 Google Scholar
J. S. Matcher and
C. E. Cooper,
“Absolute quantification of deoxyhaemoglobin concentration in tissue near infrared spectroscopy,”
Phys. Med. Biol., 39 1295
–1312
(1995). https://doi.org/10.1088/0031-9155/39/8/008 0031-9155 Google Scholar
C. W. Yoxall and
A. M. Weindling,
“Measurement of venous oxyhaemoglobin saturation in the adult human forearm by near infrared spectroscopy with venous occlusion,”
Med. Biol. Eng. Comput., 35 331
–336
(1997). https://doi.org/10.1007/BF02534086 0140-0118 Google Scholar
N. A. Rosen,
W. E. Charash, and
E. F. Hirsch,
“Near-infrared spectrometric determination of blood pH,”
J. Surg. Res., 106
(2), 282
–286
(2002). https://doi.org/10.1006/jsre.2002.6377 0022-4804 Google Scholar
V. S. Hollis,
“Non-invasive monitoring of brain tissue by near-infrared spectroscopy,”
122 Univ. College London,
(2002). Google Scholar
CRC Handbook of Chemistry and Physics, 12
–191 79th ed.CRC Press, Boca Raton
(1986). Google Scholar
T. Kenner,
“The measurement of blood density and its meaning,”
Basic Res. Cardiol., 84 111
–124
(1989). https://doi.org/10.1007/BF01907921 0300-8428 Google Scholar
M. G. Scott,
V. A. LeGrys, and
J. S. Klutts,
“Electrolytes and blood gases,”
Clinical Chemistry and Molecular Diagnostics, Elsevier Saunders, St Louis, MO
(2006). Google Scholar
|