
|
|
1.IntroductionThe introduction of transgenes that express fluorescent proteins (FPs) into cells has revolutionized the ability to visualize many cellular and subcellular processes that are otherwise invisible with traditional means of optical imaging.1 Therefore, FPs have become important tools in biomedical research and their use spans many application areas, including the assessment of cell biodistribution and cell mobility, the study of protein activity and protein interactions in vivo or the dynamic visualization of transcription. Similarly, many application fields benefit from this technology, including cancer research,2, 3 immunology,4 stem cell research,5 and others. Ex vivo and intravital microscopies of FPs at the cellular level have led to unparalleled biological insights.6, 7 Microscopic fluorescence imaging is generally performed on excised thin tissue slices or in vivo at penetration depths typically of the order of . For imaging deeper seated FP activity at the organ and whole animal level, macroscopic imaging has been considered2 to study, for example, cancer metastasis8, 9 and angiogenesis10 and to monitor cancer progression and treatment efficiency.11 In these studies, imaging is performed using a charge-coupled device (CCD) camera in epi-illumination mode, that is, by capturing fluorescence images from the animal side that is illuminated by the excitation light. Epi-illumination imaging can image deeper than microscopy, reaching depths of a few millimeters, but the images obtained are of significantly reduced resolution compared with that of microscopy due to tissue scattering. In addition, signals that come from deep-seated regions are highly attenuated compared with signals from more superficial activity and skin autofluorescence. This reduces the contrast achieved in epi-illumination mode, when imaging activity that seats deeper than a few millimeters, which makes whole-body animal imaging challenging. An alternative imaging geometry is transillumination, which illuminates the object of interest using one or multiple sources on one side and collects the emitted fluorescence from the opposite side. The signal attenuation is better balanced between deep and superficially seated fluorescence activity, because the combined excitation and emission light pathways are similar for all depths sampled. Transillumination data have been used in planar or three-dimensional tomographic imaging for imaging deep-seated fluorescence biodistribution with increased sensitivity and resolution compared with epi-illumination imaging in phantoms and in vivo.12, 13, 14 Imaging of fluorescence proteins has been similarly showcased.13, 15 However, conventional FPs emit in the visible range, where light absorption by tissue is strong. Therefore, sensitive detection through entire animals has been challenging when imaging, for example, variants of the green or red FPs at spectral windows in the range. The recent evolution of red-shifted FPs16, 17, 18 that emit beyond the barrier, where light absorption by tissue is considerably reduced, can enable sensitive in vivo detection of fluorescence proteins through entire animals using three-dimensional tomographic methods, in analogy to fluorescence tomography in the near-infrared range.19, 20 The performance of these proteins in whole-body imaging depends not only on the FP brightness, expression efficiency, and toxicity but also on the particular attenuation of each protein by the wavelength-dependent tissue absorption. Because tissue absorption and scattering result in a nonlinear attenuation of photon signal as a function of depth and optical properties, previous observations of FP-expressing cells implanted at a shallow depth21 do not reflect the overall performance of each of the proteins when considering whole-body imaging. In this paper, we examine, therefore, the performance characteristics of promising new red-shifted FPs for whole-body imaging (i.e., tdTomato, mCherry, mRaspberry, mPlum, Katushka) and contrast these findings with imaging enhanced green FP (GFP). These FPs were selected to include FPs of high brightness (i.e., tdTomato) or near-infrared-shifted emission spectra (i.e., mCherry, mRaspberry, mPlum, Katushka). Experimental measurements from cells expressing tdTomato and mCherry were translated with appropriate theoretical models to obtain performance predictions for whole-body imaging. Overall red-shifted FPs were found to improve detection sensitivity in whole-body imaging applications by at least two orders of magnitude over GFP. In addition, the steep drop of the absorption coefficient of tissue at the spectral region makes the performance sensitive to the selection of illumination parameters. Overall it is showcased that farnesyl-protein tranferase of red-shifted FPs can lead to an important biomedical imaging approach for the noninvasive assessment of cellular and subcellular function in vivo. 2.Methods2.1.Cell Lines, Sample Preparation, and Surgical ProceduresLentivirus vectors bearing GFP (Clontech), mCherry, or td-Tomato (from Dr. Roger Tsien, University of California San Diego) in front of the cytomegatovirus promoter were constructed based on the lentivirus (LV) cloning vector CSCGW (Ref. 22) thus resulting in LV-GFP, LV-mCherry, and LV-tdTomato. Lentivirus vector preparation was previously described in Ref. 22. In brief, 293T human embryonic kidney fibroblasts cells were cotransfected with the LV-GFP, the LV-mCherry, or the LV-tdTomato plasmids, with the lentivirus packaging genome (from Dr. Didier Trono, University of Geneva, Switzerland) and with the envelope-coding plasmid pVSV-G (provided by Dr. Miguel Sena-Esteves, Massachusetts General Hospital, Charlestown, Massachusetts). After , lentivirus vector supernatant was harvested, concentrated by ultracentrifugation and titrated as transducing units (t.u.)/ml on 293T cells in the presence of polybrene (Sigma) by counting the fluorescent-positive cells after infection. Human glioma cells transduced with the LV-GFP or LV-mCherry or LV-tdTomato were sorted by the FacsCalibur Cell sorter (BD Biosciences, San Jose, California). The corresponding wild-type (WT) cells were also employed for control measurements. To experimentally measure the relative intensity imparted by the different FPs examined, we prepared small volumes of the cells placed inside thin transparent glass capillary tubes of inner diameter. The cells were suspended in phosphate buffer solution and were slightly centrifuged to create a pellet of virtually constant cell density at the bottom of each tube. This procedure resulted in approximately 1 million glioma-36 cells occupying , and correspondingly 0.5 million U87 cells in , the U87 cells being slightly bigger in size. Human glioma cells expressing GFP and tdTomato were harvested by trypsinization and stereotactically implanted into the right frontal lobe of nude (nu/nu) athymic mice (500 000 cells/mouse, in phosphate buffered solution) (from bregma, anteroposterior: , mediolateral: ; from dura: ). The study was performed according to the procedures approved by the Massachusetts General Hospital. 2.2.Imaging SystemThe experimental setup used for epi-illumination and for transillumination imaging is similar to the one described in Refs. 12, 14. The object (mouse) is placed in a water-tight chamber slightly compressed between two glass plates. The chamber is filled with a fluid that approximates the optical properties of the tissue for reducing stray light propagating through the sides of the mouse and simplifying the theoretical model required for quantitative measurements. Two continuous-wave excitation sources were used, an argon-ion laser tuned at 488 and (Melles Griot, Carlsbad, California) and a frequency doubled neodymium yttrium aluminum garnet laser at (B&W Tek, Newark, Delaware). For epi-illumination imaging, the excitation light is spatially expanded to uniformly illuminate the object or mouse imaged. In transillumination mode, light is delivered through a galvanometer-controlled set of two mirrors (Nutfield Technology, Inc., Windham, New Hampshire) that can translate a diameter spot on one side of the object imaged. Photons propagating through tissues are captured on the other side of the object using a Princeton Instruments Inc. (Trenton, New Jersey) VersArray CCD camera with CCD array cooled to , through a photographic lens (Nikon Corp., Japan). Multiple fluorescence bands were captured using three-cavity bandpass interference filters (Andover Corp., New Hampshire Salem, and Omega Optical, Inc., Brattleboro, Vermont), placed in front of the lens at , , , and . 2.3.Spectrally Dependent Tissue AttenuationThe fluorescence strength collected at different spectral bands depends on tissue attenuation characteristics for each of these bands. To determine this spectrally dependent tissue attenuation, as it relates to the spectral bands selected for fluorescence measurements, we used a fiber-based spectrometer. The experimental setup consisted of a tungsten halogen lamp coupled to a multimode fiber to guide light onto the mouse tissue, acting as a point source. The light propagated inside the tissue and was collected by a second fiber, which was in contact with tissue on the opposite side of the source fiber, and delivered to a CCD spectrophotometer (Ocean Optics Inc., Dunedin, Florida) to measure the intensity of the transmitted light , which is proportional to the relative transmission . The measured spectrum of the transmitted light was normalized by dividing with the reference spectrum of the illuminating source. The measurements were taken through the upper thoracic area along the dorsal-ventral direction both in vivo and postmortem as a function of time after overdose injection with ketamine-xylazine. Figure 1 depicts the relative spectral attenuation as measured in vivo and postmortem for two different tissue thicknesses (i.e., 0.4 and ). It can be seen that the in vivo spectral curve is similar to the absorption curve of oxygenated hemoglobin, but the postmortem spectra are gradually becoming similar to the absorption spectrum of deoxygenated hemoglobin.23 Fig. 1Spectral attenuation of light transmitted through mouse thoracic area along the dorsal-ventral direction. Lower bundle of curves is a series of measurements for tissue thickness as recorded in vivo (top line) and for consecutively in postmortem period over . Here, marks the administration of the ketamine-xylazine overdose. The higher set of two curves is for thickness and for in vivo (solid-curve) and ex vivo (dashed curve).  2.4.Epi-Illumination Imaging of FPs in TubesThe relative brightness of the FPs examined is defined as the peak fluorescence emission intensity of the FP-expressing cells at optimum excitation wavelength, normalized to the peak emission of the reference FP (here GFP) for the same excitation intensity. Although the values of the relative emission efficiency of the red-shifted FPs are reported in the literature,16, 24 they were experimentally determined herein to account for possible experimental uncertainties, such as the variable cell density of the cells in the pellet or the level of expression. A series of epi-illumination images of GFP-, tdTomato-, and mCherry-expressing cells and WT cells in tubes excited with 488- and laser lines were captured using the 610-, 630-, and bandpass filters. The tubes were closely placed on a flat black absorbing surface and excited with an off-axis slightly diverging -polarized illuminating field. The fluorescent field was captured using a crossed polarizer to eliminate the reflections from the surface of the glass tubes. The intensity of the excitation field incident on the tubes was 50 and for the 488- and the laser illumination, respectively, and correspondingly, the exposure times were set to 0.3 and . The raw images were normalized for the exposure time and the interference filter bandwidth and were also corrected for the slight inhomogeneity of the illuminating field by dividing with the image of the illuminating field on a white flat diffusive surface in the absence of the tubes. 2.5.Transillumination Imaging of FPs Inside TissueTwo different experiments were performed to measure the intensity of fluorescence signals emanating from deep-tissue in transillumination mode: (a) with cells in tubes inserted postmortem into the esophagus of nude mice and (b) using cells implanted in the brain to form a tumor. In both experiments, mice were euthanized by carbon dioxide prior to the experiment to allow for flexibility in setting up the measurements without the need for prolonged anesthesia. Imaging was performed under consecutive illumination of the laser beam scanned at the 488- and excitation wavelengths. All raw images were normalized for the exposure time, filter bandwidth, and number of cells and signals are reported as cells. In the implanted tube experiment, a mouse was euthanized and placed inside the chamber with the dorsal side toward the sources and the ventral toward the camera and was illuminated consecutively at two points on the dorsal side of its upper thorax. The four tubes were consecutively inserted and removed from the esophagus of the same mouse ensuring that the bottom of each tube was reaching the same location in the upper thoracic area, just above the heart. The tube in the esophagus was located from the dorsal glass plate (source-tube distance ) and from the ventral glass plate (tube-detector distance ). Accurate and repeatable positioning of the tubes was critical to achieve identical geometry and imaging conditions and, therefore, to allow for the direct comparison between the FP protein signals. Fluorescence images were acquired at the 488- and illumination laser lines and for 513- and bandpass filters for GFP-, tdTomato-, and mCherry-expressing cell lines, as well as for the WT cells that served as controls to independently record tissue and cell autofluorescence. In the brain imaging experiments, two mice were implanted with GFP- and tdTomato-expressing cells to form tumors in the brain and were imaged after implantation. The brain was illuminated at 488, 514, and with two sources. Illumination was incident on the ventral side, and light was collected from the dorsal side. The other imaging parameters were kept the same as in the implanted tube experiments. Images of the head were captured at several excitation (488, 514, and ) and fluorescence ( , , and ) wavelengths. The fluorescent images were post-processed by applying a threshold to reject background noise.12 A portion of the image recorded in the excitation wavelength was subtracted from the fluorescence image to correct for tissue autofluorescence. 2.6.Calculation of Light Attenuation in TissueQuantification of the relative intensity of fluorescent signals due to deep-seated FP activity was based on a diffusion-equation–based model for photon propagation in tissue. The use of solutions of the diffusion equation for modeling photon propagation in tissues in the visible range were shown to be valid when using a modified diffusion coefficient.25 To model the particular experimental geometry used herein, we assumed excitation light from a point source, with intensity , that is incident on the mouse surface and propagates for inside tissue. At , the excitation light reaches and excites the tubes of FP with intensity , where is the relative spectral transmittance for as calculated from the tissue spectral measurements described in Sec. 2.3 (see also Fig. 1) obtained also for a point source. The relative emitted intensity then is , where is the spectral emission of the FP and is the measured relative brightness of the FP-expressing cells. Finally, the emitted fluorescence propagates to the boundary of the tissue and the intensity that reaches the detector is , where is the relative spectral transmittance of the remaining distance, or equivalently, The accuracy of this simplified propagation model is initially tested by fitting the experimental data from the GFP-tdTomato-mCherry mouse-tube experiment (Sec. 2.5) and then applied to predict the intensity emission for new FPs that attain good performance characteristics for in vivo applications.3.Results3.1.Relative Brightness of the FPsIn the literature, the relative brightness of the FPs is reported when excited at the optimum wavelength (see Table 1 for a summary of the optical properties of the most interesting FPs). However, in practical applications the optimum excitation wavelength might not be available, and the actual relative brightness values can be different when exciting the proteins with the commercially available laser lines. Here we present the results of our experiments to determine the relative brightness for these wavelengths. In Fig. 2 , we present the normalized images of the FPs in tubes acquired as described in Sec. 2.4. The intensity signal of the GFP was cells when excited at , for the tdTomato it was 5572 and cells when excited at 488 and , respectively, and for the mCherry it was cells when excited at . Taking into account the mismatch in the intensities of the excitation fields (50 and at 488 and , respectively), the calculated relative brightness of the cells over GFP was 0.91 and 1.87 for tdTomato excited at 488 and , respectively, and 0.23 for mCherry excited at . In Fig. 3 , the data from the fluorescence epi-illumination images of Fig. 2 are plotted versus emission wavelength together with the relative emission spectra of the FPs as published in the literature.16, 17, 24 The results show that tdTomato is the brightest FP when excited at ; however, its emission in is only twice as bright compared with GFP fluorescence at . The signal from the WT cells marks the background/noise level. Fig. 2Images of the protein pellets inside the capillary tubes are shown. The images are normalized for the illuminating field inhomogeneity, the exposure time, and the emission bandwidth and are plotted versus excitation and emission wavelengths. Top left is a white light picture of the tubes. In all pictures, the tubes from left to right contain glioma cells with GFP, tdTomato, mCherry, and WT. Excitation radiation: neodymium yttrium aluminum garnet laser (first row) and argon-ion laser (second row). Emission bandwidth filters centered at 514 (first column), 610 (second column), 630 (third column), and (fourth column).  Fig. 3Fluorescent protein brightness is plotted. Discrete points are the compiled measurements from the normalized images in Fig. 2. Open (white) symbols—excitation at , solid (black) symbols—excitation at . Continuous lines are the emission spectra of the FP scaled to fit the experimental data.  Table 1Optical characteristics of the red-shifted FPs compared with GFP.
These results do not coincide with the values as reported in the literature because of the different excitation and emission wavelengths. Here, we introduce a model that accounts for the difference due to the wavelength mismatch that will be used to predict the reduced relative brightness values for every FP. The brightness is proportional to the quantum yield and the molar extinction coefficient . measured at the peak absorption/excitation wavelength and the relative brightness is normalized to the GFP value. According to Kasha-Vavilov rule, the quantum yield is independent of the excitation wavelength, so the brightness depends only on the molar extinction coefficient at the wavelength of interest and is a fraction of the maximum brightness. The excitation mismatch factor is calculated by the spectral absorption data of the FPs as given in the literature and is given in Table 1 under the excitation mismatch coefficient column. Assuming that the relation holds true for adjacent wavelengths, we calculate the reduced relative brightness . The calculated values are 0.98 for GFP excited at , 0.83 and 1.88 for tdTomato excited at 488 and , respectively, and 0.18 for mCherry excited at , which are consistent with our measurements as presented in Fig. 3. These values serve as the actual relative FP brightness and are used as a reference in the calculation of the relative fluorescence intensity through deep tissue.3.2.Fluorescence Intensity from Activity Located Deep Inside TissueHere, we present the transillumination images of the fluorescence from the proteins located inside deep tissue from two experiments (Sec. 2.5): With the tubes inside the esophagus [Figs. 4a, 4b, 4c, 4d ] and with the brain tumors [Figs. 4e and 4f]. The tubes with GFP, tdTomato, mCherry, and control cells that were placed into the esophagus were excited with two illumination sources [the geometry is shown in Fig. 4a]. Representative images of the fluorescent signals of the tdTomato and WT-control cells excited at and imaged with the filter are illustrated in Figs. 4b and 4c, respectively. Examination of the raw data shows that the fluorescence signal measured from the tdTomato cells (maximum: cells) is comparable to the signal from the WT cells’ fluorescence image (maximum: cells). This signal is actually attributed to the autofluorescence from the tissue, because the fluorescence from the WT cells is negligible (Fig. 3). Observation of the WT cell images for all wavelengths reveals that the autofluorescence signal intensity (a) was lower for the excitation compared with the excitation and (b) was increasing for higher wavelengths (filters at 610, 630, and ). These observations seem to contradict the notion that autofluorescence is decreasing with increasing excitation and emission wavelength.26, 27 However, light absorption by tissue is higher at in comparison with (Fig. 1); therefore, more tissue molecules are excited at to emit autofluorescence. Fig. 4Normalized images of the fluorescence emission of GFP and tdTomato are shown. The two crosses indicate the position of the sources illuminating the mouse. Panels (a) to (d) show capillary tubes inserted in the esophagus excited with an argon-ion laser at radiation and imaged in the spectral window. The capillary tube is physically located between the projections of the sources. Panel (a) shows the plain reflectance image at excitation wavelength. Panel (b) shows the raw image of the fluorescence emission of the inserted tdTomato tube. Panel (c) shows the autofluorescence emission when the tdTomato tube is replaced with the WT nonfluorescing cells. Panel (d) shows the net tdTomato fluorescence as calculated when subtracting image (c) from (b). Panels (e) and (f) are images of the fluorescence emission of glioma-36 cells implanted in the brain expressing GFP and tdTomato, respectively. All images are normalized to the same units ( cells) for direct comparison.  To accurately calculate the actual fluorescent signal of each FP, we subtracted the corresponding autofluorescence images (WT cells) from all FP fluorescence images. For example, in Fig. 4d, we present the net fluorescence image of tdTomato cells excited at , as calculated by subtraction of the corresponding autofluorescence image [Fig. 4c] from the original image [Fig. 4b]; all images were similarly processed. The emanating intensity of GFP [excitation wavelength (ex.): , emission wavelength (em.): ] was cells, of tdTomato excitation (ex.: 488 and , em.: ) was 1.53 and cells, respectively, but mCherry (ex.: , em.: ) is slightly above detection level with cells. Although in epi-illumination mode, tdTomato was excited more efficiently at compared with (see Fig. 3), in deep tissue imaging, it was found to be more sensitive for the excitation instead of the excitation. This is because the relative transmitted intensity for thick ex vivo tissue is significantly higher at (i.e., ) as seen in Fig. 1. This is also an advantage for GFP excited at and collected at (which emits cells). Finally, we imaged the two mice with brain tumors expressing GFP and tdTomato in transillumination mode. The GFP tumor was excited at ; fluorescence was collected at ; and the tdTomato tumor was excited at 488, 514, and and was collected at . For example, in Figs. 4e and 4f, we present the fluorescence transillumination fluorescence images of GFP and tdTomato tumors (ex.: , em.: ) overlaid on the corresponding reflectance images of the heads. The peak fluorescence signals for GFP and tdTomato are 2 and cells, respectively, and are both located at the right hemisphere of the brain, which is congruent with the implantation position. It is evident that the intensity of the FPs from the tumors is higher compared with the signal coming from the tubes, and this can be probably attributed to (a) the lower light absorption of the tissue in the head area, (b) the different tissue and tumor “geometry,” and/or (c) the fast growth of the tumor over the between implantation and imaging. In Fig. 5 , all the previously discussed results from the tube and tumor imaging experiments are summarized in a plot of intensity versus emission wavelength (closed black symbols—inserted tubes, open white symbols—brain tumors). Fig. 5Normalized fluorescence intensity of GFP and tdTomato emitted from the FPs cells inside tubes inserted into the esophagus and cells implanted in the brain as compiled from the images as in Fig. 4. Fluorescent proteins are excited at 488, 514, and . Symbols: solid—fluorescence from cells in tubes, open—fluorescence from brain tumors, lines—theoretical fitting for the intensity of the FPs in inserted tubes. Solid line—GFP excited at , dashed lines—tdTomato excited at 488 and , and dotted line—mCherry excited at . All experimental data are normalized to the same units ( cells) for direct comparison. 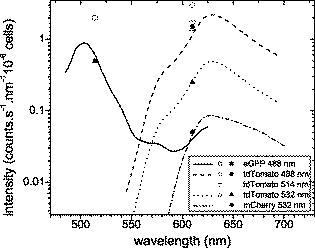 3.3.Theoretical Calculation of the Transmitted Fluorescent SignalTo evaluate the theoretical model in Eq. 1, we examined the ability to predict the experimental measurements presented in Sec. 3.2. Spectrally dependent intensity profiles of the fluorescence from deep tissue were calculated using together (a) the spectral emission curves reported in the literature,16, 17, 24 (b) the previously measured relative brightness from Sec. 3.1 and (c) the ex vivo transmission from Fig. 1. The resulting profile (shown in Fig. 5—lines) demonstrates a good match between the experimental data and the theoretical approximation in the 514- and centered bandpass emission windows. Using this model, we then predicted the performance of the new red-shifted FPs (RFP) for in vivo applications, in particular, mRFP, mPlum, mRaspberry, and Katushka. For this calculation, we used the in vivo relative attenuation curves from Fig. 1 and the calculated reduced relative brightness from Table 1. Although a wide range of illumination wavelengths can be studied, we opted for examining the performance of laser lines that are generally available in a cost-efficient from: the well-established laser lines at 488 and using argon-ion or doubled-frequency neodymium yttrium aluminum garnet lasers and the newly developed continuous-wave diode-pumped solid state laser line. Figure 6 depicts a comparative plot of the deep-tissue fluorescent signal from the different FPs placed away from the sources (see location details in Sec. 2.6). The maximum signal achieved for each FP is tabulated in Table 2 . Except for GFP that emits in the green area of the spectrum, the detected fluorescence from the other FPs is above because it is “shaped” by the spectral profile of the tissue absorption. For the particular depth where the tubes containing the fluorescence protein–expressing cells were placed, the maximum signal from Katushka excited at was calculated to be 46 times stronger than GFP. Respectively, mRaspberry, mCherry, and mRFP were found to be 24, 18, and 17 times brighter than GFP. The mPlum maximum signal was 8.5 times brighter than GFP, but its spectral profile is smoother and shifted further in the red spectral region, with its peak at , similar to Katushka. Finally, although tdTomato is the brightest protein in epi-illumination mode, it is by far outperformed in deep-tissue imaging applications by the other proteins. Fig. 6Relative fluorescence intensity of various FPs located inside the body of a mouse from the sources and from the detector position. The FPs are excited with the optimal laser choices; all of them were assumed to have the same light output power. The GFP maximum intensity is normalized to 1. 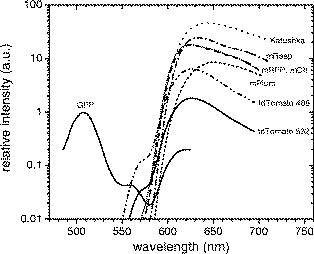 Table 2Maximum intensity of the red-shifted FPs compared with GFP inside tissue.
The signal strength from the FPs shown in Fig. 6 is sensitive to the wavelength used for illumination, because the optical properties change rapidly in the area around , as shown in Fig. 1. Therefore, the calculations herein as well as the overall performance achieved are highly dependent on the exact excitation wavelength employed. To demonstrate this, the relative fluorescence intensities are calculated for two additional cases: when the excitation wavelength is shifted by (toward the UV) and by (toward IR). The results are presented in Table 2 and deviations between 50% and 200% may be present; for example, the Katushka fluorescent signal can be 26 to 75 times higher than GFP. 4.Discussion and ConclusionsThe ability to select optimal red-shifted FPs for whole-body applications becomes an involved task due to the availability of a large number of potent FPs and the steep change in the absorption spectrum of tissue around the wavelength. In addition, the limited availability of economically available laser lines to appropriately excite these proteins in tomographic mode (i.e., using point illumination) further complicates the FP selection. This work, therefore, studied the relative performance of red-shifted FPs assuming whole-body imaging and realistic experimental considerations that relate to tomographic setups. Two different experimental approaches were presented to measure the intensity of the FP signals emerging from deep areas: (a) using tubes containing FP-expressing cells implanted into mice postmortem and (b) direct implantation of cells in mouse brains. Although the latter is directly related to realistic biomedical applications, the implanted tube approach offered many advantages:
The obvious disadvantage is that these measurements do not directly relate to in vivo measurements because in vivo and postmortem tissue spectra have significant differences, as shown in Fig. 1. However, the use of the spectra in Fig. 1 allows for calculations of in vivo–related values from the ones achieved postmortem by taking into account the relative attenuation differences in each spectral region examined. As demonstrated in Sec. 3.3, a small deviation in the excitation wavelength may yield a significant deviation in sensitivity performance; therefore, further red-shifting the excitation wavelength may yield significant sensitivity gains. In addition, the relative fluorescence intensity gain of the red-shifted FPs compared with GFP depends on the position of the FPs inside the body. Herein, the geometry examined assumed that the source-protein and the protein-detector distances are 0.8 and , respectively. This was selected as a typical worst-case scenario approach, where the highly attenuated excitation wavelength propagates for a longer distance compared with the emission light. Other combinations where the fluorescence activity is deeper in the tissue (closer to the source plane) will yield higher signal intensity and sensitivity. For example, we have calculated the intensities in the “reverse geometry” where the source-protein and the protein-detector distances were 0.4 and , respectively, with the detected fluorescence from Katushka being more than 700 times higher than the fluorescence of GFP (see reverse geometry column in Table 2). Finally, more superficial activity (closer to the CCD camera plane) can be detected also in epi-illumination mode. As a conclusion, the new FPs emitting in the red to near-infrared part of the spectrum are expected to boost whole-body imaging due to the high intensity fluorescent signals when properly excited. The maximum signals coming from red-shifted FPs located deep inside tissue are stronger than the signals from GFP in every case examined experimentally and theoretically. The improvement in signal would be even higher if appropriate light sources at were available. From our calculations, the highest emission intensity signal is expected from Katushka when excited with laser radiation, although these values may be modified by certain biological parameters such as expression levels and expression sustainability, the pH of the microenvironment, and the detection system used. However, Katushka, mRaspberry, and mCherry appear to be the most suitable choices for whole-body FP imaging applications. AcknowledgmentsThe authors would like to thank Jason Gaglia for useful discussions. This research was supported in part by National Institutes of Health Grants No. 1R01EB00438201 and 1R21-CA110167. ReferencesR. M. Hoffman,
“The multiple uses of fluorescent proteins to visualize cancer in vivo,”
Nat. Rev. Cancer, 5
(10), 796
–806
(2005). https://doi.org/10.1038/nrc1717 1474-175X Google Scholar
R. M. Hoffman,
“Green fluorescent protein imaging of tumour growth, metastasis, and angiogenesis in mouse models,”
Lancet Oncol., 3
(9), 546
–556
(2002). 1470-2045 Google Scholar
K. Shah,
A. Jacobs,
X. O. Breakefield, and
R. Weissleder,
“Molecular imaging of gene therapy for cancer,”
Gene Ther., 11
(15), 1175
–1187
(2004). 0969-7128 Google Scholar
A. Griekspoor,
W. Zwart, and
J. Neefjes,
“Presenting antigen presentation in living cells using biophysical techniques,”
Curr. Opin. Microbiol., 8
(3), 338
–343
(2005). 1369-5274 Google Scholar
A. M. Wobus and
K. R. Boheler,
“Embryonic stem cells: prospects for developmental biology and cell therapy,”
Physiol. Rev., 85
(2), 635
–678
(2005). 0031-9333 Google Scholar
F. Helmchen and
W. Denk,
“Deep tissue two-photon microscopy,”
Nat. Methods, 3
(3), 235
–235
(2006). 1548-7091 Google Scholar
R. K. Jain,
L. L. Munn, and
D. Fukumura,
“Dissecting tumour pathophysiology using intravital microscopy,”
Nat. Rev. Cancer, 2
(4), 266
–276
(2002). https://doi.org/10.1038/nrc778 1474-175X Google Scholar
M. Yang,
E. Baranov,
P. Jiang,
F. X. Sun,
X. M. Li,
L. N. Li,
S. Hasegawa,
M. Bouvet,
M. Al-Tuwaijri,
T. Chishima,
H. Shimada,
A. R. Moossa,
S. Penman, and
R. M. Hoffman,
“Whole-body optical imaging of green fluorescent protein-expressing tumors and metastases,”
Proc. Natl. Acad. Sci. U.S.A., 97
(3), 1206
–1211
(2000). https://doi.org/10.1073/pnas.97.3.1206 0027-8424 Google Scholar
H. Kishimoto,
T. Kojima,
Y. Watanabe,
S. Kagawa,
T. Fujiwara,
F. Uno,
F. Teraishi,
S. Kyo,
H. Mizuguchi,
Y. Hashimoto,
Y. Urata,
N. Tanaka, and
T. Fujiwara,
“In vivo imaging of lymph node metastasis with telomerase-specific replication-selective adenovirus,”
Nat. Methods, 12
(10), 1213
–1219
(2006). 1548-7091 Google Scholar
M. Yang,
E. Baranov,
X. M. Li,
J. W. Wang,
P. Jiang,
L. Li,
A. R. Moossa,
S. Penman, and
R. M. Hoffman,
“Whole-body and intravital optical imaging of angiogenesis in orthotopically implanted tumors,”
Proc. Natl. Acad. Sci. U.S.A., 98
(5), 2616
–2621
(2001). https://doi.org/10.1073/pnas.051626698 0027-8424 Google Scholar
M. H. Katz,
S. Takimoto,
D. Spivack,
A. R. Moossa,
R. M. Hoffman, and
M. Bouvet,
“A novel red fluorescent protein orthotopic pancreatic cancer model for the preclinical evaluation of chemotherapeutics,”
J. Surg. Res., 113
(1), 151
–160
(2003). https://doi.org/10.1016/S0022-4804(03)00234-8 0022-4804 Google Scholar
V. Ntziachristos,
G. Turner,
J. Dunham,
S. Windsor,
A. Soubret,
J. Ripoll, and
H. A. Shih,
“Planar fluorescence imaging using normalized data,”
J. Biomed. Opt., 10
(6), 064007
(2005). https://doi.org/10.1117/1.2136148 1083-3668 Google Scholar
G. Zacharakis,
H. Kambara,
H. Shih,
J. Ripoll,
J. Grimm,
Y. Saeki,
R. Weissleder, and
V. Ntziachristos,
“Volumetric tomography of fluorescent proteins through small animals in vivo,”
Proc. Natl. Acad. Sci. U.S.A., 102
(51), 18252
–18257
(2005). https://doi.org/10.1073/pnas.0504628102 0027-8424 Google Scholar
G. Zacharakis,
H. Shih,
J. Ripoll,
R. Weissleder, and
V. Ntziachristos,
“Normalized transillumination of fluorescent proteins in small animals,”
Mol. Imaging, 5
(3), 153
–159
(2006). 1535-3508 Google Scholar
I. V. Turchin,
V. I. Plehanov,
A. G. Orlova,
V. A. Kamenskiy,
M. S. Kleshnin,
M. V. Shirmanova,
N. M. Shakhova,
I. V. Balalaeva, and
A. P. Savitskiy,
“Fluorescence diffuse tomography of small animals with DsRed2 fluorescent protein,”
Laser Phys., 16
(5), 741
–746
(2006). 1054-660X Google Scholar
N. C. Shaner,
R. E. Campbell,
P. A. Steinbach,
B. N. G. Giepmans,
A. E. Palmer, and
R. Y. Tsien,
“Improved monomeric red, orange and yellow fluorescent proteins derived from Discosoma sp red fluorescent protein,”
Nat. Biotechnol., 22
(12), 1567
–1572
(2004). https://doi.org/10.1038/nbt1037 1087-0156 Google Scholar
L. Wang,
W. C. Jackson,
P. A. Steinbach, and
R. Y. Tsien,
“Evolution of new nonantibody proteins via iterative somatic hypermutation,”
Proc. Natl. Acad. Sci. U.S.A., 101
(48), 16745
–16749
(2004). https://doi.org/10.1073/pnas.0407752101 0027-8424 Google Scholar
D. Shcherbo,
E. M. Merzlyak,
T. V. Chepurnykh,
A. F. Fradkov,
G. V. Ermakova,
E. A. Solovieva,
K. A. Lukyanov,
E. A. Bogdanova,
A. G. Zaraisky,
S. Lukyanov, and
D. M. Chudakov,
“Bright far-red fluorescent protein for whole-body imaging,”
Nat. Methods, 4
(9), 741
–746
(2007). 1548-7091 Google Scholar
R. Weissleder,
C. H. Tung,
U. Mahmood, and
A. Bogdanov,
“In vivo imaging of tumors with protease-activated near-infrared fluorescent probes,”
Nat. Biotechnol., 17
(4), 375
–378
(1999). https://doi.org/10.1038/7933 1087-0156 Google Scholar
M. Gurfinkel,
S. Ke,
X. X. Wen,
C. Li, and
E. M. Sevick-Muraca,
“Near-infrared fluorescence optical imaging and tomography,”
Dis. Markers, 19
(2–3), 107
–121
(20032004). 0278-0240 Google Scholar
P. T. Winnard,
J. B. Kluth, and
V. Raman,
“Noninvasive optical tracking of red fluorescent protein-expressing cancer cells in a model of metastatic breast cancer,”
Neoplasia, 8
(10), 796
–806
(2006). 1522-8002 Google Scholar
M. Sena-Esteves,
J. C. Tebbets,
S. Steffens,
T. Crombleholme, and
A. W. Flake,
“Optimized large-scale production of high titer lentivirus vector pseudotypes,”
J. Virol. Methods, 122
(2), 131
–139
(2004). 0166-0934 Google Scholar
W. G. Zijlstra,
A. Buursma, and
W. P. Meeuwsenvanderroest,
“Absorption-spectra of human fetal and adult oxyhemoglobin, de-oxyhemoglobin, carboxyhemoglobin, and methemoglobin,”
Clin. Chem., 37
(9), 1633
–1638
(1991). 0009-9147 Google Scholar
G. H. Patterson,
S. M. Knobel,
W. D. Sharif,
S. R. Kain, and
D. W. Piston,
“Use of the green fluorescent protein and its mutants in quantitative fluorescence microscopy,”
Biophys. J., 73
(5), 2782
–2790
(1997). 0006-3495 Google Scholar
J. Ripoll and
V. Ntziachristos,
“From finite to infinite volumes: removal of boundaries in diffuse wave imaging,”
Phys. Rev. Lett., 96
(17), 173903
(2006). https://doi.org/10.1103/PhysRevLett.96.173903 0031-9007 Google Scholar
M. G. Muller,
I. Georgakoudi,
Q. G. Zhang,
J. Wu, and
M. S. Feld,
“Intrinsic fluorescence spectroscopy in turbid media: disentangling effects of scattering and absorption,”
Appl. Opt., 40
(25), 4633
–4646
(2001). https://doi.org/10.1364/AO.40.004633 0003-6935 Google Scholar
R. Weissleder and
V. Ntziachristos,
“Shedding light onto live molecular targets,”
Nat. Med., 9
(1), 123
–128
(2003). 1078-8956 Google Scholar
|
||||||||||||||||||||||||||||||||||||||||||||||||||||||||||||||||||||||||||||||||||||||||||||||||||||||||||||||||||||||||||||||||||||||||||||


