|
|
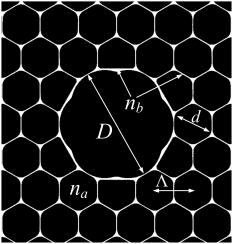
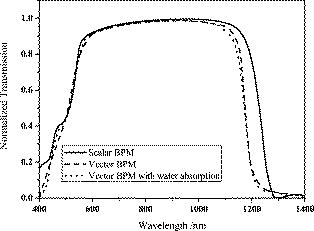
1.IntroductionOver the last two decades, optical fibers and waveguides have been widely used for developing optical biosensors.1 Evanescent wave biosensors are based on interaction of the analyte species with the electromagnetic wave, which extends from the surface of the light-guiding waveguides. The interaction between evanescent wave and analytes produces absorption, spontaneous emission, stimulated emission, and Raman scattering, which have been used extensively both in a planar waveguide and in fiber geometry. The efficiency of this kind of biosensor is determined by sufficient interaction length and large overlap between excitation light and fluorescent dye–labeled analytes.2 Approaches used to realize large overlap between excitation light and analytes are based on reducing the radius of the fiber, including unclad, partially clad, and D-shaped forms.2 The removal of cladding causes the sensing devices to be fragile. The -number mismatch also creates loss of light—in particular, the emitted fluorescence light from the unsheathed sensing region is not guided inside the core, but leaks out to the cladding layer. Therefore, it will not be detected by the photodetector.2 The emergence of photonic crystal fibers (PCFs), especially hollow-core photonic bandgap fibers (HC-PBGFs), opens up new opportunities for novel evanescent wave biosensor design, which could solve the problems encountered in conventional biosensors.3, 4 HC-PBGFs are comprised of an air core with a cladding that consists of a two-dimensional (2-D) periodic array of air inclusions in silica. As indicated by their name, HC-PBGFs guide light in the air core within certain bandgaps, which manifest as transmission windows in the transmission spectrum. In particular, when aqueous solution is used to fill the holey region of HC-PBGFs, the transmission windows have a blue shift and could cover the wavelength ranges of fluorescence spectra.5, 6 The strong confinement of light in the aqueous core could provide a strong interaction between excitation light and analytes. Moreover, since the excitation light and the emitted fluorescent light are both confined to the core, their overlap is maximized. In this paper, the performance of the HC-PBGF for evanescent wave biosensing is analyzed. The principles of operation and performance analysis are described in Sec. 2. Experimental results and discussion are presented in Sec. 3, and a conclusion is given in Sec. 4. 2.Theory and Simulation ResultsThe structure of the HC-PBGF used in the experiment is illustrated in Fig. 1 and is designed to guide light in the wavelength range from . Following the designations, the photonic crystal (PC) cladding can be characterized by four parameters: hole-to-hole distance , hole diameter , and refractive indices in the holey regions and in the silica regions. The diameter of the hollow core is . According to the Beer-Lambert law, a crucial factor determining the amount being absorbed is the absorbance , which is defined as2 where and are the intensities before and after the sample, respectively. is the wavelength of light, and is called the molar extinction coefficient at wavelength . is the concentration of the sample. is the effective optical path defined by the length of the sample through which the light travels, supposing 100% overlap between light and sample. The transmission can be written simply as7For evanescent wave biosensors, only part of the guided light interacts with the sample. Therefore, the effective optical path length, which is determined by the fiber length and the sensitivity coefficient , is given by2 The sensitivity coefficient is an important parameter in quantifying the fiber efficiency, which is used to describe the overlap between the light and the sample. The fiber efficiency is a measure of the effective interaction length of a given optical fiber with length . It has a value of , where is the refractive index of the sensed material, is the modal effective index, and is the percentage of optical power in the holes. This corresponds to introducing effective interaction length , which is the section of fiber where the light and the sample have 100% overlap. The percentage of optical power in the holes is described as7 where and are the electric and magnetic fields along the and directions.The performance of the evanescent wave sensor is mainly determined by the modal effective index as well as the percentage of energy in the holes. Tedious numerical simulation is crucial to evaluate these two parameters in the conventional fiber design. This can be avoided for the HC-PBGFs by using refractive index scaling laws.6 The wave equation for the scalar field distribution in a HC-PBGF can be described in terms of normalized transverse coordinates and and an index distribution function.6 The resulting normalized scalar wave equation iswhere , and .The frequency parameter and eigenvalue are directly analogous to the parameters and of the conventional waveguide theory,8 with an exception that defines a transverse scale in a structure. The refractive index scaling law can be described as follows: If is varied, the scalar field distribution can be kept unchanged, supposing that the normalized wavelength is adjusted so as to keep the values of and invariant.6, 9 In particular, the locations of the transmission windows, after the HC-PBGF is filled with aqueous solution, can be estimated by considering the invariant . Assuming that the bandgap is originally at a wavelength for an air-guiding HC-PBGF with , after the fiber is filled with aqueous solution with , it shifts to a new wavelength . The relationship between the wavelengths and is governed by9 As the values of and are invariant, their ratio is also invariant. The modal effective index at the wavelength, after filling can thus be evaluated by the modal effective index at the wavelength before filling, which is given by Since the scalar wave distribution and are invariant when the bandgaps shift from a wavelength to a wavelength , the percentage of energy in Eq. 4 is also invariant, or These equations provide simple tools for estimating the efficiency of HC-PBGF–based biosensors by utilizing the parameters list in the product manual.In order to demonstrate this idea, Figs. 2a and 2b show the electric field distribution at before filling with water and after filling with water. A full vectorial beam propagation method was used to evaluate the electric fields with the parameters of , , , and before and after filling with water. As these two wavelengths satisfy the refractive index scaling law, their corresponding electric fields show no difference. The corresponding fractions of light propagating in the air holes or samples are both around 96%. The corresponding modal refractive indices are 0.9881 and 1.3267 when and , respectively, which also agrees well with the refractive index scaling law described in Eq. 9. The simple methods for estimating the value of and greatly facilitate the design procedure of HC-PBGF–based evanescent wave biosensors. 3.Experimental ResultsThe schematic diagram of the experimental setup is shown in Fig. 3 . A -long HC-PBGF (Crystal-Fiber HC-1550-02) was used in the experiment and had a cladding pitch of , a core diameter of , and a center operating wavelength of . Two ends of the HC-PBGF were mounted in modified V-groove mounts. Light from a supercontinuum (SC) source (KOHERAS SuperK Red) was guided using a single-mode fiber SMF-28, which in turn launched into the core of the PBGF via butt-coupling by using two pairs of three-dimensional (3-D) stages (Newport series). The alignment was achieved by tuning the high-resolution micrometers. When the maximum transmitted optical signal was obtained, the alignment was ready. The transmitted light after the HC-PBGF was guided by using another section of SMF-28 via butt-coupling again and then measured by using an optical spectrum analyzer (OSA; Yokogawa AQ6370), which can measure the spectrum from . The holey region of the HC-PBGF was filled up with the Alexa Fluor 700–labeled DNA Oligo solution (Invitrogen) by capillary force. Alexa Fluor 700 has an absorption maximum at with a molar extinction coefficient of . Fig. 3Schematic diagram of the experimental setup. (SC light source: supercontinuum light source; OSA: optical spectrum analyzer; PBGF: photonic bandgap fiber). 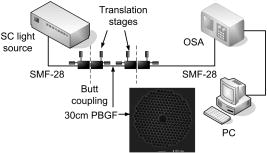 Figure 4 shows the transmission spectra before and after filling with pure water. The transmission spectrum before the filling process spanned a range of . After filling, the transmission spectrum ranged from . This range was broader than the prediction of the scaling law, which had a range from . This is because the refractive index scaling law is derived from scalar wave equations, which neglect the vectorial effects. Therefore, this refractive index scaling law shows a good accordance to the experimental results, especially in the small index contrast region. Deviations are found in the large index contrast region, where vectorial effects start to appear.5 However, this does not preclude the validity of the refractive index scaling law in evaluating the performance of the HC-PBGF, which was verified both in the theory and experiment. Another issue is that the modal effective index and fraction of power residing in the holes are related to the operating wavelength. However, as they show small variations across the wavelength ranges of the transmission windows, and are assumed to be invariant across the wavelength ranges of the transmission windows. The invariances of and make the analysis easy. Figure 5 shows the transmission spectra of two HC-PBGFs, one filled completely with a Alexa Fluor 700—labeled DNA Oligo solution and one with pure water. The inset shows the derived absorbance with a maximum value of 1.06 at . This could be evaluated by using Eq. 2 and the refractive index scaling law. Since only a fraction of light propagates in the sample, the effective optical path length is introduced to describe the absorbance . As , the fraction of power and the modal effective index should be known to obtain the value of . However, as described earlier, the refractive index scaling law provides a simple tool to evaluate these two parameters. The HC-PBGF used in the experiment has an effective mode index around 0.99, and the fraction of light propagating in air is around 95% at . Assuming that these two parameters are invariant across the wavelength ranges of the transmission windows, after the fiber is filled with aqueous solution with , the effective mode index is 1.3277, and the fraction of light propagating in the sample is 95%. As a result, the effective optical path length for a HC-PBGF is . Considering the molar extinction coefficient of at and the concentration of , the expected absorbance is 1.098, which is in good accordance with the measured value. Fig. 5Transmission spectra of two HC-PBGFs with a Alexa Fluor 700–labeled DNA solution (solid curve) and pure water for reference (dashed curve), respectively. Inset: derived absorbance in the sample containing the Alexa Fluor 700–labeled DNA Oligo solution.  Alexa Fluor 700–labeled DNA Oligo solutions that have concentrations of and were also used to evaluate the sensitivity of the HC-PBGF. The corresponding derived absorbances are illustrated in Fig. 6 and are in good agreement with the analytical results. The minimum detectable concentration is mainly limited by the minimum detectable absorbance. It has been demonstrated10 that the minimum detectable absorbance can be achieved to be . Therefore, for an HC-PBGF with a length of , this offers the possibility of detecting Alexa Fluor 700–labeled DNA Oligo solution with concentration down to , provided that the reference spectra are accurate and stable. With a small sample volume consumption of only , this offers the potential for the design of high-sensitivity evanescent wave biosensors. 4.DiscussionThe general theory for the HC-PBGF waveguides assumes a nonabsorbing material in the hollow-core region. This means that the dielectric constant is treated as purely real. Strong water absorption bands occur at wavelengths around 2500, 1950 and , with weaker absorption bands at wavelengths around 1200 and and three additional sets of water absorption lines near 930, 820, and . All are located in the infrared spectrum.11, 12 The existence of absorbing material, such as water, within the hollow core would be expected to modify the scaling laws as well as the effective mode index and the fraction of optical power. In order to illustrate the bandgap formation in the presence of the imaginary part of the refractive index, a beam propagation method (BPM)13, 14, 15 was carried out to model the complex waveguide by taking into account the real and imaginary parts of the refractive index of the water. Figure 7 shows the evaluated transmission spectra for the water-silica HC-PBGF. This was done by launching a Gaussian beam in the center of the core with width equal to that of the core and propagation length . Both scalar BPM and vector BPM were carried out in order to illustrate the vectorial effect on the bandgap formation. Comparison of the scalar and vector plots demonstrates the basic validity of the scaling laws. The deviation of vector band structure from the scalar case indicates features that arise specifically from the vector nature of the electromagnetic field. In particular, the scalar plot is relatively broader than the vector case, which is due to the overlapping of the bandgaps of two polarization components.6 This difference also explains the observation of the wavelength deviation reported by Ref. 5. In order to investigate whether the absorption of water modifies the bandgap, a vector BPM was performed by taking into account the imaginary parts of the refractive index of water. The data set of imaginary parts was obtained from Ref. 11. It is found that the transmission spectra, before and after considering the absorption of water, show little difference. There is only a slight fall of optical power around after considering the absorption. Therefore, it is the vectorial effect that causes the wavelength deviation observed in Ref. 5 rather than the absorption of water. The general theory for nonabsorbing material has been applied for several low-loss dielectric waveguide structures, such as the microstructured polymer fibers,16, 17 liquid-crystal photonic crystal fibers,18, 19, 20 and liquid-filled photonic crystal fibers.17, 21, 22 The effective mode indices of the fundamental modes and the fractions of optical power within the holey region at wavelengths of , , and are demonstrated in Table 1 . Comparisons of these values before and after considering the absorption of water demonstrate that the existence of water absorption barely changes the values of the effective mode indices and the fraction of optical power within the holey regions. The invariance indicates the basic validity of the scaling law in the presence of low-absorbing material. Table 1Effective mode indices and fractions of optical power at different wavelengths.
A number of PCF-based sensor applications have been demonstrated, especially in the area of biosensors. The majority of these applications take advantage of the unique possibility to position a given biological sample inside the holey regions of the fibers. The sample may, therefore, be probed by the light propagating along the fiber without removing the fiber coating and cladding, thus maintaining the robustness of the fiber. In contrast, the only possible approach of conventional optical fibers for sensing low refractive index materials is to use the evanescent field. However, the strength of the evanescent wave is generally small. To increase the amount of optical power in the sample of interest, several approaches can be applied. The general design rule is to remove the coating and cladding. These approaches thus add complexity and make the structure more fragile. A simpler approach is to use the fiber merely to guide the light to a chamber that contains the sample to be measured and where it is monitored in free space. However, this measurement is limited to short path lengths, due to practical limitations and the beam divergence. Compared with other PCF-based biosensors, such as the solid-core index-guiding PCF-based evanescent wave sensor, which has an evanescent field within the holes of 3.3% (Ref. 23), the demonstrated HC-PBGFs have the advantage of large overlap between the light and the sample residing in the holey areas, which is 28.8 times larger. This provides high efficiency for the evanescent wave biosensing applications. Fini has proposed a water-core PCF structure for biosensing applications, which is based on an index-guiding mechanism.21 Although it was possible to achieve 90% overlap between the light and the samples, this method required a selective filling technique,24, 25 which is a method to fill only some holes of the fiber, such as the central hollow core, rather than the entire holey region. In addition, the analysis and design procedure needed tedious numerical work. A similar method was also proposed by selective filling the hollow core with sample solution, but the guiding mechanism was based on the bandgap guiding.26 This method evidently experienced the same problems, including the selective filling process and the tedious numerical work. Another type of hollow-core PCF-based evanescent sensor was demonstrated by filling the entire holey region with samples.10 Although the fiber structures and filling technique seem similar, the guiding mechanisms were totally different. In Ref. 10, light was guided through the silica in the entire cladding rather than the hollow core. In other words, light was not guided by bandgap effects. Therefore, only a 5.2% fraction of optical power resided in the samples. This value was much smaller than the HC-PBGFs used in this experiment, which had an overlap of 95%. In addition, as the light dissipated in the cladding, the loss was significantly large, which also introduced the difficulty into the spectral measurement. The PBGF-based sensor has so far been tested in applications only as a nonspecific biosensor, which shows its potential to measure the concentration of a specific analyte solution. The use of the PBGF sensor to distinguish different solutions appears possible, assuming that a biorecognition element is immobilized on the inner surface of the holey region of the fiber by physical or chemical methods. One of the surface-binding PCF-based sensors uses streptavidin molecules (antigen) as a biorecognition element to detect a specific biomolecule, -streptavidin (antibody).27 This concept may be used for a variety of biodetection, such as various enzymes and antibodies. Another important practical consideration is the potential for the reuse of the HC-PBGF for multiple tests during semicontinuous on-line monitoring. For the demonstrated nonspecific sensing system, the HC-PBGF can be cleaned with acetone and isopropanol. The filling and cleaning processes can be achieved with the aid of a pressure chamber.28 A HC-PBGF–based sensor can be developed for detecting specific targets, for example, by depositing a sensor layer of complementary biomolecules immobilized inside the air holes of the HC-PBGFs. Regeneration of the HC-PBGF sensor for antibody-antigen detection is also possible, since many techniques have been demonstrated to dissociate antibody-antigen complexes, including pressure, electrical field, and solvents.1 The regeneration methods can thus follow those techniques that are commonly used in conventional fiber-optic biosensors. 5.ConclusionIn conclusion, the HC-PBGFs–based evanescent wave sensing technique has been analyzed both theoretically and experimentally. According to the refractive index scaling law, the modal effective index and fraction of optical power residing in the sample after filling process could be derived from the parameters before the filling process. This offers a simple method for both design and analysis procedures. In this type of sensor, light is confined to the central core, with more than 95% of light residing in the samples, which is verified by both theoretical and experimental results. With a small sample consumption of only , the measured absorbance for a -long fiber filled with a Alexa Fluor 700–labeled DNA Oligo solution is 1.06. Due to a large part of the evanescent wave residing in the sample, only a short section of HC-PBGF, long, is required to obtain high sensitivity. This greatly enhances the detection efficiency. In addition, this method does not require a selective filling technique, which further offers convenience for practical applications. ReferencesO. S. Wolfbeis,
“Fiber-optic chemical sensors and biosensors,”
Anal. Chem., 78 3859
–3873
(2006). https://doi.org/10.1021/ac060490z 0003-2700 Google Scholar
N. P. Prasad, Introduction to Biophotonics, John Wiley & Sons, Buffalo, NY
(2004). Google Scholar
J. C. Knight,
J. Broeng,
T. A. Birks, and
P. S. J. Russel,
“Photonic band gap guidance in optical fibers,”
Science, 282 1476
–1478
(1998). https://doi.org/10.1126/science.282.5393.1476 0036-8075 Google Scholar
P. Russell,
“Photonic crystal fibers,”
Science, 299 358
–362
(2003). https://doi.org/10.1126/science.1079280 0036-8075 Google Scholar
J. Sun,
C. C. Chan,
X. Y. Dong, and
P. Shum,
“High-resolution photonic bandgap fiber-based biochemical sensor,”
J. Biomed. Opt., 12 044022
–044026
(2007). https://doi.org/10.1117/1.2753439 1083-3668 Google Scholar
T. A. Birks,
D. M. Bird,
T. D. Hedley,
J. M. Pottage, and
P. S. Russell,
“Scaling laws and vector effects in bandgap-guiding fibres,”
Opt. Express, 12 69
–74
(2004). https://doi.org/10.1364/OPEX.12.000069 1094-4087 Google Scholar
C. M. B. Cordeiro,
M. A. R. Franco,
G. Chesini,
E. C. S. Barretto,
R. Lwin,
C. H. Brito Cruz, and
M. C. J. Large,
“Microstructured-core optical fibre for evanescent sensing applications,”
Opt. Express, 14 13056
–13066
(2006). https://doi.org/10.1364/OE.14.013056 1094-4087 Google Scholar
A. W. Snyder, and
J. D. Love, Optical Waveguide Theory, Chapman & Hall, London
(1983). Google Scholar
G. Antonopoulos,
F. Benabid,
T. A. Birks,
D. M. Bird,
J. C. Knight, and
P. S. J. Russell,
“Experimental demonstration of the frequency shift of bandgaps in photonic crystal fibers due to refractive index scaling,”
Opt. Express, 14 3000
–3006
(2006). https://doi.org/10.1364/OE.14.003000 1094-4087 Google Scholar
J. B. Jensen,
L. H. Pedersen,
P. E. Hoiby,
L. B. Nielsen,
T. P. Hansen,
J. R. Folkenberg,
J. Riishede,
D. Noordegraaf,
K. Nielsen,
A. Carlsen, and
A. Bjarklev,
“Photonic crystal fiber based evanescent-wave sensor for detection of biomolecules in aqueous solutions,”
Opt. Lett., 29 1974
–1976
(2004). https://doi.org/10.1364/OL.29.001974 0146-9592 Google Scholar
L. Kou,
D. Labrie, and
P. Chylek,
“Refractive indices of water and ice in the spectral range,”
Appl. Opt., 32 3531
–3540
(1993). 0003-6935 Google Scholar
F. M. Sogandares and
E. S. Fry,
“Absorption spectrum of pure water. I. photothermal measurements,”
Appl. Opt., 36 8699
–8709
(1997). 0003-6935 Google Scholar
A. K. Abeeluck,
N. M. Litchinitser,
C. Headley, and
B. J. Eggleton,
“Analysis of spectral characteristics of photonic bandgap waveguides,”
Opt. Express, 10 1320
–1333
(2002). 1094-4087 Google Scholar
W. P. Huang and
C. L. Xu,
“Simulation of 3-dimensional optical wave-guides by a full-vector beam-propagation method,”
IEEE J. Quantum Electron., 29 2639
–2649
(1993). https://doi.org/10.1109/3.250386 0018-9197 Google Scholar
N. M. Litchinitser,
S. C. Dunn,
P. E. Steinvurzel,
B. J. Eggleton,
T. P. White,
R. C. McPhedran, and
C. M. de Sterke,
“Application of an arrow model for designing tunable photonic devices,”
Opt. Express, 12 1540
–1550
(2004). https://doi.org/10.1364/OPEX.12.001540 1094-4087 Google Scholar
M. A. van Eijkelenborg,
M. C. J. Large,
A. Argyros,
J. Zagari,
S. Manos,
N. A. Issa,
I. Bassett,
S. Fleming,
R. C. McPhedran,
C. M. de Sterke, and
N. A. P. Nicorovici,
“Microstructured polymer optical fiber,”
Opt. Express, 9 319
–327
(2001). 1094-4087 Google Scholar
F. M. Cox,
A. Argyros, and
M. C. J. Large,
“Liquid-filled hollow core microstructured polymer optical fiber,”
Opt. Express, 14 4135
–4140
(2006). https://doi.org/10.1364/OE.14.004135 1094-4087 Google Scholar
T. T. Larsen,
A. Bjarklev,
D. S. Hermann, and
J. Broeng,
“Optical devices based on liquid crystal photonic bandgap fibers,”
Opt. Express, 11 2589
–2596
(2003). 1094-4087 Google Scholar
T. T. Alkeskjold,
J. Laegsgaard,
A. Bjarklev,
D. S. Hermann,
A. Anawati,
J. Broeng,
J. Li, and
S. T. Wu,
“All-optical modulation in dye-doped nematic liquid crystal photonic bandgap fibers,”
Opt. Express, 12 5857
–5871
(2004). https://doi.org/10.1364/OPEX.12.005857 1094-4087 Google Scholar
J. Sun and
C. C. Chan,
“Effect of liquid crystal alignment on bandgap formation in photonic bandgap fibers,”
Opt. Lett., 32 1989
–1991
(2007). https://doi.org/10.1364/OL.32.001989 0146-9592 Google Scholar
J. M. Fini,
“Microstructure fibers for optical sensing in gases and liquids,”
Meas. Sci. Technol., 15 1120
–1128
(2004). https://doi.org/10.1088/0957-0233/15/6/011 0957-0233 Google Scholar
J. Sun,
C. C. Chan,
P. Shum, and
C. L. Poh,
“Experimental analysis of spectral characteristics of antiresonant guiding photonic crystal fibers,”
Opt. Lett., 33 809
–811
(2008). https://doi.org/10.1364/OL.33.000809 0146-9592 Google Scholar
C. Martelli,
J. Canning,
D. Stocks, and
M. J. Crossley,
“Water-soluble porphyrin detection in a pure-silica photonic crystal fiber,”
Opt. Lett., 31 2100
–2102
(2006). 0146-9592 Google Scholar
Y. Y. Huang,
Y. Xu, and
A. Yariv,
“Fabrication of functional microstructured optical fibers through a selective-filling technique,”
Appl. Phys. Lett., 85 5182
–5184
(2004). https://doi.org/10.1063/1.1828593 0003-6951 Google Scholar
C. M. B. Cordeiro,
E. M. dos Santos,
C. H. B. Cruz,
C. J. S. de Matos, and
D. S. Ferreira,
“Lateral access to the holes of photonic crystal fibers—selective filling and sensing applications,”
Opt. Express, 14 8403
–8412
(2006). https://doi.org/10.1364/OE.14.008403 1094-4087 Google Scholar
S. Smolka,
M. Barth, and
O. Benson,
“Highly efficient fluorescence sensing with hollow core photonic crystal fibers,”
Opt. Express, 15 12783
–12791
(2007). https://doi.org/10.1364/OE.15.012783 1094-4087 Google Scholar
J. B. Jensen,
P. E. Hoiby,
G. Emiliyanov,
O. Bang,
L. H. Pedersen, and
A. Bjarklev,
“Selective detection of antibodies in microstructured polymer optical fibers,”
Opt. Express, 13 5883
–5889
(2005). https://doi.org/10.1364/OPEX.13.005883 1094-4087 Google Scholar
L. Rindorf,
J. B. Jensen,
M. Dufva,
L. H. Pedersen,
P. E. Hoiby, and
O. Bang,
“Photonic crystal fiber long-period gratings for biochemical sensing,”
Opt. Express, 14 8224
–8231
(2006). https://doi.org/10.1364/OE.14.008224 1094-4087 Google Scholar
|
|||||||||||||||||||||||||