
|
|
1.IntroductionEpidemiological studies show a link between poor fetal growth and heart disease in adult life.1, 2, 3, 4 Understanding the mechanisms of cardiomyocyte development in late gestation is important in preventing cardiovascular disease in fetuses where heart development is altered due to reduced substrate supply leading to fetal adaptations.5, 6, 7 In early gestation, cardiomyocytes are mononucleated and contribute to heart growth by proliferation. During the last third of gestation in the human and sheep, mononucleated cardiomyocytes transition to the terminally differentiated binucleated cardiomyocytes, which contribute to heart growth by hypertrophy.8, 9 The signal for binucleation is unclear; however, it is known that karyokinesis occurs but an increased myofibrillar density prevents cytokinesis.8 Thus, a technique for quantifying changes in both the cardiomyocyte volume and the level of myosin filaments across late gestation in isolated cells is required. We propose that advanced nonlinear optical imaging techniques can be used to perform high-quality quantitation of cardiomyocyte and myosin volume with minimal sample preparation and at a lower cost compared to other methods. Multiphoton or nonlinear optical (NLO) imaging techniques are attracting much interest currently because of their applications in biological imaging.10, 11, 12, 13, 14, 15 In these imaging techniques, the signals are generated in the focal region exclusively, and hence they offer inherent 3-D resolution. This effect also gives rise to a reduced level of photodamage.13 In addition, many of the NLO imaging techniques have molecular specificity; 10, 11, 12, 14, 15, 16, 17, 18, 19 for instance, second-harmonic generation (SHG) microscopy has been used extensively to visualize several intracellular structures including myofibrils11, 16, 17, 18 and collagen fibrils12, 15, 19 in unstained samples. For myofibril imaging with SHG microscopy, recent important work by Plotnikov clearly identifies myosin filaments as the source of signals.11 In short, the NLO imaging techniques with molecular specificity permits quantitative imaging to be performed on unstained samples, including live cells in a continuous culture.14 Several questions must be answered before the goal of live cell imaging can be achieved. For example, the process of isolating fetal cardiomyocytes from a species where heart development occurs with a similar timeline to the human20, 21 requires a large investment.7, 9, 22 Thus, isolated cells are usually fixed and cell size measures are made after a period of time. In some cases, isolated cardiomyocytes are cultured for several days to investigate the molecular mechanisms of proliferative and hypertrophic growth, fixed and then analyzed.7, 23, 24 Others have utilized electron microscopy to measure myofibrillar density,25 confocal fluorescence microscopy to measure volume,8 or light microscopy to measure cell length and width.7, 9, 22, 23, 24, 25 Each of these techniques has strengths such as high resolution, quantitative capacity, or use of common laboratory equipment, but each also requires extensive preparation such as staining prior to image collection. Although some of these techniques offer visualization of specific cellular structures in cardiomyocytes, the nature of immunohistochemistry makes these methods semiquantitative, particularly for myofilament concentration. A significant advantage of SHG microscopy over previous techniques is that the inherent specificity toward myosin filaments enables quantitative analysis.11, 16, 17 In the SHG process, two photons of frequency mix in the sample to generate a third photon precisely of frequency . It is well known that only materials with a noncentrosymmetric molecular/crystal structure are capable of generating SHG signals. In another NLO process, two-photon excitation fluorescence (TPEF), two photons of frequency are simultaneously absorbed to promote the molecules from the ground state to the excited state. In the relaxation of the excited molecule, a photon of frequency , where , is emitted via fluorescence. In this paper, we demonstrate that it is crucial to obtain the SHG and TPEF images of cardiomyocytes simultaneously—the TPEF image enables the determination of cell volume and discrimination between mononucleated and binucleated cardiomyocytes, whereas SHG microscopy is used to image the myofibrillar structure and quantify the intracellular level of myosin filaments. 2.Experimental SectionThe cardiomyocytes used in this study were isolated from three sheep fetuses at 138, 139, and of gestation, where term is . Within this gestational period, the fetal heart has both mononucleated and binucleated cardiomy ocytes.21, 25 Cardiomyocytes were arrested in diastole prior to isolation by reverse perfusion of the heart via the aorta with saturated KCl.7 Using a previously published method, cardiomyocytes were isolated and fixed in a 1% paraformaldehyde solution for storage.7 Approximately of solution containing cardiomyocytes was deposited onto a glass slide. The slides were examined using the imaging system described as follows. The SHG/TPEF imaging system employed a mode-locked Ti:sapphire laser (Coherent Mira 900F) pumped by a laser (Coherent Verdi). The pulse width, repetition rate, and central wavelength are , , and , respectively. The beam was directed into a multiphoton microscopy system (Leica TCS2MP) equipped with an inverted microscope (Leica DMIRBE) and focused onto the sample using a , plan apochromat, numerical aperture , oil immersion objective (Leica 506180). The laser power was approximately , and a fixed laser polarization was used. An oil immersion condenser was used to collect the emitted signals in the forward propagating direction. A dichroic mirror was used to split the signals into the SHG and TPEF components. Dual photomultiplier tubes (Hamamatsu R6357) were used to collect the SHG and TPEF signals simultaneously. A bandpass filter at (F1) was used for the SHG signal and a bandpass filter (F2) for the TPEF signal. Bidirectional scanning was enabled to reduce image acquisition time and the image resolution was . Image analyses were performed using ImageJ (http://rsb.info.nih.gov/ij/) and relevant plugins (voxel counter and iterative deconvolve 3-D). Live cell imaging was performed on 600 cardiomyocytes (equal number of live and fixed) using an upright microscope (Olympus CX40) with a , objective (Olympus). Approximately of solution containing cardiomyocytes was deposited onto a glass slide as well as of methylene blue to visualize the nuclei. The average length and width were measured from tip to tip and across the middle section of the cell, respectively. 3.Results and DiscussionThe TPEF and SHG images of a mononucleated cardiomyocyte are shown in Fig. 1 . The TPEF signal is due to the autofluorescence that arises when an aldehyde-based fixative is used to preserve cells. In this case, paraformaldehyde binds uniformly to the amine groups and cross-links with cellular proteins, resulting in autofluorescence signals that are nonspecific to cellular matter, and thus is capable of showing cell morphology. In Fig. 1a, the general morphology of the cardiomyocyte is visible and it is obvious that this cell is mononucleated, with the location of the nucleus clearly resolved in the TPEF image. In the SHG image of this mononucleated cardiomyocyte [Fig. 1b], however, the myosin filaments are clearly resolved but the presence of the nucleus is not. These results clearly signify the benefit of simultaneous collection of the TPEF and SHG images in visualization of cell morphology, effective identification of the mononucleated cardiomyocytes, and imaging of myosin filaments. The TPEF and SHGimages of two binucleated cardiomyocytes are shown in Fig. 2 . The two nuclei of the cardiomyocytes are clearly identifiable in the TPEF image. On the contrary, the nuclei are not nearly as visible in the complementary SHG image. These results further demonstrate the benefit of this multimodal imaging approach. Fig. 1Image of a mononucleated cardiomyocyte using the signal of (a) TPEF and (b) SHG. Scale bar is . The nucleus is not visible in the SHG image. The images were line averaged and frame averaged . The scan speed and pixel dwell time were and , respectively.  Fig. 2Two isolated binucleated cardiomyocytes as imaged with (a) TPEF and (b) SHG. Scale bar is . The location and number of nuclei in the SHG image are unclear when contrasted with the TPEF image. The imaging acquisition parameters are identical to those in Fig. 1. 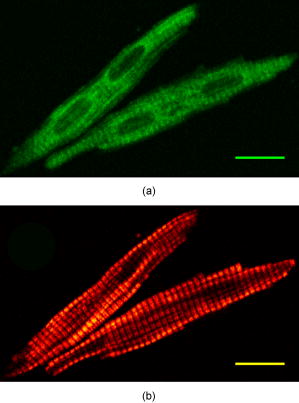 Previous studies have reported a strong dependence of the SHG signal intensity of myosin filaments on laser polarization.11, 18 In particular, a considerable difference in signal intensity was observed when polarization was changed by . The SHG images in our studies also exhibit polarization dependence (images not shown), but care was taken to image the cardiomyocytes only with an orientation that produces a high level of SHG signal intensity within a specimen. Additionally, all the imaged cardiomyocytes show well-aligned myosin filaments (approximately on average in variation) because the treatment with saturated KCl in the sample preparation process resulted in full relaxation of the cardiomyocyte. In short, the effect of laser polarization on the results reported herein is minor. Three-dimensional TPEF and SHG imaging were performed to determine cell volume and the intracellular level of myosin filaments, respectively. High-resolution image stacks of a mononucleated and a binucleated cardiomyocyte (images not shown), were obtained with lateral spacings of 0.26 and , respectively, and axial spacings of 0.51 and , respectively. For cell volume determination, we used the method established previously by Burrell, 8 which makes use of the well-resolved background and signal peaks in the intensity histogram of the image. The threshold is set at the minimum between the two peaks to assign the image pixels that represent cell volume. Using this method, the volumes of these cardiomyocytes were found to be (left ventricle, ) and (right ventricle, ), respectively. There is a uncertainty in each pixel intensity value due to digitization of the signal and a uncertainty in determining a threshold value. Therefore, the uncertainty in the cell volumes was estimated by varying the intensity threshold setting by . While the large uncertainty of the mononucleated cardiomyocyte volume is attributed to the relatively low signal-to-noise ratio (SNR) in this image stack, these results are in agreement with previously reported values. The range of expected cell volumes for mononucleated and binucleated cardiomyocytes at gestation as reported by Burrell are (left ventricle, 140d) and 7435±2481 μm3 (right ventricle, 140d), respectively.8 Additionally, the effect of image deconvolution on the determined volumes was investigated with a point spread function (0.27 and in lateral and axial resolutions, respectively) generated using the experimental conditions. The analysis shows that volume determination using the deconvoluted image stack produces similar results. The lack of effect of image deconvolution is expected because the dimensions of the cardiomyocytes (Figs. 1 and 2) are significantly greater than those of the point spread function. To achieve accurate cell volume measurements using TPEF imaging, the SNR is an important factor to consider. The expression of SNR for microscopy images is given26 as , where , and are the standard deviation of a region of interest containing only signal and only background noise, respectively. Note that both and can be determined from the intensity histogram of the regions of interest. In our studies, we determined that frame averaging has the largest effect on improving the SNR of the TPEF image; the SNR is less sensitive to other imaging parameters including laser power and pixel dwell time. Furthermore, a series of images of a cardiomyocyte were acquired by varying the number of frames to be averaged while keeping other experimental parameters constant. The cell area, relative errors in the measurements, and the SNR were quantified. The results indicate that the minimum SNR required for an accurate measurement of cell volume is 4.2. As mentioned in the experimental section, the cardiomyocytes used in our studies were fixed in a 1% paraformaldehyde solution. A potential issue with fixation is the reduction in cell size due to dehydration in the paraformaldehyde-induced protein cross-linking process. To address this issue, we performed detailed studies and the results show that the live and fixed binucleated cells had average lengths of and (unpaired test, ), respectively. The average widths of the live and fixed binucleated cells were found to be and , respectively. For live and fixed mononucleated cardiomyocytes, the average lengths were determined to be and , respectively. The average widths (measured across the nuclei) were found to be and , respectively. Using these results, the extents of cell deformation are estimated to be approximately 4 and 6% decreases in length and 11 and 8% decreases in width of binucleated and mononucleated cardiomyocytes, respectively. Using a model that treats the average cardiomyocyte as a prolate spheroid, the estimated change in volume was found to be between live and fixed cells. The high sensitivity and specificity of SHG toward myosin filaments are ideal for quantification of these filaments in cardiomyocytes. To quantify the level of myosin filaments accurately, the following analysis method was used. First, the SHG image stack was deconvolved using the point spread function already described. This analysis is crucial because the diameter of the myosin filament is similar to the axial resolution of the point spread function (PSF). Note that deconvolution of the SHG image will yield only the estimated myosin filament morphology because the PSF, which was obtained by accounting for the fluorescence signals, can only approximate the SHG resolution. Second, to reject the background intensity in the image stack, the threshold was set such that 99.95% of the signal on average was rejected in the topmost and bottommost slices, since these slices contain exclusively background. Using this method, the number of pixels that represent the SHG signals can be determined. With the lateral and axial spacings just specified, the volumes of myosin filaments of the mononucleated and binucleated cardiomyocytes were determined to be and , respectively, where the uncertainty was estimated by varying the intensity threshold setting by . The ratio between the volume of myosin filaments and the cardiomyocyte volume yields the estimated intracellular myosin filament contents by this imaging technique, which are and for the mononucleated and binucleated cardiomyocytes, respectively, in this study. These values are in agreement with previous investigations based on other techniques.25, 27 To the best of our knowledge, this paper is the first demonstration of quantitative determination of the myosin filament content using TPEF and SHG microscopy. 4.ConclusionWe demonstrated a multimodal imaging technique that involves simultaneous collection of the TPEF and SHG images of cardiomyocytes. This technique offers a highly quantitative method to determine cardiomyocyte volume and the myosin filament content. In addition, the TPEF images provide clear separation of the mononucleated and binucleated cardiomyocytes, and SHG microscopy offers high-contrast images of myosin filaments in cardiomyocytes. Future work using the technique reported herein will involve investigations of cell volume as a function of gestational age, investigation into the effect of altered fetal growth on cardiomyocyte volume, cell morphology, and myosin filament density, and the effect of hypertrophic agents on myosin filament density in a cell culture system. AcknowledgmentsJLM was supported by Fellowships from the Heart Foundation of Australia (PF03A1283 and CR 07A 3328) and the National Health and Medical Research Council (511341). The authors thank Min-Chul Kim for assistance in data analysis, Aaron Wong for assistance in live cell measurements, Ellie Kable and Renee Whan for help in microscopy, and Prof. I. C. McMillen and Dr. M. Wallwork for vigorous scientific discussions. This work was financially supported in part by the Australian Research Council and National Health and Medical Research Council Network “Fluorescence Applications in Biotechnology and Life Sciences.” ReferencesD. J. P. Barker,
P. D. Winter,
C. Osmond,
B. Margetts, and
S. J. Simmonds,
“Weight in infancy and death from ischemic heart-disease,”
Lancet, 577
(8663), 577
–580
(1989). 0140-6736 Google Scholar
J. G. Eriksson,
T. Forsen,
J. Tuomilehto,
C. Osmond, and
D. J. P. Barker,
“Early growth and coronary heart disease in later life: longitudinal study,”
Br. Med. J., 322
(7292), 949
–953
(2001). 0007-1447 Google Scholar
J. G. Eriksson,
“Early growth, and coronary heart disease and type 2 diabetes: experiences from the Helsinki Birth Cohort Studies,”
Int. J. Obes., 30 S18
–S22
(2006). 0307-0565 Google Scholar
H. E. Syddall,
A. A. Sayer,
S. J. Simmonds,
C. Osmond,
V. Cox,
E. M. Dennison,
D. J. P. Barker, and
C. Cooper,
“Birth weight, infant weight gain, and cause-specific mortality—The Hertfordshire cohort study,”
Am. J. Epidemiol., 161
(11), 1074
–1080
(2005). 0002-9262 Google Scholar
K. J. Bubb,
M. L. Cock,
M. J. Black,
M. Dodic,
W. M. Boon,
H. C. Parkington,
R. Harding, and
M. Tare,
“Intrauterine growth restriction delays cardiomyocyte maturation and alters coronary artery function in the fetal sheep,”
J. Physiol. (London), 578
(3), 871
–881
(2007). 0022-3751 Google Scholar
S. Louey,
S. S. Jonker,
G. D. Giraud, and
K. L. Thornburg,
“Placental insufficiency decreases cell cycle activity and terminal maturation in fetal sheep cardiomyocytes,”
J. Physiol. (London), 580
(2), 639
–648
(2007). 0022-3751 Google Scholar
J. L. Morrison,
K. J. Botting,
J. L. Dyer,
S. J. Williams,
K. L. Thornburg, and
I. C. McMillen,
“Restriction of placental function alters heart development in the sheep fetus,”
Am. J. Physiol. Regulatory Integrative Comp. Physiol., 293
(1), R306
–R313
(2007). 0363-6119 Google Scholar
J. H. Burrell,
A. M. Boyn,
V. Kumarasamy,
A. Hsieh,
S. I. Head, and
E. R. Lumbers,
“Growth and maturation of cardiac myocytes in fetal sheep in the second half of gestation,”
Anat. Rec. A Discov. Mol. Cell. Evol. Biol., 274A
(2), 952
–961
(2003). Google Scholar
S. S. Jonker,
L. B. Zhang,
S. Louey,
G. D. Giraud,
K. L. Thornburg, and
J. J. Faber,
“Myocyte enlargement, differentiation, and proliferation kinetics in the fetal sheep heart,”
J. Appl. Physiol., 102
(3), 1130
–1142
(2007). 8750-7587 Google Scholar
J. X. Cheng and
X. S. Xie,
“Coherent anti-Stokes Raman scattering microscopy: Instrumentation, theory, and applications,”
J. Phys. Chem. B, 108
(3), 827
–840
(2004). https://doi.org/10.1021/jp035693v 1089-5647 Google Scholar
S. V. Plotnikov,
A. C. Millard,
P. J. Campagnola, and
W. A. Mohler,
“Characterization of the myosin-based source for second-harmonic generation from muscle sarcomeres,”
Biophys. J., 90
(2), 693
–703
(2006). https://doi.org/10.1529/biophysj.105.071555 0006-3495 Google Scholar
A. Zoumi,
A. Yeh, and
B. J. Tromberg,
“Imaging cells and extracellular matrix in vivo by using second-harmonic generation and two-photon excited fluorescence,”
Proc. Natl. Acad. Sci. U.S.A., 99
(17), 11014
–11019
(2002). https://doi.org/10.1073/pnas.172368799 0027-8424 Google Scholar
W. Denk,
J. H. Strickler, and
W. W. Webb,
“2-photon laser scanning fluorescence microscopy,”
Science, 248
(4951), 73
–76
(1990). https://doi.org/10.1126/science.2321027 0036-8075 Google Scholar
X. L. Nan,
J. X. Cheng, and
X. S. Xie,
“Vibrational imaging of lipid droplets in live fibroblast cells with coherent anti-Stokes Raman scattering microscopy,”
J. Lipid Res., 44
(11), 2202
–2208
(2003). https://doi.org/10.1194/jlr.D300022-JLR200 0022-2275 Google Scholar
W. R. Zipfel,
R. M. Williams,
R. Christie,
A. Y. Nikitin,
B. T. Hyman, and
W. W. Webb,
“Live tissue intrinsic emission microscopy using multiphoton-excited native fluorescence and second harmonic generation,”
Proc. Natl. Acad. Sci. U.S.A., 100
(12), 7075
–7080
(2003). https://doi.org/10.1073/pnas.0832308100 0027-8424 Google Scholar
T. Boulesteix,
E. Beaurepaire,
M. P. Sauviat, and
M. C. Schanne-Klein,
“Second-harmonic microscopy of unstained living cardiac myocytes: measurements of sarcomere length with accuracy,”
Opt. Lett., 29
(17), 2031
–2033
(2004). https://doi.org/10.1364/OL.29.002031 0146-9592 Google Scholar
P. J. Campagnola,
A. C. Millard,
M. Terasaki,
P. E. Hoppe,
C. J. Malone, and
W. A. Mohler,
“Three-dimensional high-resolution second-harmonic generation imaging of endogenous structural proteins in biological tissues,”
Biophys. J., 82
(1), 493
–508
(2002). 0006-3495 Google Scholar
S. Plotnikov,
V. Juneja,
A. Isaacson,
W. Mohler, and
P. Campagnola,
“Optical clearing for improved contrast in second harmonic generation Imaging of skeletal muscle,”
Biophys. J., 90
(1), 328
–339
(2006). https://doi.org/10.1529/biophysj.105.066944 0006-3495 Google Scholar
R. Williams,
W. Zipfel, and
W. Webb,
“Interpreting second-harmonic generation images of collagen I fibrils,”
Biophys. J., 88
(2), 1377
–1386
(2005). https://doi.org/10.1529/biophysj.104.047308 0006-3495 Google Scholar
C. P. Adler and
U. Costabel,
“Myocardial DNA and cell number under the influence of cytostatics. 1. Post-mortem investigations of human hearts,”
Virchows Arch. B, 32
(2), 109
–125
(1980). 0340-6075 Google Scholar
E. A. Woodcock and
S. J. Matkovich,
“Cardiomyocytes structure, function and associated pathologies,”
Int. J. Biochem. Cell Biol., 37
(9), 1746
–1751
(2005). 1357-2725 Google Scholar
S. S. Jonker,
J. J. Faber,
D. F. Anderson,
K. L. Thornburg,
S. Louey, and
G. D. Giraud,
“Sequential growth of fetal sheep cardiac myocytes in response to simultaneous arterial and venous hypertension,”
Am. J. Physiol. Regulatory Integrative Comp. Physiol., 292
(2), R913
–R919
(2007). 0363-6119 Google Scholar
N. C. Sundgren,
G. D. Giraud,
J. M. Schultz,
M. R. Lasarev,
P. J. S. Stork, and
K. L. Thornburg,
“Extracellular signal-regulated kinase and phosphoinositol-3 kinase mediate IGF-1 induced proliferation of fetal sheep cardiomyocytes,”
Am. J. Physiol. Regulatory Integrative Comp. Physiol., 285
(6), R1481
–R1489
(2003). 0363-6119 Google Scholar
N. C. Sundgren,
G. D. Giraud,
P. J. S. Stork,
J. G. Maylie, and
K. L. Thornburg,
“Angiotensin II stimulates hyperplasia but not hypertrophy in immature ovine cardiomyocytes,”
J. Physiol. (London), 548
(3), 881
–891
(2003). 0022-3751 Google Scholar
A. Barbera,
G. D. Giraud,
M. D. Reller,
J. Maylie,
M. J. Morton, and
K. L. Thornburg,
“Right ventricular systolic pressure load alters myocyte maturation in fetal sheep,”
Am. J. Physiol. Regulatory Integrative Comp. Physiol., 279
(4), R1157
–R1164
(2000). 0363-6119 Google Scholar
T. Sijbers,
P. Scheunders,
D. Van Dyck, and
E. Raman,
“Quantification and improvement of signal-to-noise ratio in a magnetic resonance image acquisition procedure,”
Magn. Reson. Imaging, 14
(10), 1157
–1163
(1996). https://doi.org/10.1016/S0730-725X(96)00219-6 0730-725X Google Scholar
L. D. Yates and
M. L. Greaser,
“Quantitative-determination of myosin and actin in rabbit skeletal-muscle,”
J. Mol. Biol., 168
(1), 123
–141
(1983). 0022-2836 Google Scholar
|


