
|
|
1.IntroductionSince its introduction in 1990 by Denk,1 two-photon excitation fluorescence (TPEF) microscopy has become a valuable tool for high-resolution imaging in living tissue. It is well recognized that multiphoton excitation based microscopy has a number of advantages over single-photon excitation techniques, including confocal capability without a pinhole; greater penetration depth; and minimal, spatially confined photodamage.2, 3, 4, 5, 6 However, the full potential of ultrashort laser pulses with adaptive pulse compression remains largely unexploited in multiphoton microscopy (MPM). Within certain limits, TPEF efficiency, i.e., the number of produced TPEF photons per given laser pulse energy at the sample, depends linearly on the inverse of the laser pulse duration, as illustrated in Fig. 1 . Previously available pulse durations were limited to ; however, one can now purchase laser systems that produce pulses an order of magnitude shorter. Despite the advances in ultrafast laser technology, most research groups and instrument manufacturers still use the same pulse durations as those available in the 1990s. In this paper, the use of pulse duration as an optimization parameter for TPEF microscopy is discussed in detail. We review advantages and disadvantages of using ultrashort laser pulses in MPM. We elaborate on the compensation of phase distortions introduced by the microscope optical train, including high numerical aperture (NA) optics. We describe a two-photon laser-scanning microscope setup that delivers sub- pulses at the focus of a high-NA microscope objective, and finally, demonstrate the efficiency of the implemented phase compensation scheme when applied to TPEF microscopy and second harmonic generation (SHG) imaging. This work concentrates on improving nonlinear optical imaging by reducing pulse duration; the effect of ultrashort pulses on photobleaching7, 8, 9 and photodamage10, 11 will be reported elsewhere. Fig. 1Expected dependence of TPEF intensity on laser pulse duration, assuming the system response is instantaneous (i.e., two-photon absorption efficiency is the same throughout the pulse spectrum) and laser pulses are transform-limited. Inset: TPEF imaging of a commercial mouse kidney slide (Molecular Probes, F-24630) with and laser pulses. The average laser power on the sample and other acquisition parameters are the same. The excitation spectra are centered at . The objective used is Zeiss LD C-Apochromat 40x/1.1 NA. The net gain in signal is about 8-fold. 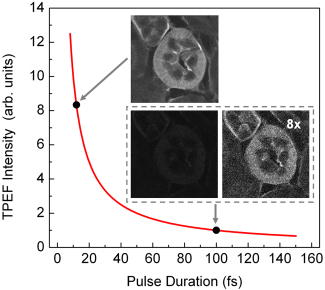 2.Optimal Pulse Duration for Two-Photon ExcitationAs dictated by the inverse relation between time and energy, the shorter the pulse duration, the broader the pulse spectrum. For a Gaussian, transform-limited (TL) laser pulse, the time-bandwidth product is known to be , which corresponds to if the laser spectrum is centered at . From the last expression it follows that the spectrum of a pulse has a full width at half maximum (FWHM) of . This observation has been used to imply that such pulses would exceed the width of the absorption spectrum of most fluorophores of interest and are therefore not practical for MPM.4 That conclusion, however, misses two important points. First, two-photon absorption (TPA) spectra of most dye molecules and quantum dots do not exhibit discrete, well-isolated resonant peaks like their single-photon absorption spectra. TPA spectra usually extended to shorter wavelengths.12 This is one of the reasons why two-photon excitation (TPE) can be used to activate a broad range of fluorophores with a single laser source. Note that TPE is defined entirely by the laser pulses used, while TPA depends on molecular properties. Second, the effective FWHM bandwidth of TPE for a Gaussian pulse is smaller than the spectral bandwidth of the input radiation because of the quadratic dependence of the excitation probability on the laser intensity. The total yield of TPEF is proportional to the integrated product of the two-photon cross-section , where is the frequency, and the spectral intensity of the so-called two-photon field, i.e., Here, , and is the electric field strength of the light interacting with fluorophores, which is related to the spectral intensity and phase of the incoming pulse asIf the pulse is not too short, i.e., the TPE spectrum is narrower than the TPA spectrum, one can substitute in Eq. 1 with a constant, and the yield becomes just proportional to the integral under the spectrum of the effective two-photon field intensity. For a TL Gaussian pulse having the spectral intensity profile , where is the carrier frequency and is the FWHM bandwidth, one can obtain a simple analytical relation between the spectral bandwidths of the incoming pulse and the profile, (in the wavelength domain, it takes the form ). At the fundamental frequency, the TPE bandwidth is . The same relation holds for and .Table 1 summarizes the calculated bandwidths of the incoming radiation, TPE, and two-photon field intensity for a few different FWHM time durations of a TL Gaussian laser pulse centered spectrally at . The respective two-photon field intensity spectra are plotted in the inset of Fig. 2 . The TPA spectrum of cyan fluorescent protein (CFP) is given as an example. One can infer that even for a wide absorption band, the use of laser pulses 10-fold shorter than is beneficial and would produce the expected linear increase in the excitation efficiency. However when the TPE bandwidth becomes comparable with the bandwidth of TPA, the dependence deviates from linear and eventually reaches an asymptotic maximum. Fig. 2TPA efficiency as a function of the TL pulse duration (as a measure of available spectral bandwidth), calculated for CFP when pulses are TL (solid red line); laser pulses have a GDD of (dotted blue line); and laser pulses have a TOD of (dashed green line). The values are normalized on TPA efficiency for TL pulses. Inset: Calculated two-photon field intensity spectra for different laser pulse durations (black lines). The pulses are assumed to be TL, having the Gaussian profile. The TPA spectrum of CFP, adapted from Ref. 4, is shown in red. (Color online only.)  Finally, note that femtosecond lasers have historically been expensive and difficult to operate. For a long time, the generation of ultrashort pulses has been a task reserved for highly specialized research groups that focused on laser development. This paradigm has changed dramatically in the last few years. Today, several companies offer single-box laser systems capable of producing pulses (for example, Coherent, CA; KMLabs, Boulder, CO; FemtoLasers, Vienna, Austria). These systems are simpler, more stable, and less expensive than the standard pulse lasers presently used for TPEF microscopy. The stability comes from the fact that the nonlinear Kerr-lens mode-locking process is more pronounced for shorter pulses. Since these laser systems have a broad spectral bandwidth, there is less of a need to make them tunable; therefore, they have fewer parts. The use of chirped mirrors instead of prisms in some models allows for a more compact design.13, 14 3.Compensation of Phase DistortionsThis section addresses the problem of spectral phase distortions introduced by microscope objectives and other dispersive components of the optical train. It is a common practice to distinguish the first two orders of dispersion, group delay dispersion (GDD) and third-order dispersion (TOD), which correspond respectively to and in the Taylor series expansion of the pulse spectral phase about the carrier frequency : GDD causes different frequency components of the pulse to arrive at the sample at different times, effectively increasing the pulse duration, while TOD breaks the pulse into subpulses. A typical high-NA microscope objective introduces of GDD and of TOD.15, 16 This amount of nonlinear spectral phase distortion is sufficient to broaden a pulse to more than one picosecond; however, with pre-compensation, it is possible to deliver the pulse to the sample. A simple prism pair can compensate for GDD. Such a correction would cause a modest increase in signal when using pulses instead of pulses of the same energy. Unfortunately, the prism pair introduces a significant amount of additional TOD. Only by correcting for both GDD and TOD to ensure TL pulses (i.e., pulses with no dispersion) would result in the expected 15× improvement in signal for two-photon microscopy. In this estimation, we used only GDD and TOD to give an approximate idea of how phase distortions reduce signal. In our system, high-order distortions beyond TOD account for an additional factor of 3. The higher terms that need to be corrected are fourth, fifth, and sixth order, and there is no simple arrangement of prisms and/or gratings that can correct for them.We performed a simulation for CFP where the efficiency of TPA was investigated as a function of pulse duration. The results are summarized in Fig. 2. Here we refer to FWHM pulse duration when the pulses are TL; the actual parameter is their spectral bandwidth. For this simulation we first considered broadening of a TL pulse spectrum. Since the pulse energy is fixed, the increase in peak intensity resulted in a 17× increase in TPA efficiency from (solid red line). On the other hand, tuning a narrowband laser exactly on resonance with the TPA of CFP would lead to the signal enhancement by only a factor of 2. Therefore, a 10-fold improvement due to shortening the excitation pulse is still expected. When TOD is not corrected, spectrally broader pulses no longer assure greater TPA efficiency (dashed green line). Finally, uncorrected GDD leads to the monotonous decrease of TPA efficiency when the pulse bandwidth is increased from about ( TL pulse) to (dotted blue line). Clearly, the calculations show that the correction of GDD and TOD is essential to achieve the greatest efficiency. The calculations agree with a common experimental observation that in a typical microscope setup, the dispersion of laser pulses shorter than needs to be pre-compensated.17, 18 TL pulse durations down to (spectral bandwidth of , centered at ) have been shown to be restored at the objective lens focus with a simple prism-pair compressor,19 i.e., by correcting only for GDD. Furthermore, the linear dependence of TPEF signal on the bandwidth of the pump pulse has been demonstrated with GDD-only compensation up to .20, 21, 22 The spectral bandwidth of , however, already requires accounting for TOD, which further increases the complexity of the setup.23 To correct for TOD, Müller combined the prism-pair compressor with a properly chosen dielectric mirror assembly.23 Fork utilized a combination of prisms and diffraction gratings,24 while Larson and Yeh reported the design of a single multilayer mirror to minimize the GDD and TOD of an objective.16 Grisms (gratings in optical contact with a prism) are another modality that can simultaneously compensate for GDD and TOD;25 however, all these designs are static, i.e., they require meticulous tailoring of their parameters and are applicable to a specific optical setup (laser and microscope objective). Furthermore, compensation of fourth and higher order dispersion requires accurate measurement and an adaptive pulse shaper. The other aspect that obviously requires attention when the pulse duration is reduced down to tens of femtoseconds is a comprehensive characterization of the laser pulse dispersion, beyond GDD. Several methods have been developed to replace the interferometric autocorrelation as a standard pulse characterization technique. Pulse characterization is routinely performed using the frequency-resolved optical gating (FROG) technique, which retrieves the phase of the pulse from a spectrally resolved autocorrelation.26 Another popular method that can achieve greater accuracy is spectral phase interference for direct electric-field reconstruction (SPIDER).27 Despite the indicated progress, the use of ultrashort pulses (below ) for two-photon microscopy has been deemed impractical.28 The proposed schemes were not flexible enough and did not allow for routine compensation of phase distortions introduced by the laser alignment or by changing the microscope objective. The situation changed with the introduction of a novel approach called multiphoton intrapulse interference phase scan (MIIPS) developed by the Dantus group.29, 30, 31, 32, 33 MIIPS is an adaptive procedure that measures and cancels GDD, TOD, and higher-order spectral-phase distortion terms automatically. It is based upon monitoring characteristic changes that occur in the spectrum of a nonlinear process, such as SHG, when the phase of the input pulse is altered. In particular, it is known that the cancellation of GDD in the presence of TOD at some wavelength within the pulse spectrum leads to a local maximum in the SHG spectrum at the corresponding wavelength . In MIIPS, a pulse shaper with a programmable spatial light modulator (SLM) is used to introduce a reference phase function , and the algorithm searches for wavelengths that satisfy the equation , where is the unknown spectral phase of the laser pulse at the focal plane. Finding the values that satisfy this equation is as simple as scanning a range of quadratic phase functions (amount of linear chirp) and collecting an SHG spectrum for each such phase. From the SHG spectral peak dependence on the reference phase, the function can be directly obtained. After its double integration, the spectral phase is obtained, and a compensation phase (negative of the measured phase) is introduced to obtain TL pulses at the sample. Note that since GDD is measured and corrected for all wavelengths within the pulse spectrum rather than at a single (central) wavelength, MIIPS automatically accounts for all higher orders of dispersion. 4.ExperimentsA schematics of a MIIPS-enabled multiphoton laser-scanning microscope is shown in Fig. 3a . The excitation source is a commercially available femtosecond Ti:sapphire oscillator (TS laser kit, KMLabs, Boulder, CO) with the repetition rate of and the output spectral bandwidth corresponding to sub- (down to ) pulses. The laser output is coupled into a pulse shaper.34, 35 The spectral components of the ultrashort laser pulses are dispersed by a plane-ruled reflection grating ( ; Newport Corp., CA) and then focused with a gold-coated spherical mirror (Newport Corp., CA) onto a liquid-crystal SLM with a single (phase-only; CRi SLM-640-P, Cambridge Research & Instrumentation, Inc.) or dual (phase-amplitude, CRi SLM-640-D, Cambridge Research & Instrumentation, Inc.) mask. The pulse shaper is calibrated and controlled by MIIPS software (BioPhotonic Solutions, Inc., Okemos, MI). Phase-amplitude shaping is used for autocorrelation measurements to create a pair of TL pulses separated by a tunable time delay. For imaging, however, phase-only compensation suffices. The phase-amplitude shaper has a throughput of 25%, while the phase-only shaper has a throughput of . The difference arises from a low-quality polarizer that can be replaced by a high-efficiency polarizer if needed. Fig. 3Nonlinear microscopy with ultrashort laser pulses. (a) Schematics of a MIIPS-enabled two-photon laser scanning microscope, where ; mirror; light modulator; -pair system for GDD compensation; mirror; -scanner; ; objective; for imaging or a second-harmonic crystal when MIIPS is executed; filter; and tube. (b) Interferometric autocorrelation of the TL pulse at the focus of a Zeiss LD C-APOCHROMAT 40x/1.1 NA objective. Phase-amplitude shaping is used to split the laser pulse into two attenuated replicas with an adjustable time delay. The total SHG signal from a KDP crystal at the objective focus is recorded as a function of the pulse timing controlled by the pulse shaper. The autocorrelation FWHM of corresponds to duration. Left inset: spectrum of excitation pulses; right inset: SHG spectrum for TL (blue line) and GDD-compensated (black line) laser pulses. (Color online only.)  The pulse shaper is followed by a standard prism-pair compressor. The prism system serves two purposes. First, it compensates for a major contribution of GDD acquired by the laser pulse along the optical path, and thereby reduces the phase wrapping in the compensation mask introduced by the SLM. Second, it allows for a direct comparison with prism-pair compensated systems used elsewhere.19, 21 In the last case, the phase mask on the SLM is set to zero for all controlled spectral components. Following the phase precompensation stages, the laser beam is scanned by a pair of mirrors that oscillate in the and directions. A dichroic filter (700DCSPXR, Chroma Technology Corp.) in front of the galvanic scanner (QuantumDrive-1500, Nutfield Technology, Inc.) separates the collected fluorescence or SHG signal and the scattered excitation light. A 3:1 lens telescope that images the scanning mirrors to the back aperture of a microscope objective is used to expand the laser beam and overfill the objective input lens. The water-immersion objective (Zeiss LD C-APOCHROMAT 40x/1.1, working distance of for a thick cover glass) is mounted in an adapted Nikon Eclipse TE-200 inverted microscope fed through the mercury lamp port. The TPEF (or SHG) signal is collected by the objective and descanned by the galvanometer mirrors. After passing through the aforementioned dichroic mirror and a shortpass emission filter (ET680-SP-2P8, Chroma Technology Corp.), the acquired fluorescence photons are focused with a lens onto a photomultiplier tube (PMT, HC120-05MOD, Hamamatsu). The signal recording and beam scanning are synchronized by a computer through a data acquisition board (PCI-6251, National Instruments). For MIIPS compensation, SHG signal from a thin nonlinear crystal (usually a KDP crystal fixed on a cover slide) at the focal plane of the objective is collected in a forward direction with a lens and fiber-coupled into a spectrometer (USB4000, Ocean Optics). While the MIIPS algorithm is executed, the scanning is disabled. Figure 3b shows an interferometric autocorrelation of MIIPS-compensated pulses at the focus of a Zeiss LD C-APOCHROMAT 40x/1.1 objective. The pair of laser pulses with a tunable time delay is created via phase-amplitude shaping,36 with the corresponding phase mask imposed on top of the compensation mask retrieved from MIIPS. The autocorrelation profile is a spectrally integrated SHG signal from a thin KDP crystal at the focus of the objective, plotted as a function of delay between the two TL pulse replicas. The obtained FWHM of the autocorrelation profile, , corresponds to pulse duration and agrees well with that expected from the recorded IR spectrum [left inset in Fig. 3b]. The FWHM of the SHG spectrum after compensation is about . The autocorrelation trace confirms the delivery of sub- pulses at the focus of the objective. 5.Results and DiscussionVarious biological samples, spanning from single-colored fixed and living cells [Figs. 4a and 4b ] to triple-stained mouse tissue [Fig. 4c] and fresh unstained rat-tendon tail [Fig. 4d] are used here to explore the effect of dispersion compensation. TPEF and SHG images obtained with both GDD-only compensated and TL pulses were acquired and compared. The image acquisition parameters were: , 30 frames per image with the scanning speed of 1 frame per second. The image size was . The laser power at the sample for all images was around . A neutral density filter was used to attenuate the input laser power. For every sample, the average signal gain and the standard deviation were calculated over 15 different locations across the acquired images. Fig. 4TPEF/SHG imaging with TL and GDD-compensated ultrashort laser pulses on: (a) SAOS-2 fixed cells stained with phalloidin 568. TPEF signal obtained with TL pulses had an 11-fold greater intensity compared to the signal acquired when GDD-only compensation was used. (b) U2OS living cell stained with MitoTracker 488. The measured gain in TPEF signal intensity was . (c) Mouse liver tissue cross-section stained with MitoTracker 488 and phalloidin 568. The gain factor was . (d) SHG image of a fresh rat tendon with the observed gain of . The images were taken sequentially starting with GDD-only using a Zeiss LD C-APOCHROMAT 40x/1.1 NA objective and were adjusted for the same intensity scale. Image size is . TL pulse duration for all images is .  Table 1FWHM time duration (τFWHM) and the corresponding spectral widths of the laser pulse (ΔλL) , TPE profile (ΔλTPE) , and two-photon field intensity (Δλ(2)) for TL Gaussian laser pulses centered at 800nm .
The images of fixed SAOS-2 cells stained with phalloidin 568 in Fig. 4a show a typical actin fiber network. The measured signal gain was . When imaging live U2OS cells stained with MitoTraker, a specific marker for mitochondria, the observed signal enhancement after full phase distortion compensation over GDD-only correction was . [Fig. 4b]. A cross-section image of a fixed liver sample stained with Mito-Tracker 488 and phalloidin 568 (actin) is given in Fig. 4c. It shows hepatocytes (liver cells) with a typical cytoplasmic mitochondrial staining and distinct actin staining of the cell boundaries (membrane). The image obtained using TL pulses exhibits times greater TPEF intensity than that acquired with GDD-only compensated pulses. Finally, in Fig. 4d, SHG images of fresh unstained rat tendon show collagen fiber enhanced by when using TL pulses as oppose to GDD-only compensated. Clearly, high-order phase distortions, still present in the spectral phase of GDD-corrected pulses, have a dramatic effect on the amount of TPEF or SHG photons generated in the imaged samples when laser sources with bandwidth are used. From a practical point of view, one could argue that an increase of the laser pulse bandwidth from , for which compensation can be accomplished via a prism pair compressor, to results in a factor-of-3 enhancement in the TPEF intensity. On the other hand, the drawbacks are (1) added pulse shaper complexity, and (2) unknown impact on phototoxicity. Please note, however, that for the added complexity of the setup, one gains the ability to deliver TL or accurately shaped pulses from any femtosecond laser through any objective. The precompensation process is fully automated and takes about two minutes. This translates into reproducible imaging data on a day-to-day basis and between different setups. As for the second point, phototoxicity is not relevant when imaging fixed samples, but photobleaching is. The preliminary results in Ref. 22 indicate that the photobleaching rate does not increase with shorter pulses. The phototoxicity of ultrashort pulses on living samples is currently under investigation, and the results are to be published elsewhere. 6.ConclusionThe concept of improving TPEF signal by increasing laser peak power is widely known; however, in spite of the expected benefit, sub- laser pulses are rarely used in the biomedical field. Chromatic dispersion is one of the main factors that limit the utilization of ultrashort laser pulses in MPM. By using a pulse shaper and an accurate means for pulse characterization, as shown here with MIIPS, one can precompensate for pulse phase distortions and recover the anticipated advantages. Autocorrelation measurements confirm delivery of sub- TL pulses at the focus of the microscope objective. Comparative two-photon imaging with TL and GDD-corrected laser pulses of the same energy showed that a 6-to-11-fold improvement in TPEF signal and up to a 19-fold improvement in SHG signal can be obtained in fixed and living cells, as well as in fixed mouse tissue and fresh rat tendon. AcknowledgmentsThis work was supported by funding from the National Science Foundation, Major Research Instrumentation CHE-0421047, and single investigator grant CHE-0500661. Dr. Xi acknowledges funding from the National Natural Science Foundation of China (60808029), National High Technology Research and Development Program of China (863 Program, 2008AA030118), and Shanghai Pujiang Program (08PJ14062). We gratefully acknowledge Dr. James Resau’s help in sample preparation and the Laboratory for Comparative Orthopedic Research at Michigan State University for providing a rat tail tendon specimen as a part of our fruitful collaboration. We also thank Bingwei Xu for his assistance with the autocorrelation measurements and Kyle Sprague for proofreading the manuscript. ReferencesW. Denk, J. H. Strickler, and W. W. Webb,
“Two-photon laser scanning fluorescence microscopy,”
Science, 248 73
–76
(1990). https://doi.org/10.1126/science.2321027 0036-8075 Google Scholar
K. König,
“Multiphoton microscopy in life sciences,”
J. Microsc., 200 83
–104
(2000). https://doi.org/10.1046/j.1365-2818.2000.00738.x 0022-2720 Google Scholar
J. Squier and M. Müller,
“High resolution nonlinear microscopy: A review of sources and methods for achieving optimal imaging,”
Rev. Sci. Instrum., 72 2855
–2867
(2001). https://doi.org/10.1063/1.1379598 0034-6748 Google Scholar
W. R. Zipfel, R. M. Williams, and W. W. Webb,
“Nonlinear magic: multiphoton microscopy in the biosciences,”
Nat. Biotechnol., 21 1368
–1376
(2003). https://doi.org/10.1038/nbt899 1087-0156 Google Scholar
F. Helmchen and W. Denk,
“Deep tissue two-photon microscopy,”
Nat. Methods, 2 932
–940
(2005). 1548-7091 Google Scholar
J. N. D. Kerr and W. Denk,
“Imaging in vivo: watching the brain in action,”
Nat. Rev. Neurosci., 9 195
–205
(2008). 1471-003X Google Scholar
G. H. Patterson and D. W. Piston,
“Photobleaching in two-photon excitation microscopy,”
Biophys. J., 78 2159
–2162
(2000). https://doi.org/10.1016/S0006-3495(00)76762-2 0006-3495 Google Scholar
T. S. Chen, S. Q. Zeng, Q. M. Luo, Z. H. Zhang, and W. Zhou,
“High-order photobleaching of green fluorescent protein inside live cells in two-photon excitation microscopy,”
Biochem. Biophys. Res. Commun., 291 1272
–1275
(2002). https://doi.org/10.1006/bbrc.2002.6587 0006-291X Google Scholar
H. Kawano, Y. Nabekawa, A. Suda, Y. Oishi, H. Mizuno, A. Miyawaki, and K. Midorikawa,
“Attenuation of photobleaching in two-photon excitation fluorescence from green fluorescent protein with shaped excitation pulses,”
Biochem. Biophys. Res. Commun., 311 592
–596
(2003). https://doi.org/10.1016/j.bbrc.2003.09.236 0006-291X Google Scholar
H. J. Koester, D. Baur, R. Uhl, and S. W. Hell,
“ fluorescence imaging with pico- and femtosecond two-photon excitation: Signal and photodamage,”
Biophys. J., 77 2226
–2236
(1999). 0006-3495 Google Scholar
A. Hopt and E. Neher,
“Highly nonlinear photodamage in two-photon fluorescence microscopy,”
Biophys. J., 80 2029
–2036
(2001). 0006-3495 Google Scholar
C. Xu and W. W. Webb,
“Measurement of two-photon excitation cross sections of molecular fluorophores with data from ,”
J. Opt. Soc. Am. B, 13 481
–491
(1996). https://doi.org/10.1364/JOSAB.13.000481 0740-3224 Google Scholar
R. Szipocs, K. Ferencz, C. Spielmann, and F. Krausz,
“Chirped multilayer coatings for broad-band dispersion control in femtosecond lasers,”
Opt. Lett., 19 201
–203
(1994). 0146-9592 Google Scholar
A. Stingl, C. Spielmann, F. Krausz, and R. Szipocs,
“Generation of from a Ti-sapphire laser without the use of prisms,”
Opt. Lett., 19 204
–206
(1994). 0146-9592 Google Scholar
R. Wolleschensky, T. Feurer, R. Sauerbrey, and I. Simon,
“Characterization and optimization of a laser-scanning microscope in the femtosecond regime,”
Appl. Phys. B, 67 87
–94
(1998). https://doi.org/10.1007/s003400050479 0946-2171 Google Scholar
A. M. Larson and A. T. Yeh,
“Ex vivo characterization of sub-,”
Opt. Lett., 31 1681
–1683
(2006). 0146-9592 Google Scholar
S. W. H. Pekka and E. Hänninen,
“Femtosecond pulse broadening in the focal region of a two-photon fluorescence microscope,”
Bioimaging, 2 117
–121
(1994). https://doi.org/10.1002/1361-6374(199409)2:3<117::AID-BIO1>3.0.CO;2-9 0966-9051 Google Scholar
G. J. Brakenhoff, M. Müller, and J. Squier,
“Femtosecond pulse-width control in microscopy by 2-photon absorption autocorrelation,”
J. Microsc., 179 253
–260
(1995). 0022-2720 Google Scholar
C. Soeller and M. B. Cannell,
“Construction of a two-photon microscope and optimisation of illumination pulse duration,”
Pfluegers Arch. Eur. J. Physiol., 432 555
–561
(1996). https://doi.org/10.1007/s004240050169 0031-6768 Google Scholar
G. McConnell and E. Riis,
“Two-photon laser scanning fluorescence microscopy using photonic crystal fiber,”
J. Biomed. Opt., 9 922
–927
(2004). https://doi.org/10.1117/1.1778734 1083-3668 Google Scholar
S. Tang, T. B. Krasieva, Z. Chen, G. Tempea, and B. J. Tromberg,
“Effect of pulse duration on two-photon excited fluorescence and second harmonic generation in nonlinear optical microscopy,”
J. Biomed. Opt., 11 020501
(2006). https://doi.org/10.1117/1.2177676 1083-3668 Google Scholar
P. Xi, Y. Andegeko, L. R. Weisel, V. V. Lozovoy, and M. Dantus,
“Greater signal, increased depth, and less photobleaching in two-photon microscopy with ,”
Opt. Commun., 281 1841
–1849
(2008). https://doi.org/10.1016/j.optcom.2007.09.066 0030-4018 Google Scholar
M. Müller, J. Squier, R. Wolleschensky, U. Simon, and G. J. Brakenhoff,
“Dispersion pre-compensation of optical pulses for high-numerical-aperture objectives,”
J. Microsc., 191 141
–150
(1998). https://doi.org/10.1046/j.1365-2818.1998.00357.x 0022-2720 Google Scholar
R. L. Fork, C. H. B. Cruz, P. C. Becker, and C. V. Shank,
“Compression of optical pulses to by using cubic phase compensation,”
Opt. Lett., 12 483
–485
(1987). 0146-9592 Google Scholar
E. A. Gibson, D. M. Gaudiosi, H. C. Kapteyn, R. Jimenez, S. Kane, R. Huff, C. Durfee, and J. Squier,
“Efficient reflection grisms for pulse compression and dispersion compensation of femtosecond pulses,”
Opt. Lett., 31 3363
–3365
(2006). https://doi.org/10.1364/OL.31.003363 0146-9592 Google Scholar
R. Trebino, K. W. DeLong, D. N. Fittinghoff, J. N. Sweetser, M. A. Krumbugel, B. A. Richman, and D. J. Kane,
“Measuring ultrashort laser pulses in the time-frequency domain using frequency-resolved optical gating,”
Rev. Sci. Instrum., 68 3277
–3295
(1997). https://doi.org/10.1063/1.1148286 0034-6748 Google Scholar
C. Iaconis and I. A. Walmsley,
“Spectral phase interferometry for direct electric-field reconstruction of ultrashort optical pulses,”
Opt. Lett., 23 792
–794
(1998). https://doi.org/10.1364/OL.23.000792 0146-9592 Google Scholar
A. Diaspro, P. Bianchini, G. Vicidomini, M. Faretta, P. Ramoino, and C. Usai,
“Multi-photon excitation microscopy,”
Biomed. Eng. Online, 5 36
(2006). 1475-925X Google Scholar
K. A. Walowicz, I. Pastirk, V. V. Lozovoy, and M. Dantus,
“Multiphoton intrapulse interference. 1. Control of multiphoton processes in condensed phases,”
J. Phys. Chem., 106 9369
–9373
(2002). 0022-3654 Google Scholar
V. V. Lozovoy, I. Pastirk, K. A. Walowicz, and M. Dantus,
“Multiphoton intrapulse interference. II. Control of two- and three-photon laser induced fluorescence with shaped pulses,”
J. Chem. Phys., 118 3187
–3196
(2003). https://doi.org/10.1063/1.1531620 0021-9606 Google Scholar
I. Pastirk, J. M. Dela Cruz, K. Walowicz, V. V. Lozovoy, and M. Dantus,
“Selective two-photon microscopy with shaped femtosecond pulses,”
Opt. Express, 11 1695
–1701
(2003). 1094-4087 Google Scholar
V. V. Lozovoy, I. Pastirk, and M. Dantus,
“Multiphoton intrapulse interference. IV. Ultrashort laser pulse spectral phase characterization and compensation,”
Opt. Lett., 29 775
–777
(2004). https://doi.org/10.1364/OL.29.000775 0146-9592 Google Scholar
J. M. Dela Cruz, V. V. Lozovoy, and M. Dantus,
“Coherent control improves biomedical imaging with ultrashort shaped pulses,”
J. Photochem. Photobiol., A, 180 307
–313
(2006). https://doi.org/10.1016/j.jphotochem.2006.02.020 1010-6030 Google Scholar
A. M. Weiner, J. P. Heritage, and J. A. Salehi,
“Encoding and decoding of femtosecond pulses,”
Opt. Lett., 13 300
–302
(1988). 0146-9592 Google Scholar
A. M. Weiner,
“Femtosecond pulse shaping using spatial light modulators,”
Rev. Sci. Instrum., 71 1929
–1960
(2000). https://doi.org/10.1063/1.1150614 0034-6748 Google Scholar
A. Galler and T. Feurer,
“Pulse shaper assisted short laser pulse characterization,”
Appl. Phys. B, 90 427
–430
(2008). https://doi.org/10.1007/s00340-007-2924-z 0946-2171 Google Scholar
|
||||||||||||||||||||||||||||||


