|
|
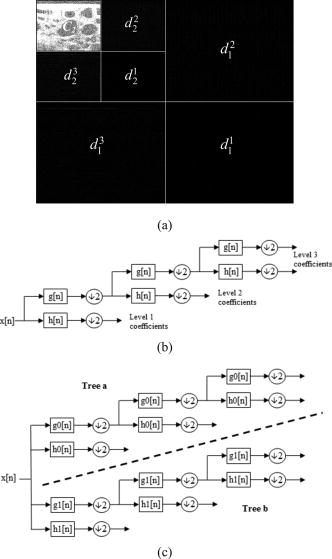
1.IntroductionOptical coherence tomography (OCT) is a noninvasive optical imaging technique used to perform high-resolution cross-sectional in vivo and in situ imaging of microstructure in biological tissues.1 OCT imaging of the cavernous nerves in the rat and human prostate has recently been demonstrated.2, 3, 4, 5 However, improvements in the quality of the images for identification of the cavernous nerves during prostate cancer surgery would aid preservation of the nerves and improve postoperative sexual function. Speckle occurs in the OCT image when the particles composed in the underlying tissue structures are smaller than the coherence length of the light source.6 Because the speckle pattern is uncorrelated at different positions, angles, and optical wavelengths, speckle reduction using spatial and frequency compounding techniques cannot remove speckle from images acquired with standard OCT systems. Recently, wavelet techniques have been employed successfully in speckle noise reduction for OCT images.7, 8 Wavelet shrinkage denoising is denoising by nonlinear soft thresholding in the wavelet transform domain. Adler 7 applied the discrete wavelet transform (DWT) which provides the most compact representation; however, it has several limitations. The dual-tree complex wavelet transform (CDWT) overcomes these limitations because it is nearly shift-invariant and is oriented in 2-D.8, 9 The complex wavelet transform was used for wavelet denoising in OCT images.10, 11 Forouzanfar 10 applied the directional Bayesian estimator to remove noise from the wavelet coefficients, and we11 applied a single threshold globally for all relevant parts of the transform in OCT images of experimental systems. In this study, we have gone one main step further to apply the wavelet shrinkage technique, using CDWT, to an FDA approved clinical endoscopic OCT system. For this purpose, a bivariate shrinkage with local variance estimation algorithm is applied,12 because the performance of the wavelet shrinkage algorithm for OCT image denoising can be improved by considering the statistical dependencies among wavelet coefficients. We compare the results of the DWT and CDWT algorithms for wavelet shrinkage denoising of in vivo OCT images of the rat prostate. 2.Wavelet shrinkage denoisingDenoising attempts to remove noise and retain signal regardless of the frequency content of the signal. Wavelet shrinkage is denoising by shrinking (nonlinear soft thresholding) in the wavelet transform domain. The observed image, , is modeled as an uncorrupted image, , and multiplicative speckle noise, . On a logarithmic scale, speckle is converted to additive noise, . The wavelet shrinkage denoising algorithm requires the following four-step procedure,13 3.Wavelet transformOperator relates to the wavelet transform, which is the representation of a function by scaled and translated copies of a finite-length or fast-decaying oscillating waveform, which can be used to analyze signals at multiple scales. Wavelet coefficients carry both time and frequency information, as the basis functions vary in position and scale. 3.1.2-D DWTThe DWT converts a signal to its wavelet representation. In a one-level DWT, a signal is split into an approximation part and a detail part . In a multilevel DWT, each subsequent is split into an approximation and detail . For 2-D images, each is split into an approximation and three detail channels , and for horizontally, vertically, and diagonally oriented details, respectively, Figures 1a and 1b . The inverse DWT reconstructs each from and . 3.2.2-D CDWTThe CDWT calculates the complex transform of a signal using two separate DWT decompositions [trees a and b, Fig. 1c]. If the filters used in one are specifically designed differently from those in the other, it is possible for one DWT to produce the real coefficients and the other the imaginary coefficients. This redundancy of two provides extra information for analysis but at the expense of extra computational power. The wavelet transform, , must be specified by its analysis and synthesis wavelet filter banks. In our case, wavelet coefficients are calculated from the Farras nearly symmetric wavelet.14 The wavelet transform package by Selesnick 15 was used for implementation of the wavelet transform. 4.Shrinkage denoisingOperator in Eq. 1 selects a data-adaptive threshold, and denotes the denoising operator with threshold . Bivariate shrinkage with local variance estimation algorithm12 is applied for shrinkage denoising. After estimating the signal components of the noisy coefficients in the wavelet domain, the inverse wavelet transform, , is taken to reconstruct the noise-free image. 5.ResultsFigure 2 shows time-domain OCT images of the cavernous nerves at different orientations (longitudinal, oblique, and cross-sectional) coursing along the surface of the rat prostate. OCT images were taken in vivo using a clinical endoscopic OCT system (Imalux, Cleveland, OH) which is based on a novel, low-maintenance, low-cost, lightweight OCT system using an all single-mode fiber common-path interferometer-based scanning system (Optiphase, Van Nuys, CA). Histologic sections of the cavernous nerves were processed for comparison, Fig. 2. Figure 3 shows the images after denoising using DWT and CDWT. Image-quality metrics were used to assess performance by measuring the average contrast-to-noise ratio, ,6 and the average equivalent number of looks, ,7 over the region of interest which is the location of the cavernous nerve in each image. is the mean of the pixel values in the location of the cavernous nerve, is the pixel standard deviation, and and are the pixel mean and standard deviation of a background region of the image, respectively. All calculations are made after logarithmic transformation of the image. In addition, the global SNR is calculated as , where is the 2-D matrix of pixel values in the OCT image and is the noise variance, both on linear intensity scales.6 Fig. 2OCT and corresponding histologic images of the rat cavernous nerve: (a,b) longitudinal section, (c,d) oblique section, and (e,f) cross section. In each section, the cavernous nerve corresponds to a relatively high signal intensity (shown in red) and lies superficial to the prostate. (color online only.)  Fig. 3OCT images of the rat cavernous nerve after wavelet shrinkage denoising: (a,c,e) using DWT and (b,d,f) using CDWT. In comparison to DWT, CDWT has the advantages of being nearly shift-invariant and oriented in two dimensions. 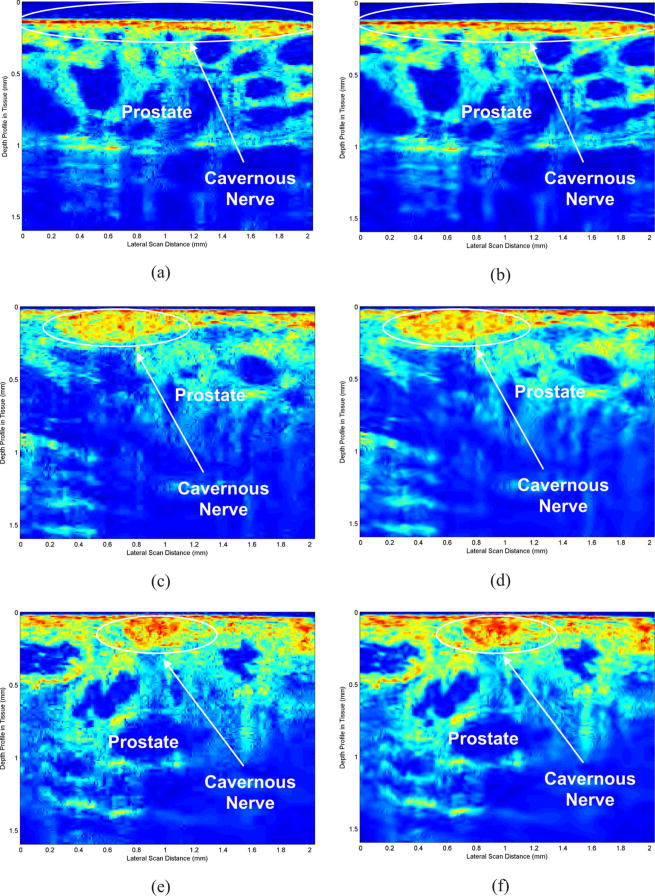 The values of CNR, ENL and SNR for nine sample images show significant improvement, Table 1 . A paired t-test was performed for comparison of original and denoised images, with statistical significance given by values of . Comparison of original and CDWT denoised images results in values for CNR, ENL, and SNR of 0.0003, 0.07, and 0.0001, respectively. The values for CNR and SNR are considered to be statistically significant. Comparison of DWT and CDWT results in values for CNR, ENL, and SNR of 0.0001, 0.05, and 0.9, respectively. The values for CNR and ENL are considered to be statistically significant. Table 1Image quality values.
DWT lacks the shift-invariance property, and in multiple dimensions it performs poorly for distinguishing orientations, which is important in image processing. In other words, this lack of orientation selectivity greatly complicates modeling and processing of geometric image features like the ridges and edges in which the cavernous nerves belong.16 Therefore, denoising using CDWT, which is more selective with respect to orientation and provides approximate shift-invariance, overcomes this problem and still allows excellent reconstruction of the image. These properties make the CDWT better in denoising than the normal DWT. Comparison of CNR, ENL, and SNR values for DWT and CDWT verifies this; however, we can also visually recognize the advantage of shrinkage denoising using the CDWT. 6.ConclusionThe wavelet shrinkage denoising technique was used for speckle noise reduction in the OCT images of cavernous nerves in the rat prostate. Two different wavelet transform procedures were used, DWT and CDWT, and their denoising results were compared for identification of the cavernous nerves. The CDWT was used to take advantage of this transform, which is shift-invariant and directionally selective. An SNR increase of with significant image quality improvements was obtained. This algorithm for wavelet denoising may be a useful technique for clinical OCT applications. AcknowledgmentsThis research was supported in part by the Department of Energy, Grant No. DE-FG02-06CH11460, an Idea Development Award from the Department of Defense Prostate Cancer Research Program, Grant No. PC073709, and a Faculty Research Grant from the University of North Carolina at Charlotte. The authors thank Nancy Tresser of Imalux Corporation (Cleveland, OH) for lending us the Niris OCT system for these studies. ReferencesD. Huang, E. Swanson, C. Lin, J. Schuman, W. Stinson, W. Chang, M. Hee, T. Flotte, K. Gregory, C. Puliafito, and J. Fujimoto,
“Optical coherence tomography,”
Science, 254 1178
–1181
(1991). https://doi.org/10.1126/science.1957169 0036-8075 Google Scholar
M. Aron, J. Kaouk, N. Hegarty, J. Colombo, G. Haber, B. Chung, M. Zhou, and I. Gill,
“Preliminary experience with the niris optical coherence tomography system during laparoscopic and robotic prostatectomy,”
J. Endourol, 21 814
–818
(2007). 0892-7790 Google Scholar
N. Fried, S. Rais-Bahrami, G. Lagoda, A. Chuang, A. Burnett, and L. Su,
“Imaging the cavernous nerves in rat prostate using optical coherence tomography,”
Lasers Surg. Med., 39 36
–41
(2007). https://doi.org/10.1002/lsm.20454 0196-8092 Google Scholar
N. Fried, S. Rais-Bahrami, G. Lagoda, A. Chuang, L. Su, and A. Burnett,
“Identification and imaging of the nerves responsible for erectile function in rat prostate, in vivo, using optical nerve stimulation and optical coherence tomography,”
IEEE J. Sel. Top. Quantum Electron., 13 1641
–1645
(2007). 1077-260X Google Scholar
S. Rais-Bahrami, A. Levinson, N. Fried, G. Lagoda, A. Hristov, A. Chuang, A. Burnett, and L. Su,
“Optical coherence tomography of cavernous nerves: A step toward real-time intraoperative imaging during nerve-sparing radical prostatectomy,”
Urology, 72 198
–204
(2008). 0090-4295 Google Scholar
S. Xiang, L. Zhou, and J. Schmitt,
“Speckle noise reduction for optical coherence tomography,”
Proc. SPIE, 3196 79−88
(1997). 0277-786X Google Scholar
D. Adler, T. Ko, and J. Fujimoto,
“Speckle reduction in optical coherence tomography images by use of a spatially adaptive wavelet filter,”
Opt. Lett., 29 2878
–2880
(2004). https://doi.org/10.1364/OL.29.002878 0146-9592 Google Scholar
A. Pizurica, L. Jovanov, B. Huysmans, V. Zlokolica, P. Keyser, F. Dhaenens, and W. Philips,
“Multiresolution denoising for optical coherence tomography: A review and evaluation,”
Curr. Med. Imaging Rev., 2008 270
–284 Google Scholar
N. Kingsbury,
“Complex wavelets for shift invariant analysis and filtering of signals,”
Appl. Comput. Harmon. Anal., 10 234
–253
(2002). https://doi.org/10.1006/acha.2000.0343 1063-5203 Google Scholar
M. Forouzanfar and H. Moghaddam,
“A directional multiscale approach for speckle reduction in optical coherence tomography images,”
1
(2007). Google Scholar
S. Chitchian, M. Fiddy, and N. Fried,
“Wavelet denoising during optical coherence tomography of the prostate nerves using the complex wavelet transform,”
3016
(2008). Google Scholar
L. Sendur and I. Selesnick,
“Bivariate shrinkage with local variance estimation,”
IEEE Signal Process. Lett., 9 438
–441
(2002). https://doi.org/10.1109/LSP.2002.806054 1070-9908 Google Scholar
C. Taswell,
“The what, how, and why of wavelet shrinkage denoising,”
Rep. Sci. Res. Inst., 2 12
–19
(2000). 0368-5934 Google Scholar
A. Abdelnour and I. Selesnick,
“Design of 2-band orthogonal near-symmetric CQF,”
3693
(2001). Google Scholar
I. Selesnick, S. Cai, K. Li, L. Sendur, and A. Abdelnour,
“Matlab implementation of wavelet transforms,”
http://taco.poly.edu/WaveletSoftware/ Google Scholar
I. Selesnick, R. Baraniuk, and N. Kingsbury,
“The dual-tree complex wavelet transform,”
IEEE Signal Process. Mag., 2005 123
–151 1053-5888 Google Scholar
|