
|
|
1.IntroductionImproving early detection is the key to managing cancer, since the results of treatment are much more favorable when the cancer is diagnosed at an early, preinvasive stage. To address this, our laboratory has developed trimodal spectroscopy (TMS), a technique that combines three spectroscopic modalities—diffuse reflectance spectroscopy (DRS), intrinsic fluorescence spectroscopy (IFS), and light scattering spectroscopy (LSS). DRS measures the spectrum of diffusely reflected light returning from the tissue and provides information about tissue scattering, blood concentration, and blood oxygenation. IFS measures tissue autofluorescence spectra and provides the relative concentrations of native tissue fluorophores, such as collagen and NADH. In the TMS studies,1, 2, 3 LSS was assumed to measure single elastic light scattering from epithelial nuclei, from which their size distribution could be determined. In this work, we use the term LSS to refer to the specific model-based method employed in those studies, although there are other similarly named methods/techniques that have been developed and used to study single scattering in epithelial nuclei4, 5, 6 and other cell organelles.7, 8, 9 TMS has shown promise for diagnosing early cancer in a variety of organs, and multipatient, multiorgan studies indicate that LSS was an important predictive component of TMS. Backman applied LSS to detection of early cancer in bladder, colon, and other tissues in vivo.10 They obtained 100% sensitivity and 100% specificity in distinguishing abnormal from normal tissue in bladder and colon. Müller employed TMS in the oral cavity, and obtained 96% sensitivity and 96% specificity in separating cancerous and dysplastic tissues from normal tissue.3 With LSS alone, they were able to obtain 92% sensitivity and 97% specificity for the same classification. Georgakoudi used TMS in the cervix and were able to distinguish between squamous intraepithelial lesions (SILs) and non-SILs with 92% sensitivity and 90% specificity.2 With LSS alone, they were able to perform the same distinction with 77% sensitivity and 83% specificity. Georgakoudi 1 employed TMS in Barrett’s esophagus and obtained 100% sensitivity and 100% specificity in distinguishing high grade dysplasia from low grade dysplasia and nondysplastic Barrett’s. Wallace 11 used LSS alone in Barrett’s esophagus and found that dysplasia could be distinguished from nondysplastic tissue with 90% sensitivity and 90% specificity. These studies show that LSS, especially in combination with DRS and IFS, offers promise for diagnosing early cancer. The LSS modality employed in the previous studies is model based. In model-based LSS, a residual spectrum is obtained by fitting a model of diffuse reflectance to the observed diffuse reflectance spectrum.12 This residual spectrum was attributed to single elastic light scattering from epithelial nuclei, and a Fourier-transform-based LSS diagnostic algorithm, developed by Perelman 12 and Backman 10, analyzed it as such to extract nuclear size and density from the wavelength-dependent oscillatory structure.13 However, recent experimental and theoretical work in our laboratory indicates that this picture is incorrect, and analysis of larger clinical datasets of cervical, oral, and Barrett’s esophagus spectra failed to reproduce the results obtained in the original studies1, 2, 3 using model-based LSS. In actuality, the residual spectrum arose primarily from inaccurate modeling of the hemoglobin absorption features in the DRS spectrum. Hemoglobin, a very strong tissue absorber at , is contained in blood and confined to the blood vessels. It is thus “packaged” in small regions of the tissue, and this alters the apparent hemoglobin absorption spectrum.14 In this work, we provide proof for these claims using numerical estimates based on light propagation and Mie theory, and measurements of reflectance from physiological tissue phantoms. We then analyze the Barrett’s esophagus clinical reflectance data of Georgakoudi 1, with and without vessel packaging, to evaluate the role of vessel packaging on DRS fitting. Vessel packaging is a model developed by Svaasand that accounts for the effects of inhomogeneous hemoglobin distribution on diffuse reflectance.14, 15, 16 We conclude by simulating tissue reflectance spectra to show that the Fourier-transform analysis applied to residual spectra is not robust. 2.Elastic Light Scattering AnalysisIn this section we employ numerical analysis with light propagation and Mie theory13 to estimate the magnitude and wavelength dependence of single elastic light scattering from epithelial nuclei relative to the total reflectance. The single scattering contribution is estimated in a background of total reflectance that adds uncertainty to any measurement. A realistic model of light scattering in tissue, first proposed by Perelman,12 is evaluated, and the amplitudes and spectral shapes of predicted light scattering signals are obtained for later comparison with those acquired in the clinical studies. Light scattering in epithelial tissue can be modeled by the two-layer tissue model of Fig. 1a . The lower layer is a semi-infinite diffusive scattering layer with reduced scattering coefficient and absorption coefficient , modeling subepithelial tissue. The thin upper layer, representing the epithelium, is composed of spherical scatterers (cell nuclei) of diameter and number density , with index of refraction mismatch relative to the surrounding medium. The implementation of Perelman’s model presented in this work assumes a single size of epithelial scatterers. This assumption has minimal impact on the final light scattering spectra, because the effect of a distribution of scatterer sizes is similar to the effect of averaging scattering signals measured within a finite solid angle, which is included in the model. Fig. 1(a) Two-layer tissue model describing epithelium and subepithelial tissue. , , and are the diameter, index mismatch, and number density of spherical scatterers, respectively. and are the reduced scattering and absorption coefficients of the lower layer, respectively. (b) Backscattering (labeled 1). is the angle between the incident beam and a backscattered light ray. The irregularly shaped dotted line represents a light ray entering the diffusive lower layer and re-emerging from the top. (c) Forward scattering (labeled 2) and transmission (labeled 3). is the angle between the incident beam and a diffusely reflected light ray exiting the lower layer. is the angle of forward scattering. is the angle between a forward scattered light ray and the incident beam. 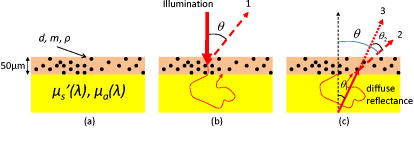 The optical fiber probe used to deliver light and collect tissue spectra in vivo 1, 2, 3 consisted of a light delivery fiber surrounded by six collection fibers. All fibers had -core diameters and . The fibers were separated from the tissue by a -thick quartz cover piece. During measurement, the probe was placed in contact with the tissue, and reflectance and fluorescence spectra were acquired. To model this instrument, we make several simplifications to expedite computations. First, the light beam incident on the tissue sample covers the same area as that of the delivery fiber of the probe, but is assumed to be collimated. Second, the fibers are assumed to be in direct contact with the tissue. Therefore, light returning from the tissue within collection area (the area on the tissue surface covered by the collection fibers) and collection solid angle (the solid angle spanned by NA 0.22 fibers) is collected. To mathematically simulate a tissue reflectance measurement, consider the simplified probe described earlier, placed in contact with the tissue of Fig. 1a. Light entering the tissue can return to the surface in three ways, as illustrated in Figs. 1b and 1c. 1. The incident light can be backscattered from the upper layer [labeled 1 in Fig. 1b]. This light does not enter the lower layer. Light entering the lower layer is diffusely reflected and can return to the surface in two additional ways [dotted and dashed red lines in Fig. 1c]. 2. It can be scattered in the forward direction before emerging from the surface [labeled 2 in Fig. 1c]. 3. It can traverse the upper layer on the way up without being scattered [labeled 3 in Fig. 1c]. The total reflectance (fraction of incident light power collected by the probe) is the sum of the three contributions: with , , and the reflectance contributions from light collected from area on the tissue due to backscattering, forward scattering, and transmission, respectively.Perelman derived expressions for the three reflectance terms, which we express in a form specific to our instrument. 2.1.BackscatteringConsider Fig. 1b, where is the angle between a backscattered light ray and the direction of the incident beam. If we assume to be comprised of only singly backscattered light returning from within the collection area, it can be expressed as follows: Here, , the optical thickness of the upper layer, is equal to the product of , the layer thickness (assumed to be in the simulations), and the total elastic scattering cross section.13 The wavelength is . The single scattering approximation is valid when , a reasonable approximation in the case of tissue epithelium.17 The factor is the fraction of light scattered once while traversing the upper layer. The phase function of the scatterers in the upper layer can be obtained from Mie theory. The integral over gives the fraction of light scattered into the collection solid angle of the probe.Figure 2a plots for values of , , and in the histological range of interest. Note that the backscattering spectrum is smooth, with oscillatory wavelength dependent features having been averaged out by integration over a solid angle. Fig. 2LSS analysis results computed from histologically relevant epithelial scattering parameters. In the legend, has units of microns. For all cases . (a) Backscattering reflectances. (b) Sum of forward scattering and transmission reflectances. (c) Mean-centered normalized reflectances. (d) LSS features (optical thicknesses) of light scattering from the upper layers.  2.2.Forward Scattering and TransmissionConsider Fig. 1c. Diffusely reflected light from the lower layer has an approximately Lambertian angular profile. is the angle between the incident beam and a light ray emerging from the lower layer. is the angle between the incident beam and a diffusely reflected light ray that is forward scattered by the upper layer before reaching the tissue surface. is the forward scattering angle. If we assume only transmission or single scattering in the upper layer, and that no light leaks into or out of the collection area during passage through the upper layer, and can be expressed as follows: is the fraction of incident light that traverses the upper layer, is diffusely reflected in the lower layer, and returns to the tissue surface within the probe collection area. The diffuse reflectance model of Zonios,18 an appropriate extension of the model developed by Farrell, Patterson, and Wilson,19 provides an analytic solution to in terms of , , and the probe’s light delivery and collection areas. The right-hand side of Eq. 3, similar to that of Eq. 2, contains the product of the fraction of light singly scattered and a double integral term representing the fraction of diffusely reflected light scattered into the collection solid angle. Equation 3 requires a double integral with and cosine terms, because the angular distribution of diffuse light returning from the lower layer within the collection area is assumed to be Lambertian. Similarly, the right-hand side of Eq. 4 contains the product of the fraction of transmitted light, , and an integral representing the fraction of light emitted from the lower layer entering the collection solid angle.To compute , we model the reduced scattering coefficient as follows: The reference wavelength . The term represents a change in the exponent of the reduced scattering coefficient at short wavelengths, which we have observed in modeling data presented in this and other studies. The absorption coefficient used, , was that of hemoglobin, in which where is the total hemoglobin concentration (mg/mL) in the volume of tissue sampled by light, and is the oxygen saturation. is the extinction coefficient of deoxygenated hemoglobin in units of , and is the corresponding extinction coefficient of oxygenated hemoglobin.20 The reduced scattering and absorption coefficients used in the following elastic light scattering analysis are: , , , , and . , , , , and are referred to as the spectroscopy parameters. Later in this work, we introduce one additional spectroscopy parameter (effective blood vessel radius), describing vessel packaging. Note that we compute here, assuming a homogeneous hemoglobin distribution rather than a packaged distribution, so we can evaluate the amplitude and spectral shape of epithelial nuclear scattering signals extracted by model-based LSS as implemented in previous works.1, 2, 3, 10, 11, 12Figure 2b plots the forward directed reflectance for values of , , and in the histological range of interest. Note that this quantity is two orders of magnitude larger than . Hence, in the total reflectance, the effect of forward directed light dominates over backscattering. Also note that the spectral shape of the forward directed contribution shows features of hemoglobin absorption at 420 and . Furthermore, the impact of different upper layers on the total reflectance is small, indicating that the presence of epithelial nuclei has minimal impact on the reflectance measured. Perelman define the normalized reflectance as: where is the reflectance in the absence of the upper layer. It is not possible to isolate the lower layer during an in-vivo measurement, but can be estimated by fitting the diffuse reflectance model of Zonios 18 to by varying the spectroscopy parameters in Eqs. 5, 6.12 For this calculation, we assume that diffusely reflected light exits the tissue with a Lambertian angular profile. The residual spectrum is the wavelength dependent component of ,12 and this signal was assumed to be due to epithelial nuclear scattering.We numerically evaluate Eq. 7 for values of , , and in the histological range of interest. The results, shown in Fig. 2c, indicate that the amplitudes, defined as half of the peak-to-peak values of the oscillatory components of the normalized reflectance spectra, are approximately 1% of the total collected light power. Also, the wavelength dependent features of the residual spectra do not have the same frequencies as the LSS features (optical thicknesses) of the upper layers, shown in Fig. 2d. It is important to note that a one-percent residual spectrum obtained from a clinical experiment would be extremely difficult to detect, given the experimental variability, which is typically 2 to 3 % of the total signal.2 Further, the fact the residual spectra have different frequencies than the LSS features, contrary to the requirements set by Perelman, calls into question the validity of the Fourier-transform analysis.10, 12 The residual spectra of Fig. 2c are not in agreement with the LSS features, because the diffusion reflectance model of Zonios used to obtain does not properly account for the addition of a nondiffuse scattering layer on top of a diffuse scattering layer. 3.Tissue Phantom ExperimentIn this section we present tissue phantom experiments to verify the findings of the numerical estimates described in the previous section. The phantoms are very similar to the tissue model in Fig. 1a, with two distinct layers separated by a -thick quartz coverslip. The upper layer is deep and holds polystyrene spheres (Duke Scientific, Incorporated) of diameter , in units of microns, immersed in optically clear, refractive index matched oil (Cargille Laboratories) such that is close to 1. is varied by using oils of slightly different refractive indexes. The lower layer consists of 10% intralipid (Fresenius Kabi AG) diluted 1:9 with water. This two-layer model is optically similar to tissue, where epithelial nuclei lie on top of a diffuse reflecting stroma. To create the upper layer, approximately of the spheres solution was placed inside a vacuum chamber. A pump was used to evacuate air from the chamber until all of the water had evaporated. Once evaporation was complete, the spheres were removed from the vacuum chamber and approximately of the index matched oil was placed in the container. The mixture was stirred until the spheres were homogeneously distributed. Lastly, the mixture was placed between two quartz coverslips apart to form the upper layer. We used a probe instrument, very similar to the one used to measure tissue spectra in vivo,1, 2, 3 to measure reflectance spectra from four phantoms. The upper layer spheres ranged in diameter from , and the refractive index mismatch varied from 1.03 to 1.06. For one phantom, only oil was placed in the upper layer. The measured reflectance spectra, normalized by a measurement of a 99% spectralon standard (Labsphere, Incorporated), are shown in Fig. 3 . Even though the upper layer properties vary considerably, the measured reflectance spectra are very similar, as was observed in the previous section [Fig. 2b]. This confirms that epithelial nuclear scattering has minimal impact on the total tissue reflectance. Fig. 3Reflectance spectra measured from tissue phantoms. The vertical axis is the fraction of light energy collected from the phantom divided by the amount collected from the 99% spectralon. All phantoms had approximately in the upper layer. For clarity, hemoglobin has not been added to the lower layer because the purpose of this phantom is to examine scattering by spheres in the upper layer.  4.Diffuse Reflectance Spectroscopy with and without Vessel PackagingPreviously, residual spectra measured from tissue and similar in form to the ones computed earlier were analyzed with the Fourier-transform analysis10, 12 to extract scatterer size distribution and number density of upper layer structures from the wavelength dependent oscillations.13 It was assumed that the scatterers were epithelial nuclei with properties in the range listed in Fig. 2b, and that changes in their properties were related to cancer progression.12 In this section we analyze a set of reflectance spectra, measured by Georgakoudi,1 from seven high grade dysplasia (HGD) lesions, seven low-grade dysplasia (LGD) lesions, and 22 nondysplastic Barrett’s (NDB) tissue sites. Figure 4a shows a representative reflectance spectrum along with its obtained in the same manner as in Eq. 7. The spectroscopy parameters are varied until an optimal fit (defined in the caption of Fig. 4) is obtained. This is the estimated from the reflectance spectrum assuming a homogeneous hemoglobin distribution in the tissue. In Fig. 4b, we plot the corresponding normalized reflectance spectrum . The amplitude of the wavelength dependent component of the normalized reflectance spectrum is approximately 10% of the total reflectance. This is an order of magnitude larger than the 1% value computed by elastic light scattering analysis. Therefore, it is unlikely that the origin of the observed residual spectra is due to epithelial nuclear scattering. Fig. 4(a) Reflectance spectrum (solid line) measured from Barrett’s esophagus in vivo along with optimal fits, using the model of Zonios,18 with (dotted line) and without (dashed line) vessel packaging to account for the inhomogeneous hemoglobin distribution. We define the optimal fit as the that minimizes over all possible combinations of spectroscopy parameters. For the fit with vessel packaging, , and for the fit without vessel packaging, . (b) Residual spectra resulting from fitting with (dotted line) and without (dashed line) vessel packaging. The locations of the largest residual features are somewhat arbitrary, as they depend on and the exact objective function used in the fit optimization. This may affect the appearance of residual spectra presented in other papers, such as in Figs. 3a and 3b of Perelman 12 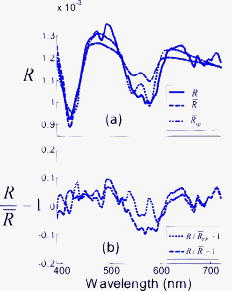 Up to this point, we have not discovered the true origin of the 10% residual spectra observed in clinical measurements. To explore this topic, we consider the incorrect assumption made so far in this work that the hemoglobin distribution in tissue is homogeneous. As has been noted by several researchers,14, 15, 16 blood is confined within vessels of finite dimension, thus creating an inhomogeneous distribution of hemoglobin. Because hemoglobin is such a strong absorber at the Soret band , regions of tissue with blood vessels can be totally opaque to light and be more transparent to other wavelengths. In bulk tissue, this tends to reduce the magnitude of the Soret band relative to the weaker hemoglobin bands around . Elastic light scattering analysis and corresponding analysis of clinical data suggest that a physical model that more accurately accounts for hemoglobin absorption is required to fit the clinical reflectance spectra. To address this requirement, we extend DRS to include vessel packaging, which is a model that provides an effective absorption coefficient to account for the effects of an inhomogeneous hemoglobin distribution on diffuse reflectance. We adopt the vessel packaging derivation of van Veen, Verkruysse, and Sterenborg, and Svaasand,14, 15 and use the correction factor ( , ): where is the effective blood vessel radius in the tissue volume sampled, and is the absorption coefficient of whole blood. We follow Amelink in using as the total hemoglobin concentration in whole blood21 [this concentration value should not be confused with the average hemoglobin concentration in the volume of tissue sampled, represented by in Eq. 6]. With this correction factor, one can write the effective absorption coefficient for a volume of tissue containing blood vessels as:In modeling diffuse reflectance from tissue containing blood vessels, replaces Eq. 6 when computing the fit to a measured diffuse reflectance spectrum with the formula in Ref. 18. During fitting with Eq. 10, we impose a lower limit of for with the assumption that the minimum blood vessel size should be approximately that of a red blood cell. Compared to fitting done under a homogeneous hemoglobin distribution assumption, an additional spectroscopy parameter, the effective blood vessel radius , is varied.We define as the reflectance measured in the absence of the upper layer for clinical reflectance spectra with vessel packaging included in the model of diffuse reflectance. To estimate , we fit the reflectance spectra to the model in Ref. 18 by varying the spectroscopy parameters , , , , , and in Eqs. 6, 10. With vessel packaging, the fits to the clinical diffuse reflectance spectra improve significantly, and consequently the amplitudes of the residual spectra are greatly reduced. In every case, the fit using vessel packaging is as good or better than the fit without vessel packaging, as is demonstrated for a representative spectrum in Fig. 4a. The residual spectrum with vessel packaging has smaller amplitude than the residual spectrum without vessel packaging included [Fig. 4b]. The ratio of the Soret band dip to the Q band dips ( and ) in tissue diffuse reflectance spectra is generally smaller than in the homogeneous hemoglobin absorption spectrum. As a result, inclusion of vessel packaging improves the diffuse reflectance fits and accounts for much of the residual spectra previously associated with epithelial nuclear scattering. 5.Numerical SimulationsIn this section, we use numerically generated data to show how the effects of the spatially inhomogeneous hemoglobin distribution on diffuse reflectance could have been misinterpreted as light scattering signals from epithelial nuclei. Numerical reflectance data with the effects of packaged hemoglobin included were generated as follows. The spectroscopy parameters that define in Eq. 5 and in Eq. 10 were chosen to mimic the parameters obtained from the previously published tissue data.1 The spectroscopy parameters were varied over the following physiological ranges: , , , , , and . The resulting combinations of scattering and absorption coefficients were then inputted into the model of Zonios to compute diffuse reflectance spectra. Lastly, random Gaussian noise of varying magnitudes between 50 and 150% of the typical noise magnitude observed during actual clinical measurements was added to each of the spectra. The end result is a series of numerically simulated reflectance spectra spanning all combinations of spectroscopy parameters and noise magnitudes. The reflectance spectra generated before were then fit to the model by Zonios by varying the spectroscopy parameters in Eqs. 5, 6 to obtain . Note that these fits do not include vessel packaging in the model of diffuse reflectance to be consistent with the previous studies.1, 2, 3, 10, 11, 12 LSS analysis was then conducted on the residual spectra using the Fourier transform method12 to extract epithelial nuclei parameters. Since the numerically generated reflectance data did not include vessel packaging in the model of diffuse reflectance, the fits led to large residual spectra. By applying Fourier-transform analysis on the residual spectra over the wavelength range of , the approximate wavelength range used by Georgakoudi,1 yielded epithelial nuclei parameters that are consistent with observed nuclear sizes.22 For example, the mean nuclear diameter extracted varied from , a range readily observed during histopathology. However, the extracted epithelial nuclei parameters were significantly affected by the wavelength range used in the Fourier-transform analysis, the concentration of hemoglobin present in the simulated reflectance spectra, and the magnitude of the noise. For example, when the wavelength range of the analysis was changed from , the values for the extracted mean diameter and the percentage of enlarged nuclei shifted by and 40%, respectively. Figure 5 shows the effects of noise magnitude on the extracted percent nuclear enlargement, a key diagnostic parameter in the original study.1, 3, 10, 11 The figure shows that extracted values of nuclear enlargement are significantly affected by measurement noise. Since the epithelial nuclei parameters should not vary significantly with experimentally observed levels of noise, the Fourier-transform analysis is not robust. In other words, the performance of model-based LSS in a given dataset depends on fitting strategy. Fig. 5The effect of varying magnitude of measurement noise on extracted percent nuclear enlargement. Percent enlargement corresponds to the percentage of nuclei with diameters exceeding .10 The average noise magnitude in a clinically measured tissue spectrum corresponds to 100%, but the noise level has been observed to vary from approximately 50 to 150% of the average magnitude.  6.Discussion and ConclusionIn a previous clinical study,1 the residual spectra had amplitudes an order of magnitude larger than estimates based on light propagation and Mie theory. These mistakenly large values were primarily due to the fact that the original DRS analysis, which used Eq. 6 during fitting, assumed hemoglobin in the tissue to be homogeneously distributed. This gave rise to wavelength dependent features in the residual spectra that were incorrectly attributed to light scattering from epithelial nuclei. In actuality, the distribution of hemoglobin is inhomogeneous. After incorporating vessel packaging to account for the hemoglobin distribution, the amplitudes of the residual spectra are greatly reduced. It is important to note that factors other than neglecting vessel packaging, such as experimental noise and additional absorbers, may also have contributed to the residual spectra. The results presented in this work indicate conclusively that epithelial nuclear scattering is not a significant contributor to the clinically observed diffuse reflectance spectra. The results of this work and the findings of other researchers14, 15, 16 show that vessel packaging should be included in modeling diffuse reflectance from tissue. Also, analysis of the influence of various parameters (e.g., wavelength range, hemoglobin concentration, noise magnitude) on the extracted epithelial nuclei parameters indicates that the Fourier-transform analysis is not robust. Further, the epithelial nuclear scattering picture is nonphysical. Therefore, in future studies, vessel packaging should be included in the model of diffuse reflectance, and use of model-based LSS should be discontinued. It is important to note that the conclusions presented in this work are restricted to model-based LSS inferred from residual spectra and do not apply to other similarly named methods/techniques that have been developed and used to study single scattering in epithelial nuclei4, 5, 6 and other cell organelles.7, 8, 9 AcknowledgmentsThis research was primarily conducted at the Massachusetts Institute of Technology Laser Biomedical Research Center and is supported by National Institutes of Health grant P41-RR02594. We would like to thank Irene Georgakoudi for helpful comments. ReferencesI. Georgakoudi, B. C. Jacobson, J. Van Dam, V. Backman, M. B. Wallace, M. G. Muller, Q. Zhang, K. Badizadegan, D. Sun, G. A. Thomas, L. T. Perelman, and M. S. Feld,
“Fluorescence, reflectance, and light-scattering spectroscopy for evaluating dysplasia in patients with Barrett’s esophagus,”
Gastroenterology, 120
(7), 1620
–1629
(2001). https://doi.org/10.1053/gast.2001.24842 0016-5085 Google Scholar
I. Georgakoudi, E. E. Sheets, M. G. Muller, V. Backman, C. P. Crum, K. Badizadegan, R. R. Dasari, and M. S. Feld,
“Trimodal spectroscopy for the detection and characterization of cervical precancers in vivo,”
Am. J. Obstet. Gynecol., 186
(3), 374
–382
(2002). https://doi.org/10.1067/mob.2002.121075 0002-9378 Google Scholar
M. G. Muller, T. A. Valdez, I. Georgakoudi, V. Backman, C. Fuentes, S. Kabani, N. Laver, Z. Wang, C. W. Boone, R. R. Dasari, S. M. Shapshay, and M. S. Feld,
“Spectroscopic detection and evaluation of morphologic and biochemical changes in early human oral carcinoma,”
Cancer, 97
(7), 1681
–1692
(2003). https://doi.org/10.1002/cncr.11255 0008-543X Google Scholar
V. Backman, R. Gurjar, K. Badizadegan, L. Itzkan, R. R. Dasari, L. T. Perelman, and M. S. Feld,
“Polarized light scattering spectroscopy for quantitative measurement of epithelial cellular structures in situ,”
IEEE J. Sel. Top. Quantum Electron., 5
(4), 1019
–1026
(1999). https://doi.org/10.1109/2944.796325 1077-260X Google Scholar
C. C. Yu, C. Lau, J. W. Tunnell, M. Hunter, M. Kalashnikov, C. Fang-Yen, S. F. Fulghum, K. Badizadegan, R. R. Dasari, and M. S. Feld,
“Assessing epithelial cell nuclear morphology by using azimuthal light scattering spectroscopy,”
Opt. Lett., 31
(21), 3119
–3121
(2006). https://doi.org/10.1364/OL.31.003119 0146-9592 Google Scholar
A. Wax, C. H. Yang, V. Backman, K. Badizadegan, C. W. Boone, R. R. Dasari, and M. S. Feld,
“Cellular organization and substructure measured using angle-resolved low-coherence interferometry,”
Biophys. J., 82
(4), 2256
–2264
(2002). https://doi.org/10.1016/S0006-3495(02)75571-9 0006-3495 Google Scholar
M. Hunter, V. Backman, G. Popescu, M. Kalashnikov, C. W. Boone, A. Wax, V. Gopal, K. Badizadegan, G. D. Stoner, and M. S. Feld,
“Tissue self-affinity and polarized light scattering in the Born approximation: A new model for precancer detection,”
Phys. Rev. Lett., 97
(13), 138102
(2006). https://doi.org/10.1103/PhysRevLett.97.138102 0031-9007 Google Scholar
H. Fang, M. Ollero, E. Vitkin, L. M. Kimerer, P. B. Cipolloni, M. M. Zaman, S. D. Freedman, I. J. Bigio, I. Itzkan, E. B. Hanlon, and L. T. Perelman,
“Noninvasive sizing of subcellular organelles with light scattering spectroscopy,”
IEEE J. Sel. Top. Quantum Electron., 9
(2), 267
–276
(2003). https://doi.org/10.1109/JSTQE.2003.812515 1077-260X Google Scholar
J. R. Mourant, M. Canpolat, C. Brocker, O. Esponda-Ramos, T. M. Johnson, A. Matanock, K. Stetter, and J. P. Freyer,
“Light scattering from cells: the contribution of the nucleus and the effects of proliferative status,”
J. Biomed. Opt., 5
(2), 131
–137
(2000). https://doi.org/10.1117/1.429979 1083-3668 Google Scholar
V. Backman, M. B. Wallace, L. T. Perelman, J. T. Arendt, R. Gurjar, M. G. Muller, Q. Zhang, G. Zonios, E. Kline, T. McGillican, S. Shapshay, T. Valdez, K. Badizadegan, J. M. Crawford, M. Fitzmaurice, S. Kabani, H. S. Levin, M. Seiler, R. R. Dasari, I. Itzkan, J. Van Dam, and M. S. Feld,
“Detection of preinvasive cancer cells,”
Nature, 406
(6791), 35
–36
(2000). https://doi.org/10.1038/35017638 0028-0836 Google Scholar
M. B. Wallace, L. T. Perelman, V. Backman, J. M. Crawford, M. Fitzmaurice, M. Seiler, K. Badizadegan, S. J. Shields, I. Itzkan, R. R. Dasari, J. Van Dam, and M. S. Feld,
“Endoscopic detection of dysplasia in patients with Barrett’s esophagus using light-scattering spectroscopy,”
Gastroenterology, 119
(3), 677
–682
(2000). https://doi.org/10.1053/gast.2000.16511 0016-5085 Google Scholar
L. T. Perelman, V. Backman, M. Wallace, G. Zonios, R. Manoharan, A. Nusrat, S. Shields, M. Seiler, C. Lima, T. Hamano, I. Itzkan, J. Van Dam, J. M. Crawford, and M. S. Feld,
“Observation of periodic fine structure in reflectance from biological tissue: a new technique for measuring nuclear size distribution,”
Phys. Rev. Lett., 80
(3), 627
–630
(1998). https://doi.org/10.1103/PhysRevLett.80.627 0031-9007 Google Scholar
H. C. v. d. Hulst, Light Scattering by Small Particles, Dover Publications, New York
(1981). Google Scholar
R. L. P. van Veen, W. Verkruysse, and H. J. C. M. Sterenborg,
“Diffuse-reflectance spectroscopy from by correction for inhomogeneously distributed absorbers,”
Opt. Lett., 27
(4), 246
–248
(2002). https://doi.org/10.1364/OL.27.000246 0146-9592 Google Scholar
L. O. Svaasand, E. J. Fiskerstrand, G. Kopstad, L. T. Norvang, E. K. Svaasand, J. S. Nelson, and M. W. Berns,
“Therapeutic response during pulsed laser treatment of port-wine stains: Dependence on vessel diameter and depth in dermis,”
Lasers Med. Sci., 10
(4), 235
–243
(1995). https://doi.org/10.1007/BF02133615 0268-8921 Google Scholar
J. C. Finlay and T. H. Foster,
“Effect of pigment packaging on diffuse reflectance spectroscopy of samples containing red blood cells,”
Opt. Lett., 29
(9), 965
–967
(2004). https://doi.org/10.1364/OL.29.000965 0146-9592 Google Scholar
V. Backman,
“Reflectance spectroscopy for diagnosis of precancerous changes in human epithelium,”
Massachusetts Institute of Technology,
(1998). Google Scholar
G. Zonios, L. T. Perelman, V. M. Backman, R. Manoharan, M. Fitzmaurice, J. Van Dam, and M. S. Feld,
“Diffuse reflectance spectroscopy of human adenomatous colon polyps in vivo,”
Appl. Opt., 38
(31), 6628
–6637
(1999). https://doi.org/10.1364/AO.38.006628 0003-6935 Google Scholar
T. J. Farrell, M. S. Patterson, and B. Wilson,
“A diffusion-theory model of spatially resolved, steady-state diffuse reflectance for the noninvasive determination of tissue optical-properties in vivo,”
Med. Phys., 19
(4), 879
–888
(1992). https://doi.org/10.1118/1.596777 0094-2405 Google Scholar
S. A. Prahl,
“Optical properties of hemoglobin,”
(1999) http://omlc.ogi.edu/spectra/hemoglobin/index.html Google Scholar
A. Amelink, H. J. C. M. Sterenborg, M. P. L. Bard, and S. A. Burgers,
“In vivo measurement of the local optical properties of tissue by use of differential path-length spectroscopy,”
Opt. Lett., 29
(10), 1087
–1089
(2004). https://doi.org/10.1364/OL.29.001087 0146-9592 Google Scholar
S. L. Robbins and R. S. Cotran,
“Pathologic basis of disease,”
7 1598
(1979) Google Scholar
|


