
|
|
1.IntroductionOptical tomography using near-infrared (NIR) diffused light has shown great promise in distinguishing benign from malignant breast tumors and in assessing the chemotherapy response of breast cancers.1, 2, 3, 4, 5, 6, 7, 8, 9, 10, 11, 12, 13, 14, 15, 16, 17 Three typical imaging probe configurations or geometries have been used by researchers to acquire NIR data from multiple sources and detectors for tomographic imaging or spectroscopy of breast lesions. The three imaging geometries are transmission,4, 5, 7, 11, 12 ring,3, 6, 8 and reflection,1, 2, 13 which measure light transmission, transmission and reflection, and reflection, respectively. In transmission geometry or ring geometry, breasts are either sandwiched between a pair of source and detector planes or surrounded by sources and detectors deployed in a ring or multiple rings. Using these two geometries, lesions close to the chest wall are very difficult to access. In reflection geometry, hand-held probes are typically used 1, 2, 13 to acquire light reflectance from the surface of the breast. Reflection geometry has a significant advantage of probing reduced breast tissue thicknesses when compared with transmission and ring geometries. In reflection geometry, patients are scanned in a supine position, and the breasts are generally flat and can be further compressed as conventionally done with pulse-echo ultrasound imaging. These factors allow lesions closer to the chest wall to be imaged. We have adopted the light reflection geometry and also integrated the NIR source and detector fibers with a commercial ultrasound transducer on a hand-held probe for dual-modality breast imaging and for ultrasound-guided optical tomography.13, 16 A semi-infinite geometry of an absorbing boundary condition was used for optical reflection measurements, and the standard pulse echo mode was used for ultrasound imaging. Patients were scanned in a supine position, and multiple sets of optical measurements were simultaneously made with ultrasound images of a lesion location and of a contralateral normal breast in the same quadrant. The perturbation was calculated as the difference between lesion and reference measurements. Background (bulk) tissue absorption and reduced scattering coefficients were estimated from the reference measurement, and a modified Born approximation was used to relate the scattered field or perturbation measured at all source–detector pairs to total absorption variations within the sample. Two different imaging grids were used for optical imaging reconstruction. The finer mesh was mapped to the lesion region visible with ultrasound, and the coarser mesh was mapped to background tissue. As a result, the total number of imaging voxels with unknown optical properties was significantly reduced, and the tomographic inversion was well defined and converged in few iterations.13 In general, the breast tissue thickness has been reduced to less than when patients are scanned in supine positions. Therefore, lesions close to the chest wall can be imaged with good sensitivity. However, when the chest wall underneath the breast tissue is present within from the skin surface, it affects the measurements and the reconstructed images. In addition, the chest wall, with respect to the image probe, can be tilted at different angles, which can complicate the measurements. Figure 1 shows simulation and experimental measurements of light reflectance (in a logarithmic scale) versus source-detector distance . Figures 1a and 1b are simulated and measured data from a homogenous medium (black), a two-layer phantom with the second layer located at (blue), and depth (red), respectively. The interface between top and bottom layers was flat with a zero-degree tilting angle. As seen from (a) and (b), the presence of the second layer changes the slope of light reflectance from that acquired in a homogeneous medium. Figures 1c and 1d are simulated and experimental data from the homogeneous medium (black) and the two-layer phantom with the interface located at and depth and tilted at with respect to the surface. As seen in Figs. 1c and 1d, the tilting of the interface scatters the light reflection data to a larger angular region compared to those acquired with a flat interface.18 Fig. 1Co-registered ultrasound images of a two-layer phantom with the second layer located at and depth (flat interface) (b, top) and (tilted interface) (d, top). Corresponding light reflectance data (logarithmic scale) versus source–detector distance of the two-layer phantom (bottom). Parts (a) and (c) show simulation results, and (b) and (d) show experimental data. Each figure shows three sets of data obtained from a homogenous medium (black), a two-layer phantom with the second layer located at (blue) and (red) depth, respectively. The slopes of the first order fit to simulated data shown in (c) are (homogeneous medium), ( depth), and ( depth), respectively. The slopes of experimental data shown in (d) are (homogeneous), , and ( depth), respectively. (Color online only.)  In optical tomography, a typical perturbation approach requires two sets of measurements obtained at lesion breast (lesion or target site) and contralateral normal breast (reference site) to compute the perturbation. Therefore, the chest wall underneath the breast tissue at both sites affects the imaging results. In this paper, we provide systematic analysis of how lesion and reference mismatch in terms of chest-wall depth, tilting angle, and background tissue absorption and reduced scattering coefficient can affect the target quantification and distort the imaging quality. Our analysis will be valuable and informative to researchers who are using reflectance geometry for breast imaging. The analysis can also provide guidelines for imaging operators to minimize the mismatch between the two sites using real-time ultrasound information and to produce the best imaging results. To the best of our knowledge, such analysis is not available in the literature. 2.Methods and Computational ProceduresThe problem under study can be mathematically modeled as a cylinder with two distinct layers of different optical properties, as shown in Fig. 2 . The layer thicknesses, interface geometry (tilting angle), and lesion size and location are inferred from a co-registered ultrasound (US) measurement. Two sets of measurements are obtained at contralateral normal breast (reference site) and lesion breast (lesion or target site). Measurement data from contralateral normal breast are used to estimate the optical properties of each layer in breast-tissue and chest-wall media based on the optimization method introduced in Sec. 2.2. Both sets of measurements together with US information and two-layer optical properties are used in image reconstruction algorithms addressed in Secs. 2.3, 2.4. 2.1.Forward ModelIn our simulations, the frequency domain diffusion approximation and the Robin-type (type III) boundary condition have been adopted for forward computation.19 A commercial software package using finite element method (FEM), COMSOL, has been employed to solve the forward diffusion equation. A 3-D cylindrical mesh is generated for forward calculation. The optical source is modeled as an isotropic point source placed approximately one reduced scattering distance, , underneath the boundary, where and are the reduced scattering and absorption coefficients of the first layer. The radius and the height of the cylinder are large enough to approximate the semi-infinite geometry. A smooth surface is used to model the tissue and the chest-wall interface. The chest-wall tilting angle with respect to the probe and the tissue-chest interface location in depth are determined by the co-registered ultrasound images. Figure 2 gives an example of a two-layer model configuration. Figure 2a shows a B-scan ultrasound image of a normal breast with the tilted chest wall marked, and Fig. 2b is the corresponding two-layer model generated. 2.2.Estimation of Two-Layer Bulk Absorption and Reduced Scattering CoefficientsFEM has been used to relate the bulk absorption and reduced scattering coefficients of the first and second tissue layers to the photon density wave calculated at the surface as where , , , and are absorption and reduced scattering coefficients of the first and second layers, respectively. FEM is desirable for modeling an arbitrary interface of breast tissue and chest wall. A nonlinear optimization algorithm (Nelder-Mead algorithm)20 is used with FEM forward calculation to estimate the two-layer background optical properties.2.3.Weight Matrix Calculation Using the Two-Layer ModelThe forward Jacobian weight matrix , which relates the photon density wave perturbation at detector and imaging voxel with absorption coefficient change , is calculated as where is the total number of measurements, and is the total number of imaging voxels.19 To speed up the Jacobian matrix calculation and also to improve the matrix inversion, we have used a region of interest (ROI) for the weight matrix calculation and imaging display.13 For simulation and phantom experiments and the reported clinical case, the imaging voxel size within ROI is chosen as , and the pixel outside of ROI is chosen as . In all simulations and phantom images, we have chosen an ROI in and dimensions for a target size of diameter to demonstrate the effect of different mismatches.Using a larger ROI helps visualize the effects of mismatches; however, it reduces the reconstructed target absorption coefficients. With the ultrasound spatial location guidance, we typically use a tighter ROI of two times the target size to improve the accuracy of reconstructed absorption coefficient. For a -diam high-contrast absorber, we can achieve about 80% accuracy when the maximum value of reconstructed absorption distribution is used.21 For a low-contrast absorber of the same size, about 100 to 120% of true values can be achieved. The reconstructed absorption values presented in this manuscript correspond to results with only target depth guidance, and they are lower than those with additional spatial guidance. Therefore, we have used the percentage of the reconstructed target absorption normalized to the no-background mismatch case to highlight the relative changes in simulation and phantom studies. 2.4.InversionLast, a dual mesh model and a conjugate gradient method are used for reconstruction of optical absorption properties of lesion with the location information provided by the co-registered ultrasound measurement. 2.5.Experimental SystemOur experimental system consists of three laser diodes of 690, 780, and and 10 parallel detectors. Each laser diode is sequentially switched to nine source positions on the probe, and 10 parallel detection channels acquire backscattered light simultaneously for each source position. More details on our hand-held imaging probe and the NIR system can be found in Ref. 22. For phantom experiments, intralipid solution and solid plastisol phantoms have been used to emulate the first and second tissue layers, respectively. A commercial ultrasound probe is located in the middle of the hand-held probe to provide the tilting angle and the depth of the second layer and also the region of the target. Each two-layer phantom is imaged with and without a target. The data without a target is used for estimation of background optical properties, and the difference between the target and background data is used to compute perturbation for imaging reconstruction. The optical properties of the two layers of the phantom were calibrated separately by using a least-squares fitting procedure detailed in Ref. 23. Hereafter, we will refer to these calibrated values as true background optical properties. Briefly, the gains of different source positions and different detector positions as well as the slopes of amplitude (a logarithmic scale) and phase measurements versus source–detector separation were estimated by fitting the measured data using a semi-infinite model of an absorbing boundary condition. The background absorption and reduced scattering coefficients can be readily obtained from the estimated slopes of amplitude and phase measurements. We also estimated the two-layer optical properties by fitting the reflection measurements using the nonlinear Nelder-Mead algorithm described in Sec. 2.2. We refer to these background values as fitted optical properties in the following text. Our data acquired from patients suggest that typical optical absorption coefficients of cancers were in the range of .(Ref. 14) For typical benign lesions, the absorption coefficients were in the range of . Scattering coefficient of lesions was not consistent. For larger tumors, scattering could be quite low compared with the background; while for smaller tumors, scattering coefficient could be higher or lower than that of the background. Therefore, we have chosen an absorption coefficient of to represent high-contrast tumors, and to represent benign lesions. We have used similar reduced scattering coefficients for background and targets. The same setup has been used for clinical studies. The study protocol has been approved by a local Institutional Review Board (IRB) committee. Patients have been scanned in a supine position, and multiple sets of optical measurements were made simultaneously with co-registered ultrasound images of the lesion breast and the normal contralateral breast in the same quadrant as the lesion. Data at the contralateral breast have been used for the estimation of background optical properties as well as the calculation of perturbation for image reconstruction. 3.Results3.1.Effect of Layer Depth Mismatch between Lesion and ReferenceFigure 3 shows simulation results of two-layer interface depth mismatch between the reference and target sites. In the simulation, the second layer of the target site was kept at depth, and the second layer of the reference site was varied from , to , and to in Figs. 3a, 3b, 3c, and to and in Figs. 3d and 3e, respectively. The optical properties of two layers were chosen as , , , and . The target optical properties were chosen as and . When the second-layer depth of the reference site matches the second-layer depth of the target site, the reconstructed target appears at the correct location with no artifacts [Figs. 3(a-1)]. The reconstructed maximum absorption coefficient was only 39% of the true value because of the use of a larger ROI (8 times the target size) in spatial dimension. With a tighter ROI (two times the target size) in spatial dimension, the reconstructed maximum absorption coefficient reached 78% of the true value [Figs. 3(a-2)]. The scale of figures (a-2) was adjusted to show a better quantification of the target. To highlight the relative changes when the second-layer depth and titling angle as well as the bulk optical properties of the two layers were varied, we have used 8 times target size as the ROI in the rest of the simulation and phantom studies. Therefore, the results are pertinent to optical tomography with target depth guidance only. Fig. 3Effect of second-layer depth mismatch between the reference site and the target site. The second layer at the reference site was located at (a) , (b) , (c) , (d) , and (e) in depth. The second layer of the target site was located at depth. Background optical properties at both reference and target sites are , , , and . The top picture of each part shows the position of the second layer and the target, and the bottom pictures [(a-1) and (b) to (e)] show the reconstructed absorption maps using an ROI of eight times the target size, while the bottom picture (a-2) shows the absorption maps reconstructed with an ROI of two times the target size. The color bar is the absorption coefficient in units of , and color bars in (a-2) was adjusted to for better visualization of the target. In the absorption map, each slice presents a spatial image of obtained from underneath the probe surface to in depth, with spacing between slices. The spatial image dimensions for each slice in the absorption map and the spacing between the slices were kept the same as in Fig. 3 in the following figures except in Fig. 14. (Color online only.)  When the second layer of the reference site is deeper than that of the target site, image artifacts appear. The artifact is more pronounced when the second layer is deeper [Figs. 3b and 3c]. When the second layer of the reference site was placed at a lower depth than that of the target site, for example, at 1.4 or , the reconstructed absorption coefficient and the size of the target became lower and smaller [Figs. 3d and 3e]. The decrease in reconstructed absorption coefficient of the target depends on the optical properties of the two-layer media at the target and reference sites and the depth mismatch. Table 1 shows the fitted optical properties of the two layer media used in obtaining Fig. 3. The nonlinear Nelder-Mead algorithm discussed in Sec. 2.2 was used for fitting and 1% noise was added to the simulated data. The fitting error of is larger when the second layer is deeper.24, 25 Using the fitted background optical properties, we reconstructed the target again, and the percentage of maximum reconstructed absorption coefficient versus the reference interface depth is shown in Fig. 4 . Compared to those obtained using true background values, the results of using fitted background values are essentially the same. Fig. 4Percentage of maximum reconstructed absorption coefficient of the target normalized to the no-background mismatch case as a function of the two-layer interface depth at the reference site using both calibrated background and fitted background optical properties (simulation data). The two-layer interface at the target side is located at from the probe.  Table 1Fitted optical properties of two-layer media used in Fig. 3.
To validate the simulation results, we performed phantom experiments. An example of phantom experiments is given in Fig. 5 . Figure 5a shows a B-scan ultrasound image of the two-layer medium with a low-contrast absorber located at inside the intralipid solution (target site). The top layer of the phantom was made of a homogeneous 0.8% intralipid solution of calibrated values and , and the bottom layer was a solid phantom made of plastisol of calibrated values and at . The target was a -diam spherical absorber of calibrated optical properties and at . The plasitsol phantom was used as a chest-wall layer and placed at underneath the intralipid with zero-degree tilt. Figure 5b is a B-scan ultrasound image of the phantom without target (reference site). Figure 5c shows the reconstructed absorption map at , which is an ideal image obtained without any mismatch. Figure 5d shows a B-scan ultrasound image of the two-layer medium with the target. The image is the same as Fig. 5a. Figure 5e is a B-scan ultrasound image of the reference site with the plastisol phantom placed at depth underneath the intralipid with zero-degree tilt. Figure 5f shows the reconstructed absorption map at . The image artifacts pattern is similar to the one obtained from simulations under the same conditions. Fig. 5Reconstructed absorption map of a -diam spherical target with calibrated optical properties and , located at . (a) B-scan ultrasound image of a two-layer medium with the target. A plastisol phantom was located at underneath the probe surface with a zero-degree tilting angle. (b) B-scan ultrasound image of the phantom without the target. (c) Reconstructed target absorption map at . (d) B-scan ultrasound image of the two-layer medium with the target [same as (a)]. (e) The two-layer medium with the plastisol phantom located at with a zero-degree tilting angle. (f) Reconstructed target absorption map at .  A sequence of phantom experiments was performed to further validate the simulation results. The top layer of the phantom was made of a homogeneous 0.8% intralipid solution of calibrated optical properties and , and the bottom layer was a solid phantom made of plastisol of calibrated values and at . The target was a -diam spherical absorber of calibrated optical properties and at . The two-layer interface was located at from the probe at the target site, and it varied from at the reference site. The target and reference measurements were made from the two-layer medium with and without the target, respectively. The percentage of maximum reconstructed absorption coefficient of the target normalized to the no-background mismatch case using both calibrated and fitted background optical properties is shown in Fig. 6 . The fitted optical properties of the two-layer media for the phantom experiments are given in Table 2 . The error of the fitted second layer is larger when the second layer is deeper.24, 25 However, the reconstructed target is reasonably robust to the fitting error. Fig. 6Percentage of the maximum reconstructed normalized to the no-background mismatch case as a function of the two-layer interface depth at the reference site (phantom data) using both calibrated background and fitted background optical properties values. The two-layer interface at the target site is located at depth from the probe. 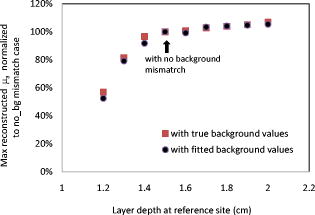 Table 2Fitted optical properties of two-layer phantoms.
The preceding reported simulation and experimental results can be explained intuitively. As the second layer at the reference site becomes shallower, more photons are absorbed by the second layer, and therefore fever photons are detected at the surface. As a result, the perturbation, which is the normalized difference between lesion data and reference data, is reduced. This reduction in perturbation degrades the target reconstruction accuracy and reduces the target contrast. Certainly, the reduction in the reconstructed target absorption with depth mismatch depends on the optical properties of the two layers and target contrast. On the other hand, as the second layer at the reference site becomes deeper, fever photons are absorbed by the second layer and more are detected at the surface of the reference site. As a result, the perturbation consists of both portions caused by lesion and lesion-reference background mismatch. The perturbation caused by lesion-reference background mismatch produces image artifacts in background regions and increases the reconstructed absorption coefficient of the target. 3.2.Effect of Mismatch Tilting Angle between Lesion and Reference Sites on Image ReconstructionAs shown in Fig. 1, when the second layer is tilted with respect to the imaging probe, the amplitude and phase (not shown) measurements spread over a larger angular region. Figure 7 demonstrates the effect of mismatch between the interface tilting angle in reference and lesion measurements. In this set of simulations, the second-layer depth in both the target and reference measurements was kept at , and the interface angle at the target site was zero deg. The mismatch at the second layer of the reference site was introduced as , , 0, 5, or in the or direction. The optical properties of the two layers were chosen as , , , and . The target optical properties were chosen as and . In our system, the ultrasound probe is located at the center of the optical probe. Therefore, with the assistance of the real-time ultrasound image, the lesion is always positioned in the center of the optical probe. The results show that the mismatch angle introduces a target position shift and reduces the accuracy of the reconstructed absorption coefficient. Figure 8 shows the percentage of maximum reconstructed relative to the values obtained with the flat interface (no-background mismatch) as a function of the tilting angle difference between the target and the reference sites. As a result of this lesion-reference tilting angle mismatch, the reconstructed target degrades in accuracy and shifts in position. Fig. 7Reconstructed absorption maps of a target located at . The first-and second-layer interfaces of both the target and the reference site were positioned at depth. The interface at the target site has a zero-degree tilting angle. (a) to (i) sequentially show the absorption maps of the target with a target–reference layer tilting angle mismatch of (a) , (b) , (c) , (d) , and (e) in the direction, and of (f) , (g) , (h) , and (i) mismatch in the direction. Optical properties of both the reference and target sites are , , , and The top picture of each part shows the position of the second layer and the target, and bottom picture shows the reconstructed absorption map. 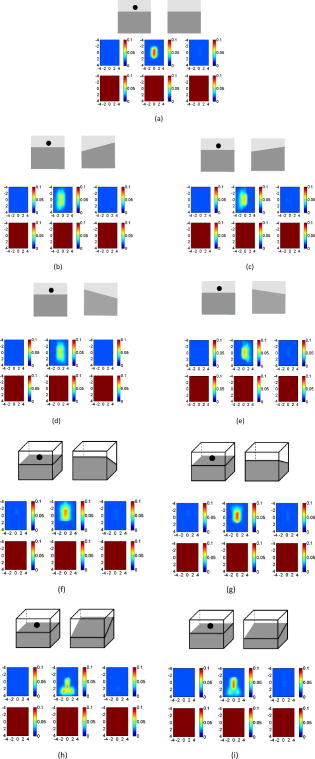 Fig. 8Percentage of maximum reconstructed relative to the values obtained with the flat interface (no-background mismatch) as a function of the difference between the tilting angle of the two-layer interface at the target and reference sites. 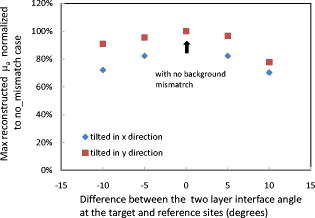 We validated the simulation results with phantom experiments using the same setup and the target as described in the previous section. Figure 9a shows a B-scan ultrasound image of a two-layer medium with target located at . The solid phantom was used as a chest-wall layer and placed underneath the intralipid at with a zero-degree tilting angle. Figure 9b is the B-scan ultrasound image of the same phantom without target and titling angle. Figure 9c shows the reconstructed absorption map at . Similar distortion effects are observed as seen in simulations. Fig. 9Reconstructed absorption map of -diam spherical target located at (0, 0, ) with calibrated optical properties and . (a) B-scan ultrasound image of a two-layer medium with target. The plastisol phantom was located at with a zero-degree tilting angle. (b) B-scan ultrasound image of the same phantom without the target. The layer was located at with tilting angle. (c) Reconstructed target absorption map at . 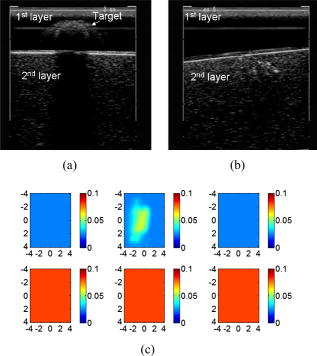 3.3.Effect of Optical Property Mismatch between Lesion and Reference MediaIn this section, we investigate the effect of background optical properties on image reconstruction. In our clinical experiments, background optical properties were estimated from the normal contralateral breast of the same quadrant with the assumption that both breasts at the symmetric locations have similar bulk optical properties. This is not a problem in general (see Sec. 4). However, for patients who have reconstructed contralateral breasts due to prior surgery, the estimated bulk optical properties at the reference site can be different from the lesion site regardless of the absorption properties of the lesion. For patients with contralateral disease, the optical properties of the reference site may also defer from that at the lesion site. Figure 10 demonstrates the effect of mismatch between the first-layer absorption coefficient of reference site and the lesion site. The first-layer absorption coefficient has been chosen as (intralipid) and (intralipid with ink). Other optical properties have calibrated values of , , and . The target is the solid phantom with calibrated optical properties of and . Figure 10 shows the reconstructed image, and Fig. 11 shows the changes in the reconstructed absorption coefficient for cases when the target site has higher, equal, and lower first-layer absorption coefficient compared to the reference site. The comparison has been made using both the true and fitted background optical properties, and the results are essentially the same. The fitted optical properties of the two-layer media were , , , and for the case of higher first-layer at the target site and , , , and for the case of lower at the target site. Fig. 10Effect of first-layer mismatch between the reference site and the target site on the reconstructed image. First-layer optical properties at the target and reference sites are (a) , ; (b) , ; (c) , ; and (d) , . The other background optical properties of both the reference and target sites are , , and . The optical properties of the target are and .  Fig. 11Percentage of maximum reconstructed normalized to the no-background mismatch case using both calibrated and fitted background values. Lower shows the results when and , and higher shows the results when , and . The other optical properties of both the target and reference sites are , , and .  The preceding experiments can be explained intuitively. As the first-layer background absorption of the reference site increases, more photons are absorbed and fewer photons are reflected. As a result, the perturbation is reduced as compared with no mismatch, and the reconstructed target contrast is lower and the target mass becomes smaller. On the other hand, lower of the reference site or higher of the target site increases the perturbation caused by non-target-related background mismatch, which contributes to image artifacts in the background regions. The effect of the first layer mismatch on the reconstructed absorption coefficient of the target is shown in Fig. 12 . The top layer of the phantom was made of a homogeneous intralipid solution of different concentrations. The calibrated varied from with , and the bottom layer was a solid plastisol phantom with calibrated values of and at . The target was the -diam spherical absorber of calibrated optical properties and at . While was changed from at the target site, it was fixed to at the reference site. Other optical properties of both reference and target sites were , , and . Figure 13 shows the percentage of reconstructed absorption coefficient of the target normalized to the no-background mismatch case using both true and fitted values of two-layer optical properties. The fitted optical properties of the two-layer medium were , , , and . Fig. 12Effect of the first-layer mismatch on the reconstructed absorption map of the target. The first-layer reduced scattering coefficient at the target site is (a) , (b) , (c) , (d) , (e) , and (f) , respectively. at the reference site is . Other optical properties of both the reference and lesion sites are , , and . 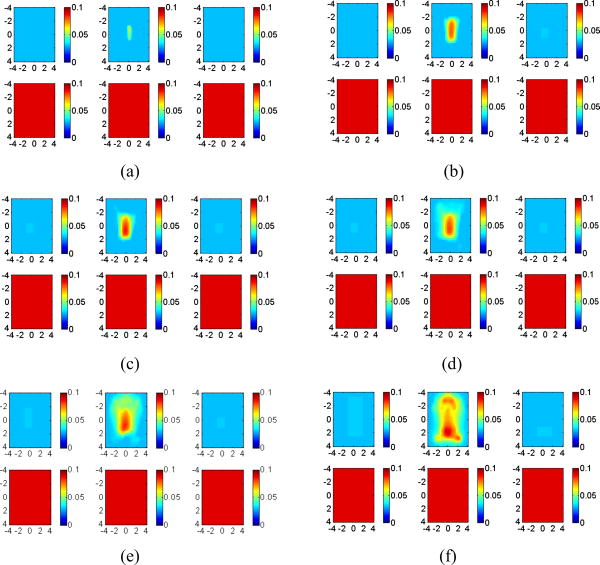 Fig. 13Percentage of maximum reconstructed normalized to the no-background mismatch case as a function of first-layer reduced scattering coefficient at the target site using both calibrated and fitted background optical properties. The reduced scattering coefficient is at the reference site.  As shown in Figs. 12 and 13, a higher background scattering at the target site produces image artifacts, and a lower background scattering causes reduction in target contrast. This is because the higher background scattering at the target site increases the perturbation due to decreased signal strength measured at the target site. The extra perturbation due to background scattering mismatch contributes to the image artifacts in the background region, while the lower background scattering at the lesion site causes the reduction in perturbation due to the increased signal strength measured at the target site. As a result, the reduction in perturbation due to scattering mismatch causes the decrease in reconstructed target absorption. 3.4.Clinical ExamplesTo evaluate the mismatch in breast imaging, we reconstructed the absorption map of a benign fibroadenoma using three different reference sites acquired at the contralateral breast. Figure 14a shows a co-registered ultrasound B-scan of the lesion. The center of the lesion was at depth, and the chest-wall layer was located approximately at with an tilting angle. The fitted optical properties of the background were , , , at . Figure 14b shows the US B-scan of the first reference and the corresponding reconstructed absorption map at . The chest-wall interface at the reference is almost flat and located at depth. Figure 14c shows the second reference used and the reconstructed absorption map. This reference is deeper and tilted compared to the lesion site; therefore, the lesion mass was more spread out compared to part (a). Figure 14d shows the third reference and the reconstructed absorption map. This reference is almost flat and deeper than the reference in part (a); therefore, the lesion mass was more spread out compared to part (a). Due to the depth mismatch, some artifacts appeared in the figure; however, since the chest-wall and breast tissue of clinical cases are not homogenous and their interference is not well-defined as in the phantom and simulation studies, the artifacts are not as pronounced as the phantom and simulation. The reconstructed maximum and average of lesion for different reference sites are listed in Table 3 . Fig. 14Co-registered ultrasound and reconstructed absorption maps of a benign fibroadenoma. (a) B-scan ultrasound image of the lesion site. The chest-wall layer was located at with tilt. (b) B-scan ultrasound of the first reference site and the reconstructed absorption maps at . (c) B-scan ultrasound of the tilted reference site and the reconstructed absorption maps at . (d) B-scan ultrasound of the third reference site and the reconstructed absorption maps at . Each slice presents a spatial image of obtained from underneath the probe surface to in depth, with spacing between slices. 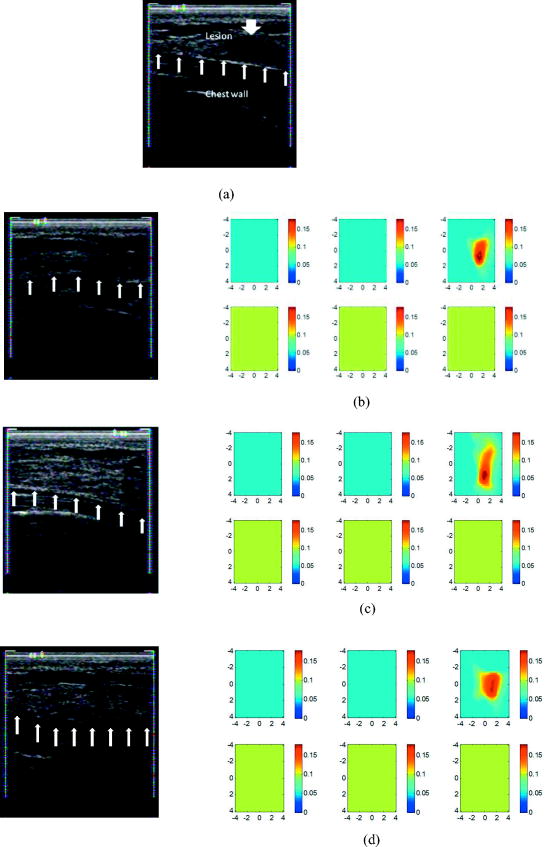 Table 3Comparison of four parameters for the clinical case shown in Fig. 14: interface depth and tilting angle of the two-layer interface at the reference site and maximum and mean values of the reconstructed target absorption coefficient. 4.DiscussionIn this paper, the effects of depth, tilting angle, and optical property mismatch between the reference and lesion sites of two-layer media on image reconstruction have been systematically investigated. Depth mismatch of the second layer between reference and lesion sites can produce image artifacts or reduce target contrast in reconstructed images. If the second-layer depth at the reference site is shallower than that at the target site, the reconstructed target absorption and target size are reduced. On the other hand, when the second-layer depth at the reference site is deeper than that at the target site, the reconstructed image has multiple artifacts in background regions cased by target-reference background mismatch. Angle mismatch between the target and reference layers reduces the reconstructed target contrast and shifts the target position. Mismatch between optical properties of reference and lesion layers can also introduce artifacts or reduce target contrast. This study focused on characterizing and understanding the effect of chest-wall mismatch between lesion and reference sites. We have used the percentage of the reconstructed target absorption normalized to the no-background mismatch case to highlight the relative changes in simulation and phantom studies. The ROI used for reconstruction with a finer mesh was eight times larger than the target size. A large ROI helps visualize the effects of mismatches, especially in the background regions. However, a large ROI reduces the reconstructed target absorption coefficients, as demonstrated in Fig. 3a. With ultrasound spatial location guidance, we typically use a tighter ROI of two times target size to improve light qualification. As shown in Fig. 3a and our previous studies, we can achieve about 80% accuracy for high-contrast targets when the maximum value of reconstructed absorption map is used, and about 100 to 120% the true value for low-contrast targets.21 With spatial guidance in addition to target depth from the co-registered ultrasound, the target artifacts at the background region can be recognized and further reduced. In clinical cases, where the breast tissue and chest-wall interfaces are not well-defined, the artifacts are less pronounced than the phantom and simulation studies. Breasts of each patient are symmetric with respect to density, tissue components, and shape as well as chest-wall position. In our clinical studies, we use real-time co-registered ultrasound to position the hand-held probe at the lesion site and the contralateral reference site of the same quadrant by matching the probe position and the chest-wall layer depth. This effort minimizes the mismatch and produces the best imaging reconstruction results. Because our probe covers about diam area of tissue, the fitted optical properties at the carefully chosen reference site are the best representations of the average properties of the contralateral lesion location. The estimated bulk optical properties are quite similar at the symmetric sites. Table 4 lists bulk optical properties obtained from 10 consecutive patients with different chest-wall conditions. The measurements were taken from the same quadrant at left and right breasts without any known disease. The fitting was based on a one-layer semi-infinite model. On average, the bulk absorption and reduced scattering coefficients between left and right differ in absolute value by and at , respectively. At , the bulk absorption and reduced scattering coefficients differ in absolute value by and , respectively. Note that the background optical absorption is higher for patients 2 to 4 because the fitting is affected by the presence of a shallower chest wall. Table 4Bulk optical properties of 10 consecutive patients obtained from left and right healthy breasts at the same quadrant.
However, this data acquisition process depends on the operators’ knowledge and skills. Therefore, the reported studies provide important guidelines to imagers and also help with interpretation of imaging results. In many cases, the perfect matching between chest-wall layer depths at both sites is not obtainable; for example, patients have contralateral diseases. For these cases, the reference should be chosen as close as possible to the lesion site if the chest wall is within depth. Currently, we are investigating procedures and algorithms to model the mismatch and to compensate the mismatch-induced perturbation. Optical properties of breast tissue vary from patient to patient. From literature data and our own experience, the bulk absorption coefficient is in the range of , and the reduced scattering coefficient is in the range of . As shown in Table 4, the fitted optical properties using a one-layer semi-infinite model were affected by the chest-wall locations for patients with shallower chest walls. As a result, the reconstructed lesion absorption coefficient is typically higher for this subgroup of patients because the high background value contributes to the total target . Our initial experience obtained by fitting the two-layer optical properties of this subgroup of patients suggests21 that the fitted first-layer is in general lower than the fitted background obtained from the one-layer model and that the fitted second-layer is in general higher than the fitted one-layer . The fitted first-layer is similar or higher than the fitted obtained from the one-layer model, and the fitted second-layer is in general similar or lower than the fitted one-layer . Two-layer imaging reconstruction in general improves the accuracy of the reconstructed target because of the use of more accurate first-layer background . The optical properties of the chest wall are not available in the literature. The only available data are optical properties of muscles and bones. In Refs. 26, 27, 28, muscle was reported to have a large absorption and medium scattering coefficients, with in the range of and in the range of . Bone is a highly absorbing and scattering medium. From the literature,29, 30 bone was reported to have large absorption and scattering coefficients, with in the range of and in the range of . Our data on agrees with the limited literature data that muscles and bones have higher average . More clinical cases are being evaluated for this subgroup of patients, and the statistics will be valuable to breast imagers using diffused wave optical tomography. The reported studies pertain to the use of optical tomography using a perturbation approach. Other model-based approaches may have advantages over the perturbation approach in this regard. However, breast tissue has a wide range of background absorption and reduced scattering coefficients, and these bulk tissue values change with age, menopause status, hormone regulation, etc.31 The model-based approach may have great difficulty adapting to this wide range of bulk optical properties, while the perturbation approach of using a patient normal site as a control greatly minimizes this problem. AcknowledgmentsThis work has been supported by the National Institute of Health (R01EB002136) and the Patrick & Catherine Weldon Donaghue Medical Research Foundation. ReferencesB. J. Tromberg, A. Cerussi, N. Shah, M. Compton, A. Durkin, D. Hsiang, J. Butler, and R. Mehta,
“Diffuse optics in breast cancer: detecting tumors in pre-menopausal women and monitoring neoadjuvant chemotherapy,”
Breast Cancer Res., 7 279
–285
(2005). https://doi.org/10.1186/bcr1358 Google Scholar
B. Chance, S. Nioka, J. Zhang, E. F. Conant, E. Hwang, S. Briest, S. G. Orel, M. D. Schnall, and B. J. Czerniecki,
“Breast cancer detection based on incremental biochemical and physiological properties of breast cancers: a six-year, two-site study,”
Acad. Radiol., 12 925
–933
(2005). https://doi.org/10.1016/j.acra.2005.04.016 1076-6332 Google Scholar
S. P. Poplack, T. D. Tosteson, W. A. Wells, B. W. Pogue, P. M. Meaney, A. Hartov, C. A. Kogel, S. K. Soho, J. J. Gibson, and K. D. Paulsen,
“Electromagnetic breast imaging: results of a pilot study in women with abnormal mammograms,”
Radiology, 243 350
–359
(2007). https://doi.org/10.1148/radiol.2432060286 0033-8419 Google Scholar
R. Choe, A. Corlu, K. Lee, T. Durduran, S. D. Konecky, M. Grosicka-Koptyra, S. R. Arridge, B. J. Czerniecki, D. L. Fraker, A. Demichele, B. Chance, M. A. Rosen, and A. G. Yodh,
“Diffuse optical tomography of breast cancer during neoadjuvant chemotherapy: a case study with comparison to MRI,”
Med. Phys., 32 1128
–1139
(2005). https://doi.org/10.1118/1.1869612 0094-2405 Google Scholar
E. Heffer, V. Pera, O. Schütz, H. Siebold, and S. Fantini,
“Near-infrared imaging of the human breast: complementing hemoglobin concentration maps with oxygenation images,”
J. Biomed. Opt., 9 1152
–1160
(2004). https://doi.org/10.1117/1.1805552 1083-3668 Google Scholar
X. Gu, Q. Zhang, M. Bartlett, L. Schutz, L. L. Fajardo, and H. Jiang,
“Differentiation of cysts from solid tumors in the breast with diffuse optical tomography,”
Acad. Radiol., 11 53
–60
(2004). https://doi.org/10.1016/S1076-6332(03)00562-2 1076-6332 Google Scholar
L. Spinelli, A. Torricelli, A. Pifferi, P. Taroni, G. Danesini, and R. Cubeddu,
“Characterization of female breast lesions from multi-wavelength time-resolved optical mammography,”
Phys. Med. Biol., 50 2489
–2502
(2005). https://doi.org/10.1088/0031-9155/50/11/004 0031-9155 Google Scholar
C. H. Schmitz, D. P. Klemer, R. Hardin, M. S. Katz, Y. Pei, H. L. Graber, M. B. Levin, R. D. Levina, N. A. Franco, W. B. Solomon, and R. L. Barbour,
“Design and implementation of dynamic near-infrared optical tomographic imaging instrumentation for simultaneous dual-breast measurements,”
Appl. Opt., 44 2140
–2153
(2005). https://doi.org/10.1364/AO.44.002140 0003-6935 Google Scholar
B. Brooksby, B. W. Pogue, S. Jiang, H. Dehghani, S. Srinivasan, C. Kogel, T. D. Tosteson, J. Weaver, S. P. Poplack, and K. D. Paulsen,
“Imaging breast adipose and fibroglandular tissue molecular signatures by using hybrid MRI-guided near-infrared spectral tomography,”
Proc. Natl. Acad. Sci. U.S.A., 103 8828
–8833
(2006). https://doi.org/10.1073/pnas.0509636103 0027-8424 Google Scholar
N. Shah, J. Gibbs, D. Wolverton, A. Cerussi, N. Hylton, and B. J. Tromberg,
“Combined diffuse optical spectroscopy and contrast-enhanced magnetic resonance imaging for monitoring breast cancer neoadjuvant chemotherapy: a case study,”
J. Biomed. Opt., 10 051503
(2005). https://doi.org/10.1117/1.2070147 1083-3668 Google Scholar
Q. Zhang, T. J. Brukilacchio, A. Li, J. J. Stott, T. Chaves, E. Hillman, T. Wu, M. A. Chorlton, E. Rafferty, R. H. Moore, D. B. Kopans, and D. A. Boas,
“Coregistered tomographic x-ray and optical breast imaging: initial results,”
J. Biomed. Opt., 10 1
–9
(2005). 1083-3668 Google Scholar
V. Ntziachristos, A. G. Yodh, M. D. Schnall, and B. Chance,
“MRI-guided diffuse optical spectroscopy of malignant and benign breast lesions,”
Neoplasia, 4 347
–354
(2002). https://doi.org/10.1038/sj.neo.7900244 1522-8002 Google Scholar
Q. Zhu, N. G. Chen, and S. H. Kurtzman,
“Imaging tumor angiogenesis by use of combined near-infrared diffusive light and ultrasound,”
Opt. Lett., 28 337
–339
(2003). https://doi.org/10.1364/OL.28.000337 0146-9592 Google Scholar
Q. Zhu, M. Huang, N. Chen, K. Zarfost, B. Jagjivant, M. Kane, P. Hedget, and S. H. Kurtzmant,
“Ultrasound-guided optical tomographic imaging of malignant and benign breast lesions: initial clinical results of 19 cases,”
Neoplasia, 5 379
–388
(2003). 1522-8002 Google Scholar
Q. Zhu, E. B. Cronin, A. A. Currier, H. S. Vine, M. Huang, N. Chen, and C. Xu,
“Benign versus malignant breast masses: optical differentiation with US-guided optical imaging reconstruction,”
Radiology, 237 57
–66
(2005). https://doi.org/10.1148/radiol.2371041236 0033-8419 Google Scholar
Q. Zhu, S. H. Kurtzman, P. Hegde, S. Tannenbaum, M. Kane, M. Huang, N. G. Chen, B. Jagjivan, and K. Zarfos,
“Utilizing optical tomography with ultrasound localization to image heterogeneous hemoglobin distribution in large breast cancers,”
Neoplasia, 7 263
–270
(2005). https://doi.org/10.1593/neo.04526 1522-8002 Google Scholar
A. Cerussi, D. Hsiang, N. Shah, R. Mehta, A. Durkin, J. Butler, and B. J. Tromberg,
“Predicting response to breast cancer neoadjuvant chemotherapy using diffuse optical spectroscopy,”
Proc. Natl. Acad. Sci. U.S.A., 104 4014
–4019
(2007). https://doi.org/10.1073/pnas.0611058104 0027-8424 Google Scholar
Y. Ardeshirpour, M. Huang, and Q. Zhu,
“Effect of tilted chest-wall on breast lesion reconstruction,”
16
–19
(2008). Google Scholar
M. Huang,
“3-D Optical imaging for breast cancer detection and diagnosis,”
(2005). Google Scholar
M. Das, C. Xu, and Q. Zhu,
“Analytical solution for light propagation in a two-layer tissue structure with a tilted interface for breast imaging,”
Appl. Opt., 45 5027
–5036
(2006). https://doi.org/10.1364/AO.45.005027 0003-6935 Google Scholar
C. Xu, M. Das, Y. Ardeshirpour, and Q. Zhu,
“An image reconstruction method for a two-layer tissue structure accounts for chest-wall effects in breast imaging,”
J. Biomed. Opt., 13 064029
(2008). https://doi.org/10.1117/1.3041497 1083-3668 Google Scholar
Q. Zhu, C. Xu, P. Guo, A. Aquirre, B. Yuan, F. Huang, D. Castilo, J. Gamelin, S. Tannenbaum, M. Kane, P. Hedge, and S. Kurtzman,
“Optimal probing of optical contrast of breast lesions of different size located at different depths by US localization,”
Technol. Cancer Res. Treat., 5 365
–380
(2006). 1533-0346 Google Scholar
N. G. Chen, P. Y. Guo, S. K. Yan, D. Q. Piao, and Q. Zhu,
“Simultaneous near-infrared diffusive light and ultrasound imaging,”
Appl. Opt., 40 6367
–6380
(2001). https://doi.org/10.1364/AO.40.006367 0003-6935 Google Scholar
A. Kienle, M. S. Patterson, N. Dögnitz, R. Bays, G. Wagnières, H. Van Den Bergh,
“Noninvasive determination of the optical properties of two-layered turbid media,”
Appl. Opt., 37 779
–791
(1998). https://doi.org/10.1364/AO.37.000779 0003-6935 Google Scholar
J. Ripoll, V. Ntziachristos, J. P. Culver, D. N. Pattanayak, A. G. Yodh, M. Nieto-Vesperinas,
“Recovery of optical parameters in multiple-layered diffusive media: theory and experiments,”
J. Opt. Soc. Am. A Opt. Image Sci. Vis, 18 821
–830
(2001). https://doi.org/10.1364/JOSAA.18.000821 1084-7529 Google Scholar
W. Cheong, S. A. Prahl, and A. J. Welch,
“A review of the optical property of biological tissues,”
IEEE J. Quantum Electron., 26 2166
–2185
(1990). https://doi.org/10.1109/3.64354 0018-9197 Google Scholar
S. J. Matcher, M. Cope, and D. T. Delpy,
“In vivo measurements of the wavelength dependence of tissue-scattering coefficients between 760 and measured with time-resolved spectroscopy,”
Appl. Opt., 36
(1), 386
–396
(1997). https://doi.org/10.1364/AO.36.000386 0003-6935 Google Scholar
Y. Yang, O. Soyemi, M. Landry, and B. Soller,
“Influence of a fat layer on the near infrared spectra of human muscle: quantitative analysis based on two-layered Monte Carlo simulations and phantom experiments,”
Opt. Express, 13
(5), 1570
–1579
(2005). https://doi.org/10.1364/OPEX.13.001570 1094-4087 Google Scholar
P. Taroni, D. Comelli, A. Farina, A. Pifferi, and A. Kienle,
“Time-resolved diffuse optical spectroscopy of small tissue samples,”
Opt. Express, 15
(6), 3301
–3311
(2007). https://doi.org/10.1364/OE.15.003301 1094-4087 Google Scholar
Y. Xu, N. Iftimia, H. Jiang, L. L. Key, and M. B. Bolster,
“Imaging of in vitro and in vivo bones and joints with continuous-wave diffuse optical tomography,”
Opt. Express, 8
(7), 447
–451
(2001). 1094-4087 Google Scholar
N. Shah, A. Cerussi, C. Eker, J. Espinoza, J. Butler, J. Fishkin, R. Hornung, and B. Tromberg,
“Noninvasive functional optical spectroscopy of human breast tissue,”
Proc. Natl. Acad. Sci. U.S.A., 98 4420
–4425
(2001). https://doi.org/10.1073/pnas.071511098 0027-8424 Google Scholar
|


