|
|
1.IntroductionMelanocyte cells reside in the lower layers of the skin’s epidermis. These cells produce melanosomes, which contain light-absorbing melanin pigments. Melanoma is a tumor of melanocytes, usually caused by long-term exposure to UV radiation.1, 2, 3 Currently, the best method of treatment is surgery, where malignant cells are physically removed.4 The surgical treatment option relies on early detection of malignant cells such that minimal tissue is removed and the chance of metastasis is reduced.5 One method of detection is by observation of the cell nucleus. Stolz 6 observed changes in the mean cross-sectional area of the nucleus between malignant melanomas and benign compound nevi (pigmented moles). Authors found the area in malignant melanomas varied from in benign compound nevi. This suggests nuclei increase in size in the neoplastic cells. This is supported by the work of Backman,7 who also observed the enlargement, crowding, and increased chromatin content of nuclei in the epithelial cells. Processes such as mitosis or meiosis (cell division) cause an increase in density of chromatin strands. Changes in chromatin content directly affect the refractive index of the cell nucleus. Therefore, the cellular status can be monitored by the refractive index of the cell and used as a diagnostic indicator. Typical average values of the cell nuclei range8 between 1.38 and 1.47. In this paper, the size and refractive index of melanocytes were measured using digital Fourier microscopy, which can be applied to melanoma study in future. Digital Fourier microscopy (DFM) is a recently introduced imaging technique based on the recording of a hologram in the image transfer plane (also referred to as the Fourier plane) using digital recording media. It is suitable for imaging biological tissue, which consists of scatterers of various size and shapes.9 The technique relies on the recording of a Fourier hologram of the specimen, from which the image is reconstructed. Imaging in such a manner maximizes the system sensitivity to the small features of the specimen and provides flexibility in Fourier filtering, where algorithms can be designed to further enhance the contrast of specific scatterers of interest. Additionally, the principle of dark-field imaging can be applied to DFM where transmitted light is blocked. The choice of digital filtering algorithms in the Fourier domain allows minimization of imaging artifacts, typical in dark-field microscopy.10 An example of such quantitative information on the same object include the determination of the object’s shape and refractive index. Biomedical applications of DFM include the detection of morphological variations that are observed in cells as a result of cancer development. Cancerous cells are characterized by their enlarged cell nuclei, which are accompanied by changes in the refractive index.7 DFM can therefore be used to detect cancerous cells and distinguish them from normal, healthy cells. This technique does not require staining of biopsy samples as other methods do. The DFM technique could also be used for studying the onset and early stages of cell calcification in cell cultures as in coronary artery disease.11 The progression of calcification can therefore be monitored by refractive index measurements of the cell culture constituents. The use of DFM for the determination of the refractive index and diameter of polymer beads may also assist the refinement of the existing DNA sequencing methods.12, 13 Currently, this is limited by the use of colloid dye-doped beads.14, 15 Optical scatter field recorded by DFM contains information about the object’s size, shape, relative location, and refractive index. This information can be retrieved by fitting the measured optical scatter field (the distribution of light scattered by the object) to theoretical models. For spherical scatterers, the theoretical model is based on Mie scattering theory, where the intensity and angle of scattered light can be calculated using Eq. 1. The functions and relate to the multipole expansion of light,16 and the real components of Mie coefficients and [Eqs. 2, 3] are complex functions of the dimensionless scatterer size parameter and relative refractive index . Within the Mie coefficients are Ricatti-Bessel functions and 17 andReferring to Fig. 1, the intensity distribution of the Fourier hologram, , can be represented as where is the two-dimensional (2-D) spatial Fourier transform of the object function , with origin at .18 is the focal length of the lens, and is the wavelength of incident light.Fig. 1Schematic diagram of the DFM configuration. Light from a laser (not shown) is split into an object and a reference arm. The reference field is generated by an optical fiber, whose illuminating end is located at the object plane. The object arm, which begins at the sample, is scattered and projected as a magnified image by the objective lens, . Lenses to optimize the size of the image, projected at the primary object plane. A beamsplitter, located between lenses and , divides the sample wave such that a bright-field image can be recorded with . The Fourier lens, , of focal length , forms an optical Fourier transform of the object. The Fourier transform interferes with the reference wave at the transfer plane and is recorded by . 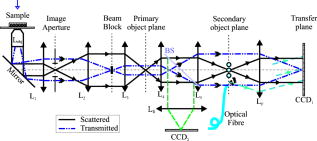 The Fourier hologram of a scattering object, represented in Eq. 4 is characterized by low- and high-spatial frequency bands. These are labeled as the form- and structure-factors, respectively. The form-factor is, conveniently, also the Fourier transform of the function located at the image plane. For an ensemble of scatterers, is the sum of all individual 2-D Fourier transforms, each of which is centered about the origin of the transfer plane. To demonstrate, consider a slit situated at the image plane, whose transmission function is represented as The resultant optical intensity pattern is proportional to where the spatial frequency . The form-factor for a rectangular scatter is, therefore, a sinc function. This function depends on and —i.e., the imaging system parameters and object size, respectively. From Eq. 4 for the one-dimensional (1-D) case, the recorded intensity of the Fourier hologram for a rectangular scatter is given byThis is the form-factor modulated by the cosine factor . Note that in the case of a scattering object, an additional factor of refractive index will appear in the form-factor expression, as can be seen via the relative size parameter in Eqs. 1, 2, 3. This function represents the structure-factor and corresponds to the location of an individual object or scatter. The removal of high frequencies—i.e., the structure-factor—isolates the Fourier transform and simplifies the conditions for inverse scattering problems, where the scatterer characteristics can be determined. Since filtering is applied to the Fourier hologram, this process is termed Fourier filtering. Boustany 19 have demonstrated Fourier filtering by placement of an optical filter in the imaging setup. A variable diaphragm in the back focal plane of the Fourier lens selectively transmits light of particular scattering angles. In DFM, however, Fourier filtering is performed at the postprocessing stage by application of digital filters. The size parameter is used as the fitting parameter for modeling with optical scatter obtained by DFM. Note that the related quantity, , which we will call the “relative size parameter,” is dependent on the relative refractive index and wavelength. and are the refractive indices of the scatterer and surrounding media. To determine the relative refractive index of the scatterer, the diameter of the scatterer must be known, since the relative size parameter includes refractive index. Using Mie theory, the relationship between scattering angle, scatterer size, and refractive index is illustrated in Fig. 2 . Direct measurements using conventional microscopy or image reconstruction of the recorded digital Fourier hologram can be used to measure the scatterer size. In some instances, the relative size parameter alone can contain useful information, relaxing the need for accurate measurement of size and refractive index of the scatterer separately. For example, the relative size parameter of the cell nuclei can serve as a useful reporter of the cell abnormality related to cancer. It is well known that, on average, the malignant cells are characterized by enlarged nuclei and increased refractive index, hence the mean cell nucleus size parameter is increased due to the two factors in cancerous cells with respect to normal cells. In fact, this parameter may be more sensitive than the separate size and refractive index parameters alone. In this paper, we demonstrate that the relative size parameter in of the cell nuclei can be determined reasonably accurately in a relatively simple digital Fourier microscopy system. The complete schematic diagram of the DFM experimental system is presented in Fig. 1. Note that the basic DFM system is a part of the complete system (secondary object plane- -transfer plane, see Fig. 1). 2.Experimental Method2.1.Optical Scatter SpectrumAs was introduced earlier, is a parameter of the form-factor, which can be retrieved from the optical scatter distribution. In this paper, we define optical scatter as the scattering amplitude dependency versus scattering angle, . The digital Fourier microscopy technique is used to acquire the optical scatter. The simplified basic optical configuration of DFM is illustrated in Fig. 3 . A beamsplitter, BS, divides a highly coherent (spatially and temporary) illumination wave into a sample and reference wave. The reference wave is guided by an optical fiber, OF, whose illuminating end is located at the object plane. The sample wave is optically transformed by a Fourier lens, , which has a focal length . This results in the recording of the optical Fourier transform of the image located in the object plane. Fig. 3The basic configuration of DFM using the configuration. A Fourier lens, , forms an optical Fourier transform of the optical field perturbation by the object at the transfer plane, where it interferes with the reference field and is recorded by a CCD. The reference field is generated by an optical fiber, OF, whose illuminating end is located off the optical axis at the object plane. A beamsplitter, BS, divides the illumination wave into the sample and reference waves. The focal length of the Fourier lens is .  To obtain an optical scatter spectrum from one scatterer, a four-step process was used, and is explained in Fig. 4 . The first step requires the Fourier transform of the recorded hologram, which produces an array of complex amplitudes. This step is the reconstruction of the object image. For a sample of monodisperse spheres in a homogeneous medium, the array is similar to Fig. 4a. Note that the Fourier transform is symmetric and alternate quadrants are identical; hence, only the first quadrant of the array is shown. The second step is the isolation of an individual scatterer, which uses an apodization function such that diffraction edge effects are avoided.10 A Gaussian function is therefore used as a cropping apodization function. The resultant array has one quadrant similar to Fig. 4b, where only one scatterer is displayed and surrounding pixels are assigned a zero value. Third, an inverse Fourier transform is applied to the resultant array, producing Fig. 4c, which is the optical scatter spectrum of the isolated scatterer. To extract the form-factor envelope, represented by the low spatial frequency band of the optical scatter spectrum, a square-law detector followed by a low-pass filter was applied, and the resultant signal is presented in Fig. 4d. For spherical scatterers, spectra are circular symmetric. The profile of this spectra can therefore be used as a measurable feature, which is directly related to the relative size parameter. The full width at half maximum (FWHM) was chosen as this parameter, where the “half maximum” is defined as the median of the greatest intensity, where the lowest intensity is the standard deviation of the background signal. Fig. 4The theoretically modeled four-step process to obtain an optical spectra of an individual scatterer. (a) Object image obtained by Fourier transformation of the recorded DFM hologram; (b) an isolated scatterer image; (c) the result of the inverse Fourier transform of an isolated scatterer, and (d) the optical spectra envelope obtained by square-law detection low-pass filtering.  2.2.Digital Fourier MicroscopyThe DFM setup is illustrated in Fig. 1. An optical output from a helium-neon laser ( , ) was equally split into object and reference arms. In the object arm, a sample was placed in the path of the collimated laser beam, where light was either scattered or transmitted through the sample. An assembly of an infinity-corrected objective lens (Olympus, , ), and a relay lens (achromat-doublet, focal length ), produced a magnified image of the object at the secondary object plane. An aperture was placed in the first image plane (between and ) to limit the field of view of the overall imaging system, and in order to avoid aliasing in the reconstructed image. The magnified image was projected onto the transfer plane by a Fourier lens (achromat-doublet, focal length ), where a CCD camera (Photometrics, CoolSNAP , , ) was situated. In the reference arm, the laser light was coupled into a single-mode optical fiber (mode-field diameter at , ). The illuminating end of the fiber was placed off-axis at the object plane. The interference between the optical field due to the magnified image of the object and the quasi-plane reference field combined at the transfer plane was recorded by the CCD camera. 2.3.Verification of the DFM TechniqueThe refractive index of polystyrene and organosilica microspheres were determined to demonstrate the measurement accuracy of DFM. polystyrene microspheres (ProSciTech, product number QPP-02-10), (Dako SpectrAlign, product number K0111), and organosilica microspheres were used for measurements. Two methods of refractometry, as described by Seet 13 were employed for the calibration of microspheres. First, a refined optical scattering spectroscopy method was applied, where a commercial laboratory Lamda40 spectrophotometer (PerkinElmer) was used to measure the refractive index of the biological phantoms. Second, the refractive index of single microparticles were measured using optical tweezer refractometry.20 The two methods were compared, and very good agreement was achieved.13 Several optical scatter spectra were measured for each type of microsphere. The FWHM and refractive index distribution of and polystyrene and organosilica microspheres are shown in Fig. 5, Fig. 6, and Fig. 7 . For polystyrene microspheres, the mean relative refractive index was found to be . Using a value of 1.531 for the refractive index of polyvinyl-alcohol (PVA) at 20% concentration, the refractive index of polystyrene was found to be . The FWHM distributions for polystyrene and organosilica were also measured and were found to be and , respectively. Measured values, shown in Table 1, agreed within experimental uncertainty with these determined using the scattering spectroscopy method. This demonstrated the refractometry potential of DFM as applied to the biological phantoms, with controlled scattering parameters. Fig. 5Refractive index distribution of (a) FWHM and (b) relative refractive index measurements for polystyrene microspheres.  Fig. 6Refractive index distribution of (a) FWHM and (b) relative refractive index measurements for microspheres. 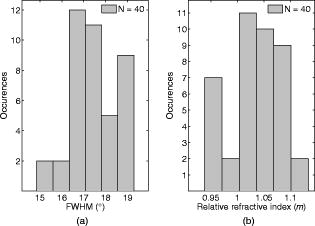 Fig. 7Refractive index distribution of (a) FWHM and (b) relative refractive index measurements for organosilica microspheres.  Table 1Relative and absolute refractive indices determined by DFM ( mDFM and nDFM , respectively) and scattering spectroscopy (nSS) .
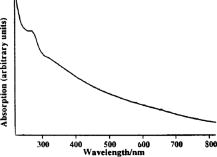
2.4.Imaging Cells Using DFMWe applied DFM to optical characterizations of the melanocyte cell culture. Melanocytes were cultured onto glass coverslips placed on the bottom of culturing flasks. This allowed cells to grow onto a thin layer of glass, which was later immersed in a phosphate buffered saline (PBS) solution. Melanocyte cells were imaged using the DFM configuration illustrated in Fig. 1. Although the sample image can be obtained by discrete Fourier transform of the recorded hologram, it was difficult to achieve a trade-off between the optical scatter recording and optimal magnification of the sample image—the collection of wide-angle scatter corresponds to a highly magnified image. Therefore, to maximize the accuracy of the size measurements, a direct image of the sample was obtained using an auxiliary imaging device , illustrated in Fig. 1. One of the several images recorded by is shown in Fig. 8, where characteristic dendrites can be observed, and at the center of these are cell nuclei (labeled A). From individual measurements, it was found that the mean diameter of nuclei was . This agrees with the previously published values of for mammalian cell nuclei.21 The error in the mean size determination is predominantly due to the imaging specifications of and diffraction limit of the employed imaging system. This error can be reduced by using a high-resolution CCD or field of view with greater magnification. Fig. 8Image of the melanocyte cells (arrows show cell dendrites) obtained by (a) auxiliary imaging device using the configuration shown in Fig. 1. The image aperture appears as a circular outline. (b) The recorded Fourier hologram of cells.  The optical scatter spectra of 21 cell nuclei were determined by extraction of the form-factor, as described earlier. A histogram of the measured FWHM values are shown in Fig. 9 . The mean FWHM of all cells were found to be . Using Eq. 1, a lookup table of scattering angles for various spheroid sizes and relative refractive indices was determined (illustrated in Fig. 2). The relative refractive index of melanocyte nuclei was determined to be . This yields an average absolute refractive index of , assuming that the surrounding cell medium is water, , and is 1.33. 3.DiscussionThe ideal optical scatter profile of a spherical scatterer is characterized by a central maximum and concentric rings.10 However, the intensities of the rings appeared diminished due to the background noise. As an illustration of the relative signal intensity of the first scatter ring, Fig. 10 shows the optical scatter 2-D map and horizontal, vertical, and two diagonal profiles. One unavoidable source of noise is the nonuniformity of PVA in which microspheres are embedded. Additionally, reflections and scattering from the optical components also contributes to these fluctuations. The current DFM system sensitivity precludes acquisition of the high-angle optical scattering rings of sphere, which are undetectable. A useful inseparable feature of the optical scatter distribution appeared to be the at full width of the central peak at the half the maximum intensity [FWHM, illustrated by the arrow in Fig. 10c]. Typically, the intensity of sidelobes was less than 10% of that of the central maximum. For the background fluctuations less than 10% of the maximum signal value, the FWHM angle was not significantly affected by the background fluctuations and was therefore suitable for determination of the scatterer. Fig. 10(a) A reconstructed image of a polystyrene microsphere, (b) its optical scatter spectra, and (c) the optical scatter spectra profile, with the FWHM angle indicated by the arrow.  To determine the refractive index of an individual microsphere, the exact size must be known. It is possible to determine the size by image reconstruction of the recorded hologram. However, this is limited to the resolution of the secondary imaging system. For example, a direct bright-field image can be recorded by , which is illustrated in the schematic diagram of the DFM setup in Fig. 1. The resolution is limited to due to the number of pixels and size. Although this can be overcome by modification of the focal length of , which determines the system’s magnification, this would reduce the field of view, which was undesirable for our experiments. Alternatively, for monodisperse size distributions, an average size and refractive index value can be used. Multiple measurements of the FWHM were therefore performed and a refractive index histogram was produced. In order to ascertain that the recorded optical scatter was dominated by the contributions from the cell nuclei, we considered the presence of the other cell structures and their scattering and absorption efficiency. Melanin plays a photoprotective role by absorbing a broad spectrum of radiation, predominately UV. The absorption spectrum of eumelanin, illustrated in Fig. 11, shows that the absorption rapidly decreases with wavelength.22 In the analysis of FWHM angles, absorption by melanin is dominant in the short wavelength range and is, therefore, not accounted for since the laser produces light in the longer wavelength region of . As for the effect of absorption, a small amount of absorption merely reduces the amount of scattering, and larger amounts of absorption will reduce the amount of light, which, while reducing amplitude of the scattering profiles from the nuclei, will not change their shapes. Scattering by melanin was therefore assumed to be much greater than its absorption at . Scattering from the cell organelles and melanosomes was also considered. The cell organelles were typically less than in size. For example, mitochondria are approximately in diameter, and lysosomes and peroxisomes are roughly spherical in shape and approximately in diameter.23, 24 Cell organelles have been reported8 to have refractive indices less than the cell nuclei: cell nuclei 1.38 to 1.47, extracellular fluid 1.35 to 1.36, cytoplasm 1.36 to 1.37, and mitochondria 1.38 to 1.41. Since cell organelles are smaller than cell nuclei, scattering from these would be characterized by the larger average cosine than that from cell nuclei. Melanin within melanosomes also scatters. Eumelanin pigments are typically ,25 while melanosomes range from in area [average size of , assuming that diameter is related to area by .] Note that the sizes of melanosomes vary with ethnicity, where melanosomes in dark skin are the largest, and have been measured to be . Asian skin and Caucasian skin have also been measured to be and , respectively.26 For such small sizes, light is scattered at angles larger than the FWHM of cell nuclei. Therefore, cell organelles do not affect the FWHM distribution of cell nuclei. The refractive index of organelles and melanosomes was also considered. The refractive index of melanosomes has been found to be 1.55 to 1.65 and 1.59 at .27 To demonstrate effects on FWHM, the size parameter was calculated for cell nuclei, cell organelles, and melanosomes (see Table 2 ). From the average published values, the size parameter for cell nuclei was found to be 35.7. This value is much larger than the size parameters of cell organelles and melanosomes , indicating that scattering by cell nuclei is by far the greatest and at smaller angles than the cell organelles. Since the size parameter directly relates to the FWHM of the optical scatter distribution, we conclude that the optical spectra recorded by DFM were due to the melanocyte cell nuclei scattering. This is supported by the work of Mourant,21 where the cell organelles have been shown to have minimal effect on the small-angle scattering. Table 2Average refractive index (nave) , size (d) , and relative size parameter (mχ) of cell components.
For the application of DFM as a diagnostic indicator of cellular disease, the relative size parameter alone can be used, since it is directly proportional to size and the relative refractive index of the cell nuclei. It would be highly desirable to perform cross-comparison of the normal and malignant melanocyte relative size parameters using the DFM technique. However, melanoma cells were not available for measurements during the study. A detectable increase of the relative size parameter of malignant cell nuclei is expected to increase in size and relative refractive index. The size parameter for melanocyte cell nuclei was determined to be 16.5 using DFM and is expected to increase for melanoma cell nuclei. 4.ConclusionDFM is a simple and versatile technique that records a Fourier hologram of scattering particles. Optical scatter of individual scatterers can be extracted and processed, yielding useful scattering characteristics using DFM. Although a product of the scatterer size and refractive index, the relative size parameter, can be readily determined, their decoupling requires additional measurements and can result in the overall accuracy loss. Fortunately, in some optical measurement scenarios, the decoupling is not necessary. For example, the relative size parameter can be used as a useful reporter of the cell condition (normal versus malignant), e.g., malignant cell nuclei increase in both size and refractive index. Such changes are expected to cause an increase of the relative size parameter of an average cell nucleus. In this paper, we have successfully demonstrated the application of DFM to retrieve the relative size parameter of the melanocyte cell nuclei, which yielded reasonable and interpretable results. ReferencesM. Lavin, G. Wellett, A. Chalmers, and C. Kidson,
“DNA-replication and repair in a human melanoma cell-line resistant to UV-radiation,”
Int. J. Radiat. Biol., 31 101
–111
(1977). https://doi.org/10.1080/09553007714550121 0955-3022 Google Scholar
S. Saunders,
“Melanoma risks,”
New Sci., 195 22
(2007). https://doi.org/10.1016/S0262-4079(07)61819-3 0262-4079 Google Scholar
D. Lookingbill, G. Lookingbill, and B. Leppard,
“Actinic damage and skin-cancer in albinos in northern Tanzania—Findings in 164 patients enrolled in an outreach skin care program,”
J. Am. Acad. Dermatol., 32 653
–658
(1995). https://doi.org/10.1016/0190-9622(95)90352-6 0190-9622 Google Scholar
A. Ball and J. Thomas,
“Surgical-management of malignant-melanoma,”
Br. Med. Bull., 51 584
–608
(1995). 0007-1420 Google Scholar
R. Mackie,
“Melanoma prevention and early detection,”
Br. Med. Bull., 51 570
–583
(1995). 0007-1420 Google Scholar
W. Stolz, C. Schmoeckel, F. Ryckmanns, J. Groß, and O. Braun-Falco,
“Morphometric and ultrastructural analyses of melanocytes, nevus cells, and melanoma-cells,”
Arch. Dermatol. Res., 279 167
–172
(1987). https://doi.org/10.1007/BF00413252 0340-3696 Google Scholar
V. Backman,
“Detection of preinvasive cancer cells,”
Nature (London), 406 35
–36
(2000). https://doi.org/10.1038/35017638 0028-0836 Google Scholar
P. Gourley,
“Biocavity laser for high-speed cell and tumour biology,”
J. Phys. D, 36 R228
–R239
(2003). https://doi.org/10.1088/0022-3727/36/14/202 0022-3727 Google Scholar
S. Alexandrov, P. Meredith, T. McIntyre, and A. Zvyagin,
“Holographic digital Fourier microscopy for selective imaging of biological tissue,”
Int. J. Imaging Syst. Technol., 14 253
–258
(2005). https://doi.org/10.1002/ima.20031 0899-9457 Google Scholar
K. Y. T. Seet, P. Meredith, P. Blazkiewicz, and A. V. Zvyagin,
“Optical scatter imaging using digital Fourier microscopy,”
J. Phys. D, 38 3590
–3598
(2005). https://doi.org/10.1088/0022-3727/38/19/008 0022-3727 Google Scholar
G. Campbell and J. Campbell,
“Vascular smooth muscle and arterial calcification,”
Z. Kardiol., 89 II/54
–II/62
(2000). https://doi.org/10.1007/s003920070100 0300-5860 Google Scholar
K. Helmut, Science Creative Quarterly,
(2003) http://www.scq.ubc.ca/genome-projects-uncovering-the-blueprints-of-biology Google Scholar
K. Y. T. Seet, R. Vogel, T. A. Nieminen, G. Knöner, H. Rubinsztein-Dunlop, M. Trau, and A. Zvyagin,
“Refractometry of organosilica microspheres,”
Appl. Opt., 46 1554
–1561
(2007). https://doi.org/10.1364/AO.46.001554 0003-6935 Google Scholar
B. J. Battersby, G. A. Lawrie, A. P. Johnston, and M. Trau,
“Optical barcoding of colloidal suspensions: applications in genomics, proteomics and drug discovery,”
Chem. Commun. (Cambridge), 14 1435
–1441
(2002). https://doi.org/10.1039/b200038p 1359-7345 Google Scholar
N. Finkel, X. Lou, C. Wang, and L. He,
“Barcoding the microworld,”
Anal. Chem., 76 352A
–359A
(2004). https://doi.org/10.1021/ac0416463 0003-2700 Google Scholar
J. Hansen and L. Travis,
“Light-scattering in planetary atmospheres,”
Space Sci. Rev., 19 527
–610
(1974). https://doi.org/10.1007/BF00168069 0038-6308 Google Scholar
H. van de Hulst, Light Scattering by Small Particles, Wiley, New York
(1957). Google Scholar
Handbook of Optical Holography, Academic Press, New York
(1979). Google Scholar
N. Boustany, S. Kuo, and N. Thakor,
“Optical scatter imaging: subcellular morphometry in situ with Fourier filtering,”
Opt. Lett., 26 1063
–1065
(2001). https://doi.org/10.1364/OL.26.001063 0146-9592 Google Scholar
G. Knöner, S. Parkin, T. Nieminen, N. Heckenberg, and H. Rubinsztein-Dunlop,
“Measurement of the index of refraction of single microparticles,”
Phys. Rev. Lett., 97 157402
(2006). https://doi.org/10.1103/PhysRevLett.97.157402 0031-9007 Google Scholar
J. Mourant, J. Freyer, A. Hielscher, A. Eick, D. Shen, and T. Johnson,
“Mechanisms of light scattering from biological cells relevant to noninvasive optical-tissue diagnostics,”
Appl. Opt., 37 3586
–3593
(1998). https://doi.org/10.1364/AO.37.003586 0003-6935 Google Scholar
J. Nofsinger, S. Forest, and J. Simon,
“Explanation for the disparity among absorption and action spectra of eumelanin,”
J. Phys. Chem. B, 103 11428
–11432
(1999). https://doi.org/10.1021/jp992640y 1089-5647 Google Scholar
G. E. Palade,
“An electron microscope study of the mitochondrial structure,”
J. Histochem. Cytochem., 1 188
–211
(1953). 0022-1554 Google Scholar
A. Alberts, D. Bray, J. Lewis, M. Raff, K. Roberts, and J. Watson, Molecular Biology of the Cell, Gerland, New York
(1994). Google Scholar
J. Riesz, J. Gilmore, and P. Meredith,
“Quantitative scattering of melanin solutions,”
Biophys. J., 90 4137
–4144
(2006). https://doi.org/10.1529/biophysj.105.075713 0006-3495 Google Scholar
H. Thong, S. Jee, C. Sun, and R. Boissy,
“The patterns of malanosome distribution in keratinocytes of human skin as one determining factor of skin colour,”
Br. J. Dermatol., 149 498
–505
(2003). https://doi.org/10.1046/j.1365-2133.2003.05473.x 0007-0963 Google Scholar
A. Vitkin, J. Woolsey, B. C. Wilson, and R. R. Anderson,
“Optical and thermal characterization of natural (Sepia-officinalis) melanin,”
Photochem. Photobiol., 59 455
–462
(1994). https://doi.org/10.1111/j.1751-1097.1994.tb05064.x 0031-8655 Google Scholar
|