|
|
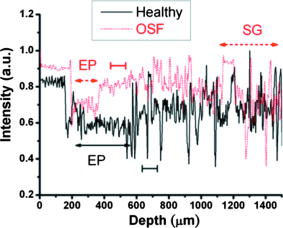
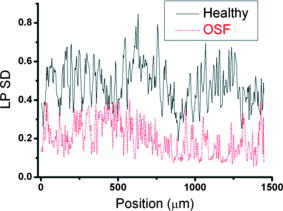
1.IntroductionOral submucous fibrosis (OSF) is a chronic progressive scarring oral disease predominantly affecting people of South Asian origin. It is characterized by juxtaepithelial inflammatory cell infiltration followed by fibrosis in the lamina propria (LP) and submucosa layers of the oral mucosa. Several factors have been proven to be involved in the etiology of OSF. Epidemiologic studies have shown the intimate relationship between the habit of chewing areca quid (AQ) and OSF.1, 2, 3 Recent studies have also demonstrated that all OSF patients have the AQ chewing habit.4, 5 In Taiwan, there are two million people who have the AQ chewing habit.6 An OSF incidence of 0.1 to 3.4% among AQ chewers has been reported.7, 8, 9, 10, 11 Although the pathogenesis of OSF has been so far unclear, previous studies have suggested that the occurrence of OSF may be attributed to increased collagen synthesis and decreased collagen degradation. The increased collagen production may be due to clonal selection of fibroblasts with a high amount of collagen production during the long-term exposure to AQ ingredients,12, 13 stimulation of fibroblast proliferation and collagen synthesis by areca nut alkaloids,14 or fibrogenic cytokines secreted by activated macrophages and T lymphocytes in the OSF tissue.15 The decreased collagen degradation may be due to the decreased secretion of collagenase 16 and the deficiency in collagen phagocytosis by OSF fibroblasts,17 areca nut alkaloids–stimulated production of tissue inhibitors of metalloproteinases that in turn lower collagenase activity,18, 19 production of collagen with more stable structure (collagen type I trimer) by OSF fibroblasts,13 stabilization of collagen structure by (+)-catechin and tannins from areca nut, 20, 21 and an increase in collagen cross-linkages caused by upregulation of lysyl oxidase by OSF fibroblasts.22, 23 Clinical diagnosis of OSF is usually made based on several characteristic features of OSF, including intolerance to spicy foods, blanching and stiffness of the oral mucosa, fibrous bands in the buccal or labial mucosa, and progressive inability to open the mouth. Some OSF patients may also have the following symptoms: burning sensation in the mouth, xerostomia, presence of vesicles or ulcers on the oral mucosa, depapillation of the tongue, and impaired tongue mobility. Various surgical and nonsurgical modalities have been proposed for the management of OSF. The former includes excision of fibrous bands, placental grafts,24 skin grafts, splitting of the temporalis tendon and coronoid process,25 and lingual pedicle flaps.26 The latter includes local injections of steroids, hyaluronidase, human placenta extracts, and chymotrypsin; multivitamin therapy; and physiotherapy.27 Surgical treatments are mainly designed to improve the extent of mouth opening. Nonsurgical treatments are carried out not only to increase mouth opening but also to improve the symptoms and signs in OSF patients.27, 28 However, none of these previously proposed treatment modalities have proved curative or have reduced the morbidity significantly. So far, the most quantitative approach for OSF diagnosis is the measurement of maximum mouth opening (MMO), which is measured from the cutting edge of the upper central incisor to the cutting edge of the corresponding lower central incisor. However, this approach is quite indirect and does not provide information on the real condition of patient’s oral mucosa. Although OSF can be diagnosed clinically, it often needs a biopsy to confirm the clinical diagnosis. Therefore, it would be beneficial to have a real-time, noninvasive diagnostic technique, such as optical coherence tomography (OCT), to replace the incisional biopsy for OSF diagnosis. OCT has proven to be a useful technique for diagnosing diseases in the oral cavity. The images of human teeth and oral mucosa obtained by using a time-domain OCT system were first taken in 1998.29, 30, 31 In 2004, ex vivo OCT images of malignant mucosa of hamster cheek punches were obtained.32, 33, 34 Later, in vivo and three-dimensional (3-D) images of the same subject were also reported.35, 36 In clinical application of OCT to oral cancer diagnosis, in vivo benign and malignant human oral mucosa images were compared.37 In addition, OCT has been used for the study of laryngeal cancer38, 39 and the evaluation of radiation-induced oral mucositis.40, 41 Recently, based on the clinical scanning of a swept-source OCT (SS-OCT) system, three indicators have been proposed for effectively diagnosing oral cavity lesions, including the epithelium (EP) thickness, the standard deviation (SD) of A-mode scan intensity profile in the EP layer, and the decay constant of the spatial-domain spectrum of A-mode scan profile.42, 43 In a lesion, usually the EP thickness becomes larger if the boundary between the EP and LP layers can still be identified. Also, the SD becomes larger and the aforementioned decay constant becomes smaller. In this paper, we report the results of the clinical scanning of OSF patients and the statistical analyses of a few parameters, which can be used as the effective indicators for OSF diagnosis, based on an SS-OCT system. 2.Methods and MaterialsThe layout of the portable SS-OCT system and its operation specifications used in the hospital for clinical scanning has been shown in an earlier publication of the same group.43 A sweeping-frequency laser source (Santec) with the output spectral sweeping full-width at half-maximum of 110 nm, centered at 1310 nm, is used as the light source, which can provide 6 mW in output power and 20 kHz in sweep rate. The light source is connected to a Mach-Zehnder interferometer consisting of two couplers and two circulators. The interference fringe signal is detected by a balanced photodectector (PDB150C, Thorlabs) and sampled by a high-speed digitizer (PXI-5122, National Instruments). The laser power incident onto the tissue sample is around 1.5 mW. The achieved SS-OCT system sensitivity and axial resolution in free space are 103 dB and 8 μm (∼6 μm in tissue) at the depth of 1 mm, respectively. In the sample arm, the lateral scanning is implemented with a handheld probe consisting of a linear stepping motor (Haydon), which is used to achieve a scanning speed of 10 cm/s and a 1-cm scanning length. In clinical application, the whole probe is wrapped by a plastic plate to protect the optical components inside the probe. After the scanning of a patient, the wrapped plastic plate is discarded and the whole probe is sterilized with 70% ethanol. The lateral resolution of SS-OCT scanning is 15 μm. With this SS-OCT system, an image frame consisting of 2000 A-mode scans can be acquired within 0.1 s. The 2-D image has a pixel size of 7 μm × 5 μm. For statistical analysis, 44 OSF samples were obtained from 44 patients. Also, 44 healthy samples were obtained from 26 healthy volunteers. Meanwhile, 29 lesion samples and 44 normal control samples were obtained from another 29 patients. The OCT data of the normal control samples were obtained by scanning the surrounding regions of the lesions, in which mucosa looks normal on the surface. It is noted that a normal control sample is not necessarily healthy. All the samples under study belong to the category of buccal mucosa. All the patients have both habits of chewing AQ and smoking. Clinical diagnosis of OSF was made when a patient showed the characteristic features of OSF in the clinics, including blanching and stiffness of the oral mucosa, fibrous bands in the buccal or labial mucosa, and difficulty in opening the mouth. The MMO of all the OSF patients were recorded. A few OSF samples were confirmed by biopsy. All the lesion samples were diagnosed with biopsy.43 3.Results3.1.Analysis of Histology ImageFigures 1a and 1b show the typical histological microphotographs of almost healthy mucosa (with a very mild lymphocytic infiltrate in the upper LP layer) and OSF mucosa, respectively. Here, one can see the irregular boundary between the EP and LP layers, with the EP thickness in most portions larger than 500 μm. Also, line structures, as indicated by arrows, of blood vessels can be seen in the LP layer. In contrast, in OSF mucosa, the EP layer becomes significantly thinner and the boundary between the EP and LP layers becomes smoother. Meanwhile, in the LP layer, particularly in a depth range of several hundred μm below the EP/LP boundary, the image contrast looks homogeneous, indicating the collagen-rich OSF tissue structure. In Fig. 1b, the grain structure at the bottom corresponds to a minor salivary gland (SG). Fig. 1Typical histology images of (a) healthy and (b) OSF mucosa. The grain structure at the bottom in OSF mucosa corresponds to a salivary gland (SG).  To further realize the mucosal characteristics described earlier, the contrast intensity distributions of the two histological microphotographs are digitized for analyzing the statistics of EP thickness and LP tissue microstructure. Figure 2 shows the line-scan contrast intensity distributions of the histological microphotographs in Figs. 1a and 1b along the two marked vertical lines, designated as the Healthy and OSF curves. Here, the lower intensity ranges (darker contrast in the histological microphotograph) correspond to the EP layers. The EP thickness in the OSF sample is indeed smaller than that in the healthy oral mucosal sample. It is noted that in a depth range of about 500 μm directly below the EP/LP boundary in the OSF sample, the contrast intensity fluctuation is significantly weaker than that in the corresponding range of the healthy oral mucosal sample. This result confirms the observations in Figs. 1a and 1b. The difference in contrast intensity fluctuation can be quantified by the comparison of the intensity SD between the two samples. Figure 3 shows the comparison of SD (LP SD) variation along the lateral dimension (B-mode scan) between the healthy oral mucosal and OSF samples in the lateral ranges indicated by the horizontal bars in Figs. 1a and 1b. For each vertical line (A-mode scan) in either Fig. 1a or 1b, the SD is evaluated using a depth range of histological contrast intensity between 100 and 200 μm below the EP/LP boundary, as indicated by the horizontal bar for either healthy oral mucosal or OSF sample in Fig. 2. Although the SD value in either sample fluctuates along the lateral position, the average SD value of the OSF sample (0.199) is significantly smaller than that of the healthy oral mucosal sample (0.479). Therefore, the decrease of EP thickness and the more homogeneous tissue structure in the LP layer (homogeneous backscattering in OCT operation) can be used as the two effective indicators for diagnosing OSF based on OCT scanning. 3.2.Scanning Results of Optical Coherence TomographyFigures 4a and 4b show typical SS-OCT scanning images of healthy oral and OSF mucosa, respectively. Here, similar to what is observed in the histological microphotographs, the EP thickness is significantly thicker in the healthy oral mucosa. Also, salivary glands or blood vessels can be observed in the healthy oral mucosa, as symbolized by the dark spots and indicated by the white arrows. In contrast, in the OSF sample, such features become blurred. In Fig. 5, the solid (black) and dashed (red) curves show the A-mode scan intensity profiles indicated by the vertical lines in Figs. 4a and 4b, respectively. It is noted that before analyzing and comparing the OCT images, we normalize the raw data of each 2-D image by the maximum value of the individual image such that the image intensity is always between 0 and 1. In Fig. 4, the thinner EP layer and weaker intensity fluctuation in the upper LP layer of the OSF sample, when compared with those of the healthy oral mucosal sample, can be clearly seen. In Fig. 6, we show the lateral variations of the EP thickness of the healthy oral mucosal and OSF samples in the ranges indicated by the horizontal bars in Figs. 4a and 4b, respectively. The difference between the two samples is clear. Then, the lateral variations of SD values in the LP layers (LP SD), as calculated in a depth range between 100 and 200 μm below the EP/LP boundary, of the two samples are shown in Fig. 7 . Again, the average SD value over the B-mode scan range in the healthy oral mucosal sample (0.208) is larger than that in the OSF sample (0.125). Therefore, the OCT scan results show the same variation trends of the EP thickness and the signal intensity SD in the LP layer as those of the histology analysis. Fig. 4Typical SS-OCT scanning images of (a) healthy and (b) OSF mucosa. Glands or vessels can be observed in the healthy mucosa, as symbolized by the dark spots and indicated by the arrows.  Fig. 5A-mode scan intensity profiles of OCT indicated by the vertical lines in Figs. 4a and 4b for healthy and OSF samples, respectively. The horizontal bars indicate the depth ranges of the A-mode scan profiles for SD analysis. 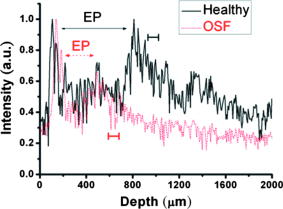 Fig. 6Lateral variations of EP thickness of the healthy and OSF samples in the depth ranges indicated by the horizontal bars shown in Figs. 4a and 4b, respectively.  Fig. 7Lateral variations of LP SD of the healthy and OSF samples in the depth ranges indicated by the horizontal bars shown in Figs. 4a and 4b, respectively.  For statistical analysis, 44 OSF and 44 healthy samples are used. To obtain a data point of EP thickness (SD in the LP layer) from a sample, the results in a B-mode scan range of 1 cm (8 mm) are averaged. The SD value in an A-mode scan is obtained by using the profile range between 100 and 200 μm below the EP/LP boundary. The solid squares and solid circles in Fig. 8 represent the EP thickness data points of the healthy oral mucosal and OSF samples, respectively. They are arranged in the decreasing order such that each sample can be identified in the following figures. Here, one can see that these two groups of data do not overlap, indicating that the EP thickness can be used to clearly differentiate OSF sample from healthy oral mucosal samples. The sensitivity and specificity of using EP thickness as a diagnosis indictor for differentiating OSF from healthy oral mucosal samples are shown in Table 1 . Here, one can see that if we choose an EP thickness between 350 and 400 μm as the criterion, both sensitivity and specificity can reach 100%. Fig. 8EP thickness data points of the healthy, OSF, lesion, and normal control sample groups. The data points are arranged in the decreasing orders.  Table 1Specificity and sensitivity of using various EP thickness values for diagnosing OSF evaluated based on 44 OSF and 44 healthy oral mucosal samples.
Similar to Fig. 8, the average SD values in the LP layers (LP SD) of the healthy oral mucosal and OSF samples are shown in Fig. 9 . Here, the two sets of data are arranged following the same sample orders as those in Fig. 8. One can see that the healthy oral mucosal and OSF data points overlap in the SD range between 0.19 and 0.22. As shown in Table 2 for the sensitivity and specificity of using the average SD value in the LP layer as a diagnosis indicator, the optimized SD value as the diagnosis criterion is around 0.2, with which around 85% sensitivity and 95% specificity can be achieved. Fig. 9Data points of average LP SD of the healthy, OSF, lesion, and normal control sample groups. The data points are arranged following the sample orders in Fig. 8.  Table 2Specificity and sensitivity of using various SD values in the LP layer for diagnosing OSF evaluated based on 44 OSF and 44 healthy oral mucosal samples.
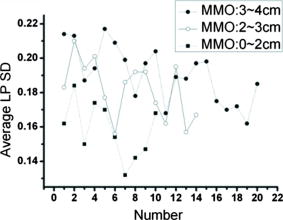
4.DiscussionsAs discussed earlier, in OSF, the EP layer becomes thinner and the SD of the A-mode scan intensity in the LP layer becomes smaller when compared with healthy oral mucosa. On the other hand, when a lesion starts to evolve, in the stages of epithelial hyperplasia, mild to moderate dysplasia, and moderate dysplasia, the EP layer becomes thicker when the EP/LP boundary can still be identified. It has been shown that the increased EP thickness can be used as an effective diagnosis indicator for a lesion.43 However, when an early-stage lesion, which may have an unclear surface feature, coexists with OSF in the oral cavity of a patient, the variation of EP thickness may lead to difficulty in differentiating between healthy tissue, lesion, and OSF. The coexistence of lesion and OSF can often be observed in the oral cavity of a patient who has the habit of chewing AQ. In this situation, further understanding of the variations of EP thickness and the SD of A-mode scan intensity among various mucosal conditions is important. In Fig. 8, we also show the EP thickness data of 29 lesion samples from 29 patients who were diagnosed to have epithelial hyperplasia, mild to moderate dysplasia, or moderate dysplasia. Also shown are the similar data of 44 normal control samples, which were obtained from the oral cavity portions around the lesions of 29 patients. In such a portion, mucosa looks normal from its clinical appearance. The data of such normal control scanning were used for comparison with the lesion parameters for lesion diagnosis.43 In Fig. 8, one can see that the EP thickness values of normal control samples are quite close to those of OSF and are significantly smaller than those of the healthy oral mucosal samples. However, those of lesion samples cover a broad range and significantly overlap with the ranges of healthy oral mucosal, OSF, and normal control samples. Therefore, when an OCT scan leads to the observation of a thin EP layer, we may face the difficulty of differentiating between lesion, OSF, and normal control. On the other hand, when we observe a thick EP layer in an OCT scan, we may face the difficulty of differentiating between the lesion and healthy conditions. To overcome these difficulties, we also show the data of average LP SD of the lesion and normal control samples in Fig. 9. Here, one can see that in spite of certain overlaps, the two groups of LP SD data points, including the low level of OSF and normal control samples and the high level of healthy oral mucosal and lesion samples, can be clearly differentiated. The similar EP thickness and LP SD values between normal control and OSF samples imply that most “normal control” samples obtained from those patients have OSF structures. This implication is highly possible because all those patients have the habit of chewing AQ. In the oral cavity of such a patient, a lesion usually evolves from an extended region of OSF condition. Therefore, when we scan a region outside but near a lesion, the mucosa there is expected to have an OSF condition. Hence, an OSF sample can be differentiated from the other three sample groups if the EP thickness is small and the LP SD is small. To further differentiate among different sample groups, we show the data of the average SD of A-mode scan in the EP layer (EP SD) of all the sample groups in Fig. 10 . An EP SD value was obtained by analyzing the A-mode scan range between 30 and 180 μm below the mucosa surface. The average EP SD was obtained by averaging the results over a B-mode scan range of 8 mm. Here, in spite of significant overlaps, based on the average EP SD values, the samples can be clearly classified into three categories, which are a low level of healthy oral mucosal samples, a high level of lesion samples, and an intermediate level of OSF and normal control samples. Therefore, by using the three indicators of EP thickness, LP SD, and EP SD, different mucosal conditions can be systematically differentiated. Fig. 10Data points of average EP SD of the healthy, OSF, lesion, and normal control sample groups. The data points are arranged following the sample orders in Fig. 8.  In conventional diagnosis of OSF, the measurement of MMO is usually used as an important indicator. We have classified the OSF samples into three groups based on the MMO values of those patients. In Figs. 11 and 12 , we show the EP thickness and the average LP SD data, respectively, of those three MMO groups (0 to 2, 2 to 3, and 3 to 4 cm). Here, one can see that in either EP thickness or average LP SD, the data of three MMO groups significantly overlap even though the trends of smaller EP thickness and smaller average LP SD are consistent with that of smaller MMO. The results shown here imply that using EP thickness and average LP SD in the LP layer can be a more effective OSF diagnosis technique, when compared with the conventional method of measuring MMO. 5.ConclusionsIn summary, we have demonstrated the use of the EP thickness and the SD of A-mode scan intensity in the LP layer as effective indicators for OSF diagnosis based on the clinical scanning of 44 OSF patients with an SS-OCT system of ∼6 μm in axial resolution (in tissue) and 103 dB in sensitivity. Compared with the corresponding parameters in healthy oral mucosa from 44 volunteers, the EP thickness became smaller and the LP SD also became smaller. The LP SD could also be used for effectively differentiating OSF (small LP SD) from lesion (large LP SD), which is particularly useful for the possible case of a lesion without a clear surface feature. Meanwhile, the use of the EP SD could further help in differentiating OSF (medium EP SD) from healthy (small EP SD) and lesion (large SD) conditions. Compared with the conventional method of measuring MMO, the use of the proposed indicators can be a more effective technique for OSF diagnosis. AcknowledgmentsThis research was supported by the National Health Research Institute, Taiwan, the Republic of China, under Grant No. NHRI-EX97-9616EI. ReferencesR. Maher, A. J. Lee, K. A. A. S. Warnakulasuriya, J. A. Lewis, and N. W. Johnson,
“Role of areca nut in the causation of oral submucous fibrosis: a case-control study in Pakistan,”
J. Oral Pathol. Med., 23 65
–69
(1994). https://doi.org/10.1111/j.1600-0714.1994.tb00258.x 0904-2512 Google Scholar
P. R. Murti, R. B. Bhonsle, P. C. Gupta, D. K. Daftary, J. J. Pindborg, and F. S. Mehta,
“Etiology of oral submucous fibrosis with special reference to the role of areca nut chewing,”
J. Oral Pathol. Med., 24 145
–152
(1995). https://doi.org/10.1111/j.1600-0714.1995.tb01156.x 0904-2512 Google Scholar
N. Shah and P. P. Sharma,
“Role of chewing and smoking habits in the etiology of oral submucous fibrosis (OSF): a case-control study,”
J. Oral Pathol. Med., 27 475
–479
(1998). 0904-2512 Google Scholar
C. P. Chiang, M. J. Lang, B. Y. Liu, J. T. Wang, J. S. Leu, L. J. Hahn, and M. Y. Kuo,
““Expression of proliferating cell nuclear antigen (PCNA) in oral submucous fibrosis, oral epithelial hyperkeratosis and oral epithelial dysplasia in Taiwan,”
Oral Oncol., 36 353
–359
(2000). https://doi.org/10.1016/S1368-8375(00)00014-2 0964-1955 Google Scholar
C. P. Chiang, M. J. Lang, B. Y. Liu, J. T. Wang, J. S. Leu, L. J. Hahn, and M. Y. Kuo,
““Expression of p53 protein in oral submucous fibrosis, oral epithelial hyperkeratosis, and oral epithelial dysplasia,”
J. Formos Med. Assoc., 99 229
–234
(2000). 0929-6646 Google Scholar
Y. C. Ko, T. A. Chiang, S. J. Chang, and S. F. Hsieh,
“Prevalence of betel quid chewing habit in Taiwan and related sociodemographic factors,”
J. Oral Pathol. Med., 21 261
–264
(1992). https://doi.org/10.1111/j.1600-0714.1992.tb01007.x 0904-2512 Google Scholar
J. J. Pindborg, F. S. Mehta, P. C. Gupta, and D. K. Daftary,
“Prevalence of oral submucous fibrosis among 50915 Indian villagers,”
Br. J. Cancer, 22 646
–654
(1968). 0007-0920 Google Scholar
K. M. Lay, K. Sein, A. Myint, S. K. Ko, and J. J. Pindborg,
“Epidemiolgic study of 600 villagers of oral precancerous lesions in Bilugyun: preliminary report,”
Community Dent. Oral Epidemiol., 10 152
–155
(1982). https://doi.org/10.1111/j.1600-0528.1982.tb01341.x 0301-5661 Google Scholar
H. A. Seedat,
“Oral submucous fibrosis in Durban, Natal: a study of its epidemiology, aetiology and morphological features,”
(1985). Google Scholar
R. B. Zain, N. Ikeda, I. A. Razak, T. Axéll, Z. A. Majid, P. C. Gupta, and M. Yaacob,
“A national epidemiological suvey of oral mucosal lesions in Malaysia,”
Community Dent. Oral Epidemiol., 25 377
–383
(1997). https://doi.org/10.1111/j.1600-0528.1997.tb00959.x 0301-5661 Google Scholar
J. G. Tang, X. F. Jian, M. L. Gao, T. Y. Ling, and K. H. Zhang,
“Epidemiological survey of oral submucous fibrosis in Xiangtan City, Hunan province, China,”
Community Dent. Oral Epidemiol., 25 177
–180
(1997). https://doi.org/10.1111/j.1600-0528.1997.tb00918.x 0301-5661 Google Scholar
S. Meghji, A. Scutt, W. Harvey, and J. P. Canniff,
“An in vitro comparison of human fibroblasts from normal and oral submucous fibrosis tissue,”
Arch. Oral Biol., 32 213
–215
(1987). https://doi.org/10.1016/0003-9969(87)90138-5 0003-9969 Google Scholar
M. Y. P. Kuo, H. M. Chen, L. J. Hahn, C. C. Hsieh, and C. P. Chiang,
“Collagen biosynthesis in human oral submucous fibrosis fibroblast cultures,”
J. Dent. Res., 74 1783
–1788
(1995). https://doi.org/10.1177/00220345950740111101 0022-0345 Google Scholar
W. Harvey, A. Scutt, S. Meghji, and J. P. Canniff,
“Simulation of human buccal mucosa fibroblasts in vitro by betel-nut alkaloids,”
Arch. Oral Biol., 31 45
–49
(1986). https://doi.org/10.1016/0003-9969(86)90112-3 0003-9969 Google Scholar
E. J. Kovacs,
“Fibrogenic cytokines: the role of immune mediators in the development of scar tissue,”
Immunol. Today, 12 17
–23
(1991). https://doi.org/10.1016/0167-5699(91)90107-5 0167-4919 Google Scholar
T. Y. Shieh, and J. F. Yang,
“Collagenase activity in oral submucous fibrosis,”
Proc. Natl. Sci. Counc Repub China B, 16 106
–110
(1992). 0255-6596 Google Scholar
C. C. Tsai, R. H. Ma, and T. Y. Shieh,
“Deficiency in collagen and fibronectin phagocytosis by human buccal mucosa fibroblasts in vitro as a possible mechanism for oral submucous fibrosis,”
J. Oral Pathol. Med., 28 59
–63
(1999). 0904-2512 Google Scholar
Y. C. Chang, S. F. Yang, K. W. Tai, M. Y. Chou, and Y. S. Hsieh,
“Increased tissue inhibitor of metalloproteinase-1 expression and inhibition of gelatinase A activity in buccal mucosal fibroblasts by arecoline as possible mechanisms for oral submucous fibrosis,”
Oral Oncol., 38 195
–200
(2002). https://doi.org/10.1016/S1368-8375(01)00045-8 0964-1955 Google Scholar
D. H. Shieh, L. C. Chiang, and T. Y. Shieh,
“Augmented mRNA expression of tissue inhibitor of metalloproteinase-1 in buccal mucosal fibroblasts by arecoline and safrole as a possible pathogenesis for oral submucous fibrosis,”
Oral Oncol., 34 728
–735
(2003). https://doi.org/10.1016/S1368-8375(03)00101-5 0964-1955 Google Scholar
R. Kuttan, P. V. Donnely, and N. Di Ferrante,
“Collagen treated with (+)-catechin becomes resistant to the action of mammalian collagenase,”
Experientia, 37 221
–223
(1981). https://doi.org/10.1007/BF01991620 0014-4754 Google Scholar
A. Scutt, S. Meghji, J. P. Canniff, and W. Harvey,
“Stabilization of collagen by betel nut polyphenols as a mechanism in oral submucous fibrosis,”
Experientia, 43 391
–393
(1987). https://doi.org/10.1007/BF01940422 0014-4754 Google Scholar
R. H. Ma, C. C. Tsai, and T. Y. Shieh,
“Increased lysyl oxidase activity in fibroblasts cultured from oral submucous fibrosis associated with betel nut chewing in Taiwan,”
J. Oral Pathol. Med., 24 407
–412
(1995). https://doi.org/10.1111/j.1600-0714.1995.tb01210.x 0904-2512 Google Scholar
C. Trivedy, K. A. A. S. Warnakulasuriya, V. K. Hazarey, M. Tavassoli, P. Sommer, and N. W. Johnson,
“The upregulation of lysyl oxidase in oral submucous fibrosis and squamous cell carcinoma,”
J. Oral Pathol. Med., 28 246
–251
(1999). 0904-2512 Google Scholar
D. Gupta, and S. C. Sharma,
“Oral submucous fibrosis—a new treatment regimen,”
J. Oral Maxillofac Surg., 46 830
–833
(1988). https://doi.org/10.1016/0278-2391(88)90043-2 0278-2391 Google Scholar
J. P. Canniff, W. Harvey, and M. Harris,
“Oral submucous fibrosis: its pathogenesis and management,”
Br. Dent. J., 160 429
–434
(1986). https://doi.org/10.1038/sj.bdj.4805876 0007-0610 Google Scholar
S. V. Golhar, M. N. Mahore, and S. Narkhede,
“Oral submucous fibrosis,”
Dent. Dialogue, 12 44
–49
(1987). 0970-4167 Google Scholar
R. M. Borle and S. R. Borle,
“Management of oral submucous fibrosis: a conservative approach,”
J. Oral Maxillofac Surg., 49 788
–791
(1991). https://doi.org/10.1016/0278-2391(91)90002-4 0278-2391 Google Scholar
R. Maher, P. Aga, N. W. Johnson, R. Sankaranarayanan, and S. Warnakulasuriya,
“Evaluation of multiple micronutrient supplementation in the management of oral submucous fibrosis in Karachi, Pakistan,”
Nutr. Cancer, 27 41
–47
(1997). https://doi.org/10.1080/01635589709514499 0163-5581 Google Scholar
B. W. Colston Jr., M. J. Everett, L. B. Da Silva, L. L. Otis, P. Stroeve, and H. Nathel,
“Imaging of hard- and soft-tissue structure in the oral cavity by optical coherence tomography,”
Appl. Opt., 37 3582
–3585
(1998). https://doi.org/10.1364/AO.37.003582 0003-6935 Google Scholar
B. W. Colston Jr., M. J. Everett, U. S. Sathyam, L. B. DaSilva, and L. L. Otis,
“Imaging of the oral cavity using optical coherence tomography,”
Monogr. Oral Sci., 17 32
–55
(2000). https://doi.org/10.1159/000061643 0077-0892 Google Scholar
L. L. Otis, M. J. Everett, U. S. Sathyam, B. W. Colston Jr.,
“Optical coherence tomography: a new imaging technology for dentistry,”
J. Am. Dent. Assoc., 131 511
–514
(2000). 0002-8177 Google Scholar
E. Matheny, N. Hanna, W. Jung, Z. Chen, and P. Wilder-Smith,
“Optical coherence tomography of malignancy in hamster cheek pouches,”
J. Biomed. Opt., 9 978
–981
(2004). https://doi.org/10.1117/1.1783897 1083-3668 Google Scholar
P. Wilder-Smith, W. G. Jung, M. Brenner, K. Osann, H. Beydoun, D. Messadi, and Z. Chen,
“In vivo optical coherence tomography for the diagnosis of oral malignancy,”
Lasers Surg. Med., 35 269
–275
(2004). https://doi.org/10.1002/lsm.20098 0196-8092 Google Scholar
A. L. Clark, A. Gillenwater, R. Alizadeh-Naderi, A. K. El-Naggar, and R. Richards-Kortum,
“Detection and diagnosis of oral neoplasia with an optical coherence microscope,”
J. Biomed. Opt., 9 1271
–1280
(2004). https://doi.org/10.1117/1.1805558 1083-3668 Google Scholar
W. Jung, J. Zhang, J. Chung, P. Wilder-Smith, M. Brenner, J. S. Nelson, and Z. Chen,
“Advances in oral cancer detection using optical coherence tomography,”
IEEE J. Sel. Top. Quantum Electron., 11 811
–817
(2005). https://doi.org/10.1109/JSTQE.2005.857678 1077-260X Google Scholar
N. M. Hanna, W. Waite, K. Taylor, W. G. Jung, D. Mukai, E. Matheny, K. Kreuter, P. Wilder-Smith, M. Brenner, and Z. Chen,
“Feasibility of three-dimensional optical coherence tomography and optical Doppler tomography of malignancy in hamster cheek pouches,”
Photomed. Laser Surg., 24 402
–409
(2006). https://doi.org/10.1089/pho.2006.24.402 1549-5418 Google Scholar
J. M. Ridgway, W. B. Armstrong, S. Guo, U. Mahmood, J. Su, R. P. Jackson, T. Shibuya, R. L. Crumley, M. Gu, Z. Chen, and B. J. Wong,
“In vivo optical coherence tomography of the human oral cavity and oropharynx,”
Arch. Otolaryngol. Head Neck Surg., 132 1074
–1081
(2006). https://doi.org/10.1001/archotol.132.10.1074 0886-4470 Google Scholar
B. Wong, R. Jackson, S. Guo, J. Ridgway, U. Mahmood, J. Shu, T. Shibuya, R. Crumley, M. Gu, W. Armstrong, and Z. Chen,
“In vivo optical coherence tomography of the human larynx: normative and benign pathology in 82 patients,”
Laryngoscope, 115 1904
–1911
(2005). https://doi.org/10.1097/01.MLG.0000181465.17744.BE 0023-852X Google Scholar
W. Armstrong, J. Ridgway, D. Vokes, S. Guo, J. Perez, R. Jackson, M. Gu, J. Su, R. Crumley, T. Shibuya, U. Mahmood, Z. Chen, and B. Wong,
“Optical coherence tomography of laryngeal cancer,”
Laryngoscope, 116 1107
–1113
(2006). https://doi.org/10.1097/01.mlg.0000217539.27432.5a 0023-852X Google Scholar
T. M. Muanza, A. P. Cotrim, M. McAuliffe, A. L. Sowers, B. J. Baum, J. A. Cook, F. Feldchtein, P. Amazeen, C. N. Coleman, and J. B. Mitchell,
“Evaluation of radiation-induced oral mucositis by optical coherence tomography,”
Clin. Cancer Res., 11 5121
–5127
(2005). https://doi.org/10.1158/1078-0432.CCR-05-0403 1078-0432 Google Scholar
P. Wilder-Smith, M. J. Hammer-Wilson, J. Zhang, Q. Wang, K. Osann, Z. Chen, H. Wigdor, J. Schwartz, and J. Epstein,
“In vivo imaging of oral mucositis in an animal model using optical coherence tomography and optical Doppler tomography,”
Clin. Cancer Res., 13 2449
–2454
(2007). https://doi.org/10.1158/1078-0432.CCR-06-2234 1078-0432 Google Scholar
M. T. Tsai, H. C. Lee, C. W. Lu, Y. M. Wang, C. K. Lee, C. C. Yang, and C. P. Chiang,
“Delineation of an oral cancer lesion with swept-source optical coherence tomography,”
J. Biomed. Opt., 13 044012
(2008). https://doi.org/10.1117/1.2960632 1083-3668 Google Scholar
M. T. Tsai, H. C. Lee, C. K. Lee, C. H. Yu, H. M. Chen, C. P. Chiang, C. C. Chang, Y. M. Wang, and C. C. Yang,
“Effective indicators for diagnosis of oral cancer using optical coherence tomography,”
Opt. Express, 16 15847
–15862
(2008). https://doi.org/10.1364/OE.16.007778 1094-4087 Google Scholar
|
||||||||||||||||||||||||||||||||||||||||||||||||||||||||||||||||