
|
|
1.IntroductionHigh-resolution 3-D imaging of large tissue volumes remains a major challenge in optical microscopy. Commercial macroscopes based on standard wide-field imaging are readily available. When coupled with mega-pixel cameras, these can easily provide subcellular lateral resolution; however, they cannot provide optical sectioning required for 3-D resolution. On the other hand, techniques that do provide 3-D resolution, such as confocal or two-photon microscopy, typically offer only limited fields of view and penetration depths.1 Macroscopic imaging with such techniques is quite laborious, generally requiring image stitching to obtain extended fields of view, and destructive block-face sectioning to obtain extended penetration depths. Light-sheet-based microscopy has gained renewed interest as a technique that confers optical sectioning to a standard wide-field macroscope. The idea of light-sheet-based microscopy is to illuminate the sample side-on with a thin laminar plane of light, typically obtained with a laser and cylindrical lens, and aligned to be coplanar with the focal plane of the macroscope imaging optics. The macroscope thus images only the optical section defined by the illumination plane. Such a technique for optical sectioning was described as early as 1903 for reflectance imaging;2 however, more recently it has been applied to fluorescence imaging.3 Different authors have adopted different names for this technique, including ultramicroscopy,2, 4 orthogonal-plane fluorescence optical sectioning (OPFOS),3, 5 thin-light-sheet microscopy (TLSM),6 selective or single-plane illumination microscopy (SPIM),7 digital scanned laser-light sheet fluorescence microscopy (DSLM),8 and thin-sheet laser imaging microscopy (TSLIM). 9 Alternative tilted axis configurations have also been reported, where the light sheet is coupled to the imaging objective either externally10 or internally.11, 12 Since no name seems to have gained full traction yet, we refer to the technique here simply as light-sheet microscopy. Light-sheet microscopy is most effective for samples that are highly transparent. For example, light-sheet microscopy has been used to image entire fish embryos.7, 8 To obtain large volume imaging in inherently less transparent samples, such as mouse brains, a key requirement has been the use of an optical clearing agent that minimizes index of refraction mismatches within the sample,3 and hence minimizes light scattering. Remarkably, clearing techniques have been developed that preserve the function of green fluorescent protein (GFP), enabling a rapid 3-D rendering of specifically targeted neuronal networks.4 However, as effective as optical clearing has been, it is never perfect. For example, optical clearing of mature mouse brains has proved to be difficult, presumably because of the added index of refraction heterogeneity presented by increased myelination. Residual index of refraction mismatches undermine the performance of light-sheet microscopy for two main reasons. First, they deteriorate the illumination quality by causing the light sheet to broaden, thereby undermining optical sectioning and introducing out-of-focus background. Second, they deteriorate imaging quality by introducing scattering and aberrations, thereby undermining image resolution. Recently, it has been shown that the first of these problems can be partially compensated with a technique called structured illumination microscopy (SIM),13, 14 which rejects out-of-focus background. We demonstrate here that a similar effect of out-of-focus background rejection can be achieved with a hybrid-illumination technique we call HiLo microscopy.15, 16 (Note that by unfortunate coincidence, the acronym used in Ref. 11 is similar to the name of our background rejection technique; the two techniques should not be confused.) 2.Scanning Light-Sheet MicroscopyThe layout of our light-sheet microscope is illustrated in Fig. 1 . While in most previously reported configurations the light sheet is formed with a cylindrical lens, we adopt an alternative configuration where the light sheet is obtained by laterally scanning a thin laser beam across the field of view. Such a configuration was utilized, for example, in Ref. 8. As pointed out in this reference, there are several advantages to laser scanning. First, it allows one to readily adjust the span of the field of illumination by simply adjusting the laser scanning range; second, it provides an effectively uniform light-sheet power density across the entire field of illumination; and third, it enables the introduction of illumination structure. This last advantage is the most important for us, since it is required for the implementation of HiLo microscopy. Fig. 1Layout of scanning light-sheet microscope. The laser beam power is modulated with an acousto-optic modulator (AOM) and expanded with a expander. The beam is then focused into a sample with an lens. The sample is mounted on a motorized rotary stage, which is itself mounted on a platform whose height is controlled by a motorized linear translation stage. Fast horizontal scanning of the laser beam is performed with a piezomounted tilt mirror to produce a light sheet. Uniform and structured illumination images are acquired during scan fly-forward and fly-back, respectively. Slow vertical light-sheet tracking is ensured with a motorized tilt mirror. The setup is displayed as a top view. The inset in dashed lines is a front view. 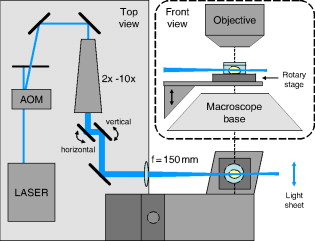 A laser beam [Cobolt (Solna, Sweden) Calypso , wavelength ] is sent through an acousto-optic modulator (AA Opto-Electronic MTS110, AA sa, Orsay Cedex, France) producing a first-order diffracted beam that is isolated with an iris diaphragm. The beam is then delivered through a variable Galilean beam expander [Thorlabs (Newton, New Jersey) 2 to ]. Beam scanning is performed with a single-axis piezoelectric mirror tilting system [Piezosystem Jena (Jena, Germany) PSH 35] that provides up to mechanical tilt ( optical). The tilting mirror and sample are arranged in a configuration, separated by a planoconvex lens . The role of the lens is two-fold. First, it converts a tilt angle at the mirror location into a lateral translation at the sample location. A tilt range thereby leads to a maximum light-sheet span of about a centimeter. Second, the lens provides weak focusing of the beam at the sample location. The waist of the laser beam at the sample location (i.e., the effective thickness of the light sheet) is inversely related to the waist of the beam at the mirror location. The latter waist can be adjusted by the beam expander in the range , leading to a light-sheet thickness in the range . Note that the thinner the light sheet, the narrower the confocal parameter of the focus, which ranges correspondingly from . Since the confocal parameter characterizes the range over which the light-sheet thickness remains roughly uniform in the direction of laser propagation, a compromise must be made between light-sheet thinness and uniformity. This compromise is made by the user with the beam expander, and can vary from sample to sample. In practice, our light-sheet thickness was nominally set to about . The sample itself is immersed in a clearing solution in an open cuvette that is mounted on a motorized rotation stage [Newport (Irvine, California) Agilis PR100] that can be manually or computer controlled to obtain a desired sample orientation. Both the sample and rotation stage lay on a platform whose height is computer controlled by a linear translation stage [Physik Instrumente (Karlsruhe, Germany) M126] with submicron resolution. The imaging depth in the sample is thus controlled by the height of this stage. Imaging of the sample is performed with a standard unmodified Olympus MVX10 macroscope equipped with and plan apochromat objectives and a charge-coupled device (CCD) camera (Hamamatsu Orca II). Depending on the magnification of the microscope, which is both objective dependent and can be adjusted by an internal zoom lens, the lateral resolution of the microscope was limited either by the overall numerical aperture (NA) of the imaging optics or by the camera pixel size. In most cases, we operated in a nominally NA-limited regime; however, as pointed out next, the actual resolution was most often limited by sample-induced aberrations. Since the focus in our sample was adjusted by vertically translating the entire sample cuvette, we must also correct for apparent shifts in the focal depth arising from the index of refraction mismatch presented by the clearing fluid interface. The index of refraction of our clearing fluid was , meaning that its interface induces substantial aberrations. For example, if the height of the linear translation stage is increased by , the apparent focal depth in the sample is increased not by , but instead by (in a geometric-optic paraxial approximation). For the light sheet to remain coplanar with this apparent focal depth, the light-sheet height must therefore be shifted down by a distance . That is, inasmuch as , the light-sheet height must be systematically adjusted to prevent walkoff between the light sheet and the apparent imaging focal plane. To perform this adjustment and enable automatic light-sheet tracking, we introduced a vertically tilting mirror in close proximity to the horizontally scanning piezomirror (see Fig. 1). The vertical tilt was driven by an inchworm transducer with about a angular resolution (Newport Agilis M050), thus allowing manual or computer control of the light-sheet height with resolution. Unfortunately, the geometric optic walkoff estimate described above proved to be inadequate in practice, and an empirical method was used instead. In this method, a focal depth range of interest was identified. The light-sheet height was then manually adjusted at each of the two extremes of this range, thereby identifying the corresponding light-sheet height range. The relation between light-sheet height and focal depth was then established by linear interpolation, upon which the light-sheet height control was relegated to the computer. In this manner, automatic light-sheet height tracking could be performed over focal depth ranges of several millimeters without significant walkoff. 3.Background Reduction with HiLo MicroscopyThe axial resolution of a light-sheet microscope is governed by the thickness of the light sheet (presuming this is coplanar with the focal plane). However, even in an optically cleared sample, the thickness of the light sheet is rarely diffraction limited, since it is generally broadened by effects such as residual scattering or aberrations, which lead to both a degradation in axial resolution and an introduction of out-of-focus background. In previous reports,8, 14 a technique called structured illumination microscopy (SIM)13 was used to palliate these effects, wherein the illumination light sheet was not a uniform plane but rather a sequence of grid patterns of incrementing phase. We adopt an alternative strategy here, called HiLo microscopy, that uses both uniform and grid illumination. Both HiLo microscopy and SIM are based on the same principle that, when using grid illumination, an in-focus signal appears modulated, whereas out-of-focus background does not. The key difference between HiLo and SIM is the method of demodulation. Whereas SIM demodulation is based on a phase-stepping algorithm that requires at least three grid illumination images, HiLo demodulation requires only a single grid illumination image. The drawback of single-image demodulation is that it is reliable only for a low resolution structure that is coarser than the grid period. A second image is therefore used, acquired with uniform illumination, to recover any missing high resolution structure. Some advantages of HiLo microscopy, aside from speed, are that it does not require control of the grid phase and it is insensitive to defects or sample-induced deformations in the grid pattern. Indeed, it does not even require a grid pattern, since it has been shown to also work with random speckle illumination.15 The details of HiLo microscopy have been presented elsewhere.15, 16 In brief, the images acquired with uniform and grid pattern illumination are written respectively as: where and are the image contributions that are in and out of focus, respectively (pixel coordinates ), and the grid pattern is modeled as being a sinusoid of spatial frequency and contrast . A prefactor of one half is introduced in Eq. 2, because the total power in the grid illumination is half that of the uniform illumination. As noted earlier, the in-focus contribution in Eq. 2 is modulated, whereas the out-of-focus contribution is not.To extract in Eq. 2, a variety of demodulation techniques can be used. These include local variance estimation,15 single sideband demodulation,16 or a conceptually simpler method of subtraction followed by rectification, which is applied here. In this new technique, a partially demodulated image is obtained from. [Note: to ensure that was locally centered about zero, this was high-pass filtered prior to taking its absolute value. The cutoff frequency of the high-pass filter was much smaller than .]On applying a low-pass filter (LP) to of cutoff frequency somewhat smaller than , we then find To recover the high-frequency components in , we apply a complementary high-pass filter (HP) directly to , obtaining since, by definition, out-of-focus contributions exhibit only low frequency spatial structure, meaning .Finally, by combining Eqs. 4, 5, we obtain a full bandwidth representation of , given by In this expression, is nominally equal to ; however, it is treated here as an unknown and adjusted so that the transition from low to high frequencies in occurs seamlessly.15 We emphasize that contains all the spatial frequencies within the bandwidth of the imaging optics. As such, the lateral resolution of HiLo microscopy is identical to that of standard wide-field microscopy and is defined to be . The axial resolution of HiLo microscopy, on the other hand, is largely governed by the grid period. An estimate of this resolution is obtained by considering a thin planar sample, and calculating the decay of the grid illumination contrast as a function of sample defocus . Based on the Stokseth approximation of the optical transfer function,17 the full width at half maximum (FWHM) of the contrast decay occurs over a defocus range , where is the grid period, and we have assumed . In practice, assuming a typical macroscope NA of about 0.25 (corresponding to a lateral resolution of about ), and a grid period of , we find to be in the range . This is larger than the idealized diffraction-limited thickness of the light sheet. However, our calculation of was derived for a uniform planar sample only. It should thus be interpreted as a range-defining out-of-focus background rejection rather than a range-defining axial resolution. For actual samples with structure, the axial resolution is expected to be better than . 4.Sample PreparationCleared whole mouse brains were prepared as follows. Sparse neuronal populations in the hippocampus were labeled with cytoplasmic EGFP by in utero electroporation.18 We also used the thy-1 transgenic mouse line expressing cytoplasmic EGFP.19 Mice from old were anesthetized by inhalant isoflurane and transcardially perfused with buffered saline (PBS) (pH 7.4) followed by ice-cold fixative containing 4% paraformaldehyde in PB (pH 7.4). Whole mouse brains were removed, rinsed in , and sequentially dehydrated in a series of ethanol (30, 50, 75, and 90%, and 2 to 3 times 100% for a day each step) at . We improved the preservation of fluorescent signals during serial dehydration by diluting ethanol in PB and by adjusting the pH value (approximately 7.4) of dehydration solutions with a sodium ethoxide solution (Sigma, Saint Louis, Missouri). Whole dehydrated mouse brains became transparent in benzyl alcohol:benzyl (BABB) clearing solution (Sigma) at room temperature, and then stored in BABB solution at until imaging. All animal procedures were conducted with accordance with the Howard Hughes Medical Institute (HHMI) Care and Use Guidelines of Laboratory Animals. 5.ResultsTo begin, we performed light-sheet microscopy on an entire mouse brain of age P14. Optical clearing at this young age is very effective because of immature myelination. Broadening of the light sheet due to scattering was therefore minimal. In this case, we did not expect HiLo microscopy to significantly improve image quality. Nevertheless, as shown next, some scattering subsisted and image improvement became apparent. Figure 2 illustrates a panoramic view of the hippocampus and surrounding structure. The sample was immersed in a round cuvette in this case (a truncated scintillation vial), causing the grid pattern to be tilted in a spoke-like pattern. The point of using a round cuvette here is to demonstrate that HiLo remains effective even with varying grid periods that are not necessarily parallel or exactly periodic. Indeed, the out-of-focus background is clearly reduced in the processed HiLo image [Fig. 2]. Most of the signal in these images arise from autofluorescence; however, bright EGFP-labeled pyramidal neurons are apparent in the CA1 and CA3 regions of the hippocampus. Note that the contrast of the grid pattern is reduced in the midbrain [lower right in Figs. 2, 2, 2], presumably due to increased scattering in this region that causes broadening of the light sheet into out-of-focus planes. While such broadening does not affect the intensity in the uniform illumination image, it manifestly reduces the intensity in the HiLo image, because it causes an expected decrease in the in-focus signal. Fig. 2Scanning light-sheet images of an optically cleared whole mouse brain (P14) whose hippocampal pyramidal neurons have been targeted with EGFP via in utero electroporation (Cb: cerebellum, Cx: cortex, Hi: hippocampus, Mid: midbrain, Str: striatum, CA1/3: area of Ammon’s horn, DG: dentate gyrus). Top panels are images acquired with (a) uniform and (b) structured sheet illumination. (c) is the resultant HiLo processed image. Sparsely labeled neurons stand out as bright fluorescent objects amid lower level autofluorescence. (d), (e), and (f) are zoomed maximum intensity projections ( depth range) of a single cell. Fields of view are (top) and (bottom). Laser power was . Camera exposure time per image was .  To confirm the fact that HiLo microscopy and standard wide-field microscopy provide the same lateral resolution, we acquired optically zoomed images of a bright neuron [Figs. 2, 2, 2]. The resolution of the fine processes of this neuron are indeed identical in both the uniform and HiLo images. The benefit of applying HiLo processing in this case is contrast improvement, resulting from enhanced out-of-focus background rejection. Note that contrast and resolution in the HiLo image are maintained even in zones where the grid pattern was dark. It can be observed from Fig. 2 that the application of HiLo reveals apparent streaks in the final processed image. These streaks are real and not artifacts, and are caused by local absorption or scattering centers in the sample, which produce variations in the laser illumination intensity that become visible downstream from the centers. Particularly egregious are streaks arising from edge defects where the laser beam enters the sample, since these tend to fill the entire sample observation area. The susceptibility of standard light-sheet microscopy to such illumination streaks is well known. By rejecting out-of-focus haze, HiLo unavoidably makes these streaks more apparent. While this effect may appear to be undesirable, it is a consequence of improved optical sectioning. Finally, we note that the grid pattern exhibits a somewhat reduced contrast near the top and bottom edges of Fig. 2. This may be due to a slight tilt of the light sheet relative to the imaging focal plane, perhaps due to sample-induced aberrations. The effect of such a tilt is to reduce in-focus signal near the top and bottom edges of the HiLo image [Fig. 2]. Figures 2, 2, 2 are maximum intensity projections of stacks of 20 images spanning a depth range. As emphasized before, HiLo microscopy should provide an even greater benefit when the sample exhibits greater scattering. To demonstrate this, we performed light-sheet imaging of an older mouse brain (P45), this time using a square cuvette [a truncated standard spectrophotometer cuvette (Starna, Atascadero, California)]. Scattering from myelinated structures in this sample became so significant that it could be used as the signal itself. In this manner, light-sheet microscopy could be performed in a dark-field imaging mode simply by removing the fluorescence emission filter to directly detect scattered laser light. The laser light power had to be reduced to such an extent in this mode that the occurrence of fluorescence became negligible. Such imaging has been demonstrated previously in Ref. 4. Figures 3, 3, 3 illustrate dark-field imaging of the hippocampus region in a whole mouse brain. These images represent average intensity projections of stacks of ten frames covering a depth range. The apparent chirp in the grid period is the result of a somewhat nonuniform laser scanning speed (the scan mirror was equipped only with open-loop electronics). Nevertheless, as emphasized earlier, HiLo imaging is relatively insensitive to variations in grid period. The network of myelinated axon fibers in the alveus of the hippocampus and striatum is clearly visible in both the uniform illumination and HiLo images; however, the HiLo image exhibits significantly better out-of-focus background rejection and enhanced contrast. To directly visualize the improvement in background rejection, we combined a single uniform and corresponding HiLo frame into a single RGB image, such that the HiLo signal provides cyan highlights in an otherwise red uniform illumination signal. This is illustrated in Fig. 4 . Tilted axon processes that appear extended in red are manifestly much more confined to the focal plane in cyan. To better characterize the improvement in out-of-focus background rejection provided by HiLo imaging, some representative pixel values taken along a horizontal line (green) are shown in a plot. The illumination in Fig. 4 (and Fig. 3) was incident from the left. As a result, the relative out-of-focus background increases from left to right, as expected. Ultimately, beyond pixel value , the laser power becomes so depleted that both signal and background begin to fade. Fig. 3Scanning light-sheet images of the half forebrain region of an optically cleared whole mouse brain of older age P45 (Cx: cortex, Mid: midbrain, Str: striatum). Images are acquired in a dark-field scattering mode. A network of myelinated axon processes in the alveus (Alv) of the hippocampus and striatum is clearly visible. Grayscale panels are average intensity projections ( depth range) of (a) uniform and (b) structured illumination images, and (c) the corresponding HiLo images. Field of view is . Laser power was (no emission filter). Camera exposure time per image was .  Fig. 4Same data as in Fig. 3. The color image represents an overlay of a single frame from the uniform illumination (red) and HiLo (cyan) stacks. Pixel values along a horizontal line (green) are shown in the plot, depicting uniform illumination (red) and HiLo (black) traces. Both traces are normalized to their respective maximum values.  An important clarification should be made here. From Fig. 4, it might be presumed that similar out-of-focus background rejection could be attained by the simple application of a Fourier filter to the uniform illumination image. This is, in fact, not the case, since such a Fourier filter would be unable to distinguish out-of-focus background from an in-focus signal that is slowly varying in space. An example of a slowly varying in-focus signal is apparent between pixel numbers 250 and 450 of the plot in Fig. 4, depicting a relatively uniform signal plateau. Manifestly, this signal plateau has not been suppressed by the application of HiLo. Indeed, HiLo imaging provides rigorous optical sectioning in the sense that it provides axial resolution of all spatial frequencies within the microscope diffraction limit (including low spatial frequencies). Standard imaging with uniform illumination cannot provide such optical sectioning, no matter what amount of Fourier filter is applied.20 A comment can also be made regarding speckle. Some residual speckle noise can be observed in our in-focus reflectance signal. This speckle presumably arises from multiple scatterers in the detection volume or sample-induced aberrations in the detection path that can lead to nonconstructive signal interference (note that the illumination path can safely be discarded as a source of speckle, owing to its side-on geometry and very low NA). On the other hand, speckle is not observed in the out-of-focus background, since this arises from laser light that has been temporally decorrelated with beam scanning. Finally, we provide an overlay of dark-field and fluorescence HiLo stacks, encoded respectively in the red and green channels. The stacks in this case cover a full millimeter depth range with a frame separation of about . Coplanarity of the light sheet and focal plane was ensured throughout the stack by automatic light-sheet tracking. Figures 5, 5, 5 are individual frames selected from this stack at increasing depths. Video 1 depicts the zero inclination frame from a 3-D rendition of the entire stack obtained by maximum intensity projection. The resolution in this image was limited by the camera pixel size, but also by blurring due to scattering and aberrations, which became exacerbated at larger depths. Despite the incidence of blurring, considerable detail is revealed in this image. The total acquisition time for each full stack was only (including overhead due to the CCD camera readout time), further illustrating the potential of light-sheet microscopy for fast volumetric imaging of neuronal networks in large-scale tissue structures. As we have demonstrated here, this potential can be bolstered by the combination of light-sheet microscopy with HiLo microscopy. Fig. 5Combined fluorescence (green) and dark-field (red) HiLo images of the hippocampus region of a whole thy-1 mouse brain (same sample as in Fig. 3). (a), (b), and (c) are frames acquired from various depths within an image stack. The field of view is . The laser power was 1 and for fluorescence and dark-field imaging, respectively. The camera exposure time was per frame. 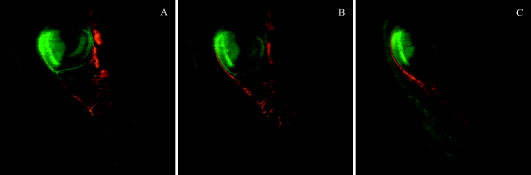 Maximum intensity projection of the entire stack of combined fluorescence (green) and dark-field (red) HiLo images of the hippocampus region of a whole thy-1 mouse brain (same data as in Fig. 5). The stack spans a depth range with an interframe separation of , and is presented as a 3-D projection (MP4, ). .  AcknowledgmentsWe thank Jeff Magee, Doug Murphy, John Macklin, and Tim Harris for technical help, scientific discussion, and support; and Kengyeh Chu and Daryl Lim for critical readings of this work. ReferencesHandbook of Biological Confocal Microscopy, 3rd. ed.Springer, Berlin
(2006). Google Scholar
H. Siedentopf and
R. Zsigmondy,
“Über sichtbarmachung und groessenbestimmung ultramikroskopischer teilchen, mit besonderer anwendung auf goldrubinglaesern,”
Ann. Phys., 10 1
–39
(1903). 0003-3804 Google Scholar
A. H. Voie,
D. H. Burns, and
F. A. Spelman,
“Orthogonal-plane fluorescence optical sectioning: three dimensional imaging of macroscopic biological specimens,”
J. Microsc., 170 229
–236
(1993). 0022-2720 Google Scholar
H. U. Dodt,
U. Leischner,
A. Shierloh,
N. Jahrling,
C. P. Mauch,
K. Deininger,
J. M. Deussing, and
M. Eder,
“Ultramicroscopy: three dimensional visualization of neuronal networks in the whole mouse brain,”
Nat. Methods, 4 331
–336
(2007). https://doi.org/10.1038/nmeth1036 1548-7091 Google Scholar
J. A. N. Buytaert and
J. J. J. Dirckx,
“Design and quantitative resolution measurements of an optical virtual sectioning three-dimensional imaging technique for biomedical specimens, featuring two-micrometer slicing resolution,”
J. Biomed. Opt., 12 014039
(2007). https://doi.org/10.1117/1.2671712 1083-3668 Google Scholar
E. Fuchs,
J. S. Jaffe,
R. A. Long, and
F. Azam,
“Thin laser light sheet microscope for microbial oceanography,”
Opt. Express, 10 145
–154
(2002). 1094-4087 Google Scholar
J. Huisken,
J. Swoger,
F. Del Bene,
J. Wittbrodt, and
E. H. Stelzer,
“Optical sectioning deep inside live embryos by selective plane illumination microscopy,”
Science, 305 1007
–1009
(2004). https://doi.org/10.1126/science.1100035 0036-8075 Google Scholar
P. J. Keller,
A. Schmidt,
J. Wittbrodt, and
E. H. K. Stelzer,
“Reconstruction of zebrafish early embryonic development by scanned light sheet microscopy,”
Science, 322 1065
–1069
(2008). https://doi.org/10.1126/science.1162493 0036-8075 Google Scholar
P. A. Santi,
S. B. Johnson,
M. Hillenbrand,
P. Z. GrandPre,
T. J. Glass, and
J. R. Leger,
“Thin-sheet laser imaging microscopy for optical sectioning of thick tissues,”
BioTechniques, 46 287
–294
(2009). 0736-6205 Google Scholar
T. F. Holekamp,
D. Turaga, and
T. E. Holy,
“Fast three-dimensional fluorescence imaging of activity in neural populations by objective-coupled planar illumination microscopy,”
Neuron, 57 661
–672
(2008). https://doi.org/10.1016/j.neuron.2008.01.011 0896-6273 Google Scholar
M. Tokunaga,
N. Imamoto, and
K. Sakata-Sogawa,
“Highly inclined thin illumination enables clear single molecule imaging in cells,”
Nat. Methods, 5 159
–161
(2008). https://doi.org/10.1038/nmeth1171 1548-7091 Google Scholar
C. Dunsby,
“Optically sectioned imaging by oblique plane microscopy,”
Opt. Express, 16 20306
(2008). https://doi.org/10.1364/OE.16.020306 1094-4087 Google Scholar
M. A. A. Neil,
R. Juškaitis, and
T. Wilson,
“Method of obtaining optical sectioning by using structured light in a conventional microscope,”
Opt. Lett., 22 1905
–1907
(1997). https://doi.org/10.1364/OL.22.001905 0146-9592 Google Scholar
T. Breuninger,
K. Greger, and
E. H. K. Stelzer,
“Lateral modulation boosts image quality in single plane illumination fluorescence microscopy,”
Opt. Lett., 32 1938
–1940
(2007). https://doi.org/10.1364/OL.32.001938 0146-9592 Google Scholar
D. Lim,
K. K. Chu, and
J. Mertz,
“Wide-field fluorescence sectioning with hybrid speckle and uniform-illumination microscopy,”
Opt. Lett., 33 1819
–1821
(2008). https://doi.org/10.1364/OL.33.001819 0146-9592 Google Scholar
S. Santos,
K. K. Chu,
D. Lim,
N. Bozinovic,
T. N. Ford,
C. Hourtoule,
A. C. Bartoo,
S. K. Singh, and
J. Mertz,
“Optically sectioned fluorescence endomicroscopy with hybrid-illumination imaging through a flexible fiber bundle,”
J. Biomed. Opt., 14 030502
(2009). https://doi.org/10.1117/1.3130266 1083-3668 Google Scholar
P. A. Stokseth,
“Properties of a defocused optical system,”
J. Opt. Soc. Am. A, 59 1314
–1321
(1969). https://doi.org/10.1364/JOSA.59.001314 0740-3232 Google Scholar
I. Navarro-Quiroga,
R. Chittajallu,
V. Gallo, and
T. F. Haydar,
“Long-term, selective gene expression in developing and adult hippocampal pyramidal neurons using focal in utero electroporation,”
J. Neurosci., 27 5007
–5011
(2007). https://doi.org/10.1523/JNEUROSCI.0867-07.2007 0270-6474 Google Scholar
G. Feng,
R. H. Mellor,
M. Bernstein,
C. Keller-Peck,
Q. T. Nguyen,
M. Wallace,
J. M. Nerbonne,
J. W. Lichtman, and
J. R. Sanes,
“Imaging neuronal subjects in transgenic mice expressing multiple spectral variants of GFP,”
Neuron, 28 41
–51
(2000). https://doi.org/10.1016/S0896-6273(00)00084-2 0896-6273 Google Scholar
J. Mertz, Introduction to Optical Microscopy, Roberts and Co., Boulder, CO
(2009). Google Scholar
|


