|
|
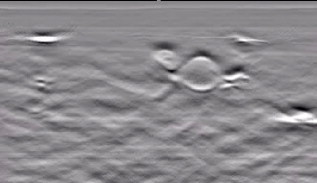
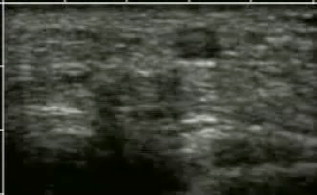
1.IntroductionFifteen years after pioneering works that defined basic principles of this technology,1, 2 optoacoustic (OA) imaging emerges as a useful modality for a variety of clinical and biological applications.3, 4 The most important applications of OA imaging are enabled by its capability to visualize blood vasculature5 or regions of enhanced optical absorption, usually associated with an increased density of microscopic blood vessels6, 7, 8 or the presence of exogenous optical contrast agents.9 OA imaging is based on tomographic reconstruction using measured transient ultrasonic signals.10, 11, 12, 13 Therefore, OA imaging can be naturally combined with ultrasound imaging5, 14 (USI). However, while USI is effectively operated at video frame rates and higher, the development of a real-time laser OA imaging system (LOIS) is impeded by the required intense data processing and image reconstruction algorithms.3 Despite these challenges, there have been reports of real-time OA systems for both preclinical and clinical applications. Zemp 15 recently reported a preclinical system capable of displaying images at rates near that was used to visualize the beating heart of a mouse. In the clinical system development, Niederhauser 5 described a 64-channel real-time OA system that was capable of displaying images at a rate of , while Kolkman 16 recently showed images acquired from an real-time OA system based on a commercially available ultrasound system. In both of these works, the enhanced contrast of blood vessels was evident, as was the ability to track vessels in real time to see bifurcations. However, the results do not show images of the larger forearm vessels (i.e., the ulnar and radial arteries) that are deeper in tissue, and the images appear to lack sufficient sharpness of the vessel boundaries to provide medical personnel with accurate vessel measurements. These shortcomings may limit the effectiveness when used in certain clinical applications. Preoperative mapping of the forearm to evaluate vessels before attempting hemodialysis access for end-stage renal disease is a relevant clinical application that would benefit from the high-contrast real-time OA imaging. The National Kidney Foundation Dialysis Outcomes Quality Initiative guidelines17 recommend that physicians attempt to perform hemodialysis by using the native arteriovenous (AV) fistula in the wrist (radial-cephalic) or elbow (brachial-cephalic) due to the low complication and high patency rates associated with these sites. If neither of these sites are deemed appropriate, implanting a synthetic AV graft is recommended.17 Several groups have explored using ultrasound for preoperative evaluation of the forearm vessels.18, 19, 20 Several key parameters to consider for the veins include diameter20 [ Ref. 18], compressibility, and vessel continuity from distal to proximal portions of the arm.20 Suitable vessels can be mapped using skin markings for the surgical procedure.20 The radial artery evaluation includes measuring flow,18 pressure,20 and vessel anatomy.20 If the radial artery is not of sufficient size [ Ref. 18] or lacks appropriate flow, the ulnar or brachial arteries can be examined to provide arterial inflow.18, 20 In this paper, we present the developed LOIS that utilizes a commercial linear ultrasonic probe. We demonstrate real-time OA imaging capabilities by visualizing blood vessels on the forearm of a human volunteer and compare the findings to control ultrasound imaging results. 2.System DescriptionThe developed LOIS consists of the optical unit, acoustic probe, data acquisition, and visualization systems. The optical unit has a -switched Nd:YAG laser (Brilliant B, Big Sky Laser/Quantel, Bozeman, Montana ) emitting pulses (maximum /pulse) at . The laser pulse repetition rate of defines the maximum frame rate of the OA images. The output laser beam is coupled into the randomized fiber bundle (Fiberoptics Technology, Inc., Pomfret, Connecticut) bifurcating into two rectangular beams . The maximum output laser fluence is limited to in accordance with the ANSI safety standard.21 The rectangular terminals of the fiber bundle are attached on both sides of the commercial ultrasound (US) probe (L3-8/40EP, Prosonic, Gyeongbuk, Korea ) and acoustically isolated using porous polyurethane (Fig. 1 ). The probe contains a linear acoustic array of 128 rectangular elements focused at in elevation with an acoustic lens. Each transducer has a central frequency of about and a fractional bandwidth of about 75%. Acoustic contact with the interrogated medium is provided through a light-scattering buffer (about thick) that is used to minimize the impact of back-scattered light absorbed by the transducers and probe housing. The light-scattering buffer is made of suspended in the silicone elastomer material (Sylgard 184, DowCorning, Midland, Michigan ) to a mass fraction of 2%. The probe elements are connected to 128 channels of our two-stage custom-made amplifier designed to respond to the wide bandwidth of the OA signals. Each stage had a built-in time-gain control for flexible manipulation of the dynamic range of the recorded OA signals. The amplifier allows overall system gain to be within a range, with 90% of the gain change achieved in . The amplifier is followed by 128 channels of our custom-made analog-to-digital converter (ADC) boards based on ADCs (AD9042, Analog Devices, Norwood, Massachusetts ). The ADC boards digitized OA signals with a sampling rate up to and output them for processing and image reconstruction by packets of 512, 1024, or 1536 samples. In this work, we used a fixed amplifier gain of , a sampling rate, and a data packet of 1536 samples. The data acquisition system communicates with a PC through the Ethernet interface and is controlled by a field-programmable gate array (Stratix II, Altera, San Jose, California ). The PC-based real-time visualization of OA images is performed by custom-made LOIS-XP software. The reconstruction of OA images is achieved using 2-D filtered radial back projection of processed OA signals.11, 12 The signal processing involves a five-scaled high-frequency wavelet transform based on the third derivative of the Gaussian wavelet, which reduces low-frequency artifacts and highlights typical -shaped optoacoustic waveforms.6 OA images can be displayed with a field of view at a frame rate. For each laser flash, the data set collected from all the transducers is saved into a file. Individual files were later combined to make a video of the tests. The imaging region was identical to that visualized during a regular USI procedure using a linear array probe that has a aperture and center frequency of (L-10, Acuson, Mountain View, California ) attached to a commercial US system (Acuson 128 XP-10, Mountain View, California ). Therefore, OA and US images of corresponding tissue structures could be visually compared. 3.ResultsTo demonstrate the ability of LOIS to locate and trace human vasculature we imaged blood vessels in two separate experiments using the forearm of one of the authors. Figure 2 shows a schematic of the experiments. The first test examined cross sections of the ulnar and radial arteries in the region of the wrist [Fig. 2]. The letters a to d on the schematic indicate the locations of the results shown in Figs. 3 and 4 . For this test, the OA images were displayed within to match the fixed field of view of the ultrasound images. The cross section of the ulnar artery was initially located near the wrist [Fig. 3]. In this work, the arteries were differentiated from veins by observing the pulsations associated with arterial blood flow. A vein running along the left side of the ulnar artery is visible, as are other smaller vessels. From this location, the probe was rotated to visualize the artery in a long axis view [Fig. 3]. The probe was moved back to visualize the ulnar artery in cross section, then the radial artery was located by slowly moving the OA field of view across the wrist [Figs. 3 and 3]. A small vessel close to the skin surface is clearly visible in Fig. 3. This vein is most likely a branch off the cephalic vein seen near the wrist in Fig. 2. Figure 3 provides a clear view of the radial artery in cross axis, along with two veins running parallel to the artery on each side. The individual frames of the USI data corresponding to the manipulations already described are shown in Fig. 4. Videos 1 and 2 show real-time tracking of the wrist vessels using OA and US imaging, respectively. Fig. 2Schematic showing the scanning locations for the two experiments. (a) Regions scanned for the first test. The first test involved visualizing the vessels of the wrist while sliding the probe from the ulnar artery to the radial artery. The letters a to d indicate location of images shown in Figs. 3 and 4. (b) Region investigated during the second test. The second test was performed to track the path of the cephalic vein by connecting the probe to a translational stage and scanning in the proximal direction of the forearm for a distance of starting at the wrist. 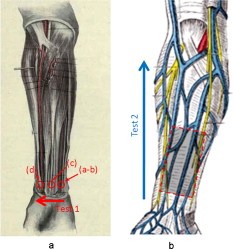 Fig. 3OA images of the wrist vessels acquired in real-time during test 1: the ulnar artery in (a) a cross axis view and (b) a long axis view, (c) a vein near the surface, and (d) the radial artery. 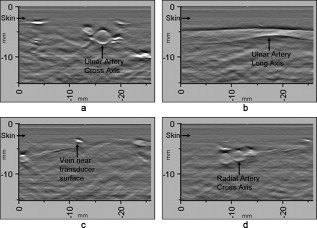 Fig. 4US images acquired using probe manipulations identical to those yielding OA images shown in Fig. 3: (a) cross axis and (b) long axis views of the ulnar artery, (c) view of a vein in the midwrist region, and (d) the radial artery in cross axis view.  During the second test [Fig. 2], the forearm of a volunteer was submerged in water. The probe was fixed on a translational stage few millimeters above the arm surface with the imaging plane orthogonal to the long axis of the arm. The translational stage was used to scan the probe along the arm with steps while acquiring OA data. This scan region is denoted in Fig. 2 by the red dashed line and shaded region. Knowing the position of each recorded frame enabled us to reconstruct a 3-D OA image of the forearm acquired in the OA mode [Fig. 5 ]. Several branches of the cephalic vein are clearly seen in the 3-D image running under the skin at a depth of [Fig. 5]. Video 3 shows the reconstructed OA volume rotating about the vertical axis, helping us to better understand the spatial orientation of the blood vessels. Fig. 5(a) OA 3-D volume that showing spatial orientation of the branches of the cephalic vein. The images used to generate the volume were obtained during test 2, and the resulting volume corresponds to the area depicted in the Fig. 2. (b) A single slice of the 3-D volume taken at the position indicated by the dashed line in (a). The slice clarifies location of the veins under the skin. 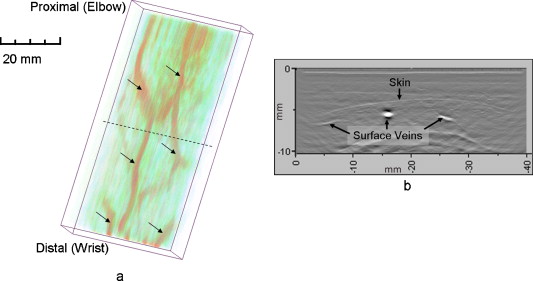 Video 3Three-dimensional optoacoustic image showing superficial vascular network of a human forearm (QuickTime 1.2 MB).  We also recorded a video (at ) showing the cross section of a beating ulnar artery (Video 4 ). A frame-by-frame analysis enabled us to estimate the change of the size of the ulnar artery as a function of time. Figures 6 and 6 show two exemplary frames (frame 59 and frame 60 out of 129, respectively), with the ulnar artery changing its size from a local minimum to a local maximum, representing half of a single beat. Figure 6 shows image intensity profiles corresponding to the vertical lines that pass through the middle of the artery in both frames. Characteristic extrema of the profiles, corresponding to the front and rear boundaries of the ulnar artery are labeled. Figure 6 indicates that in those two frames, the ulnar artery was located about under the skin and changed its size (measured orthogonally to the skin) from 1.58 mm (frame 59) to (frame 60). Figure 6 shows a time line of the changing size of the ulnar artery. From this graph we estimate that the median size of the ulnar artery is [dashed horizontal line in Fig. 6], the diameter change is [ (standard deviation), ], and the average heart beat rate is about . Fig. 6Analysis of the cross section of the ulnar artery using real-time OA imaging: (a) frame 59 of Video 4, showing a small cross section of the ulnar artery; (b) frame 60 ( later) of Video 4 showing a large cross section of the ulnar artery; and (c) intensity profiles measured from the images shown in (a), solid blue line, and (b), dashed red line. The profiles explain the positions of the front (closer to the skin) and rear (farther from the skin) boundaries of the ulnar artery at those time moments. (d) Size of the ulnar artery measured as a function of time orthogonally to the skin using real-time OA imaging; the dashed red line shows median value. (Color online only.) 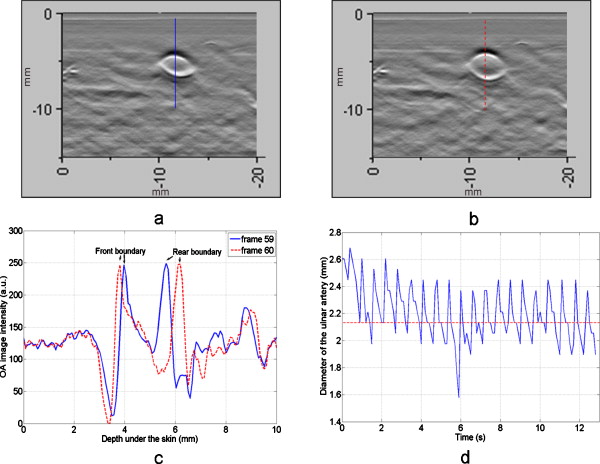 4.Discussion and ConclusionsThe ability of OA imaging to show regions of enhanced optical absorption may make it a superior imaging modality for mapping vascular structures. We showed an ability to clearly visualize the main vascular structure in the forearm in real-time 2-D slices and in a reconstructed volume that showed a more complete view of the vascular network. In comparison to the US imaging of the same region of a forearm, the OA images of the blood vessels had much higher contrast and level of detail (compare Figs. 3 and 4), which eventually enabled us to visualize the investigated vascular network as a 3-D volume [Fig. 5] and evaluate the size of the ulnar artery in real time (Fig. 6). The real-time aspect of the system also improved our ability to localize, evaluate, and track the vessels of interest (Video 1). Several clinical applications could benefit from the enhanced accurate real-time visualization of the vessels that result from our system. Volumes similar to that presented in Fig. 5 could be used during surgical planning by providing the medical staff with a spatial map of the vessels in the region of interest. Evaluation of the blood vessel cross sections and their spatial orientation is essential for the appropriate establishment of the hemodialysis access.18, 20 If combined with the Doppler US, real-time information on the change of the blood vessel cross section provided by LOIS could be used in estimation of the instantaneous local blood flow rates. Such data would be useful in tests aimed to estimate the physiological response of the peripheral circulatory system to different types of stress, such as thermoregulatory mechanisms,22 and the vascular effects of the drugs.23, 24, 25 It can also be utilized in diagnosing of local ischemia.26 Interestingly, the profile of variations in arterial diameter [Fig. 6] clearly indicates a cyclical increase and decrease in blood volume that likely reflects the pulsatile nature of arterial blood flow during systole and diastole. This suggests that a real-time OA system can potentially be used, similarly to photoplethysmography, for monitoring arterial blood flow during the cardiac cycle and for characterizing properties of vascular wall function, such as elasticity, endothelial function (vascular reactivity), and augmentation index.27, 28 Clinical conditions that would benefit from such analysis include atherosclerotic peripheral arterial disease, veno-occlusive disease, and venous valvular insufficiency.29, 30 A further advantage of OA imaging over plethysmography31 is that OA imaging provides localized information (with high spatial resolution) about an individual artery or vein, versus the regional information about entire vascular beds that is obtained using plethysmographic methods. The technique used in this work to differentiate veins from the arteries (observing pulsations of an arterial cross section) is limited to relatively large blood vessels, such as the visualized radial and ulnar arteries. The smaller arteries and arterioles may not exhibit detectable deformation of their cross sections during the cardiac cycle. Therefore, they would be indistinguishable from the small veins. The Doppler US can be used to identify the direction of the blood flow in a specific blood vessel. Then the blood flow directed distally would indicate that the visualized blood vessel is an artery, while the blood flow directed proximally would indicate that the visualized blood vessel is a vein. Another approach would utilize the dependence of the optical absorption of blood on the level of its oxygenation32 by toggling between several laser wavelengths during real-time OA imaging. The resultant OA images would provide blood oxygenation mapping that can be further used to differentiate venal and arterial blood. During real-time OA imaging, the pressure was applied through the probe to the arm to maintain good acoustic contact. The pressure was sufficient to deform superficial veins or even to completely collapse them. However, deeper veins still remained fully open, which can be seen in Fig. 3, showing a view of the radial artery with two satellite veins visible next to it. In this image, the veins are close to in size. One way to get around the problem of deformed superficial veins is to perform the OA imaging with a subject’s forearm submerged in water [as was done during test 2 and shown in Fig. 5]. However, using this technique so far we have been unable to reconstruct good OA images of the deeper blood vessels (such as the reported radial and ulnar arteries). One of the reasons for that could be the reduced amount of light that reaches deeper tissues in the case of OA imaging without tissue compression. When a subject’s forearm is compressed, the blood is squeezed out of the superficial vasculature, enabling light to penetrate deeper in the tissue and, therefore, produce better images of the deeper blood vessels. Currently, we are investigating real-time OA imaging in water without compression of a subject’s forearm for possible improvements in visualization of the deeper blood vessels. The special design of our LOIS probe helped reject OA artifacts, and the implemented signal processing based on the wavelet transform enabled us to improve the quality of the vasculature images (Fig. 3 and Video 1) compared to previous works.5, 16 Currently, we are investigating several system enhancements that should further improve the quality and amount of information carried by the OA images. The US probe used in this study has a relatively low fractional bandwidth (76%). Suitable commercial probes with fractional bandwidths up to 100% are available, and their integration with our system should improve the contrast of the larger vessels investigated.33 Another alternative could be a custom-made probe based on ultrawideband PVDF transducers.6, 34 The integration of ultrasonic imaging capabilities into our system would provide additional information on structural features of the visualized region. The benefits of such a combined system have been previously reported.35 AcknowledgmentsThis work was supported by grants from the National Cancer Institute (Nos. R44CA128196 and R44CA096153). The authors thank the engineering teams of Fairway Medical Technologies and Seno Medical Instruments for technical assistance. We also thank our colleagues from Endothelix (Houston, Texas) for very useful discussions. ReferencesA. A. Oraevsky,
S. L. Jacques, and
F. K. Tittel,
“Determination of tissue optical properties by piezoelectric detection of laser-induced stress waves,”
Proc. SPIE, 1882 86
–101
(1993). https://doi.org/10.1117/12.147694 0277-786X Google Scholar
A. A. Oraevsky,
S. L. Jacques,
R. O. Esenaliev, and
F. K. Tittel,
“Time-resolved optoacoustic imaging in layered biological tissues,”
Advances in Optical Imaging, 161
–165 Academic Press, New York
(1994). Google Scholar
A. A. Oraevsky and
A. A. Karabutov,
“Optoacoustic tomography,”
Biomedical Photonics Handbook, 34/31
–34/34 CRC Press, Boca Raton, FL
(2003). Google Scholar
L. V. Wang, Photoacoustic Imaging and Spectroscopy, CRC Press, New York
(2009). Google Scholar
J. J. Niederhauser,
M. Jaeger,
R. Lemor,
P. Weber, and
M. Frenz,
“Combined ultrasound and optoacoustic system for real-time high-contrast vascular imaging in vivo,”
IEEE Trans. Med. Imaging, 24
(4), 436
–440
(2005). https://doi.org/10.1109/TMI.2004.843199 0278-0062 Google Scholar
S. A. Ermilov,
T. Khamapirad,
A. Conjusteau,
M. H. Leonard,
R. Lacewell,
K. Mehta,
T. Miller, and
A. A. Oraevsky,
“Laser optoacoustic imaging system for detection of breast cancer,”
J. Biomed. Opt., 14
(2), 024007
(2009). https://doi.org/10.1117/1.3086616 1083-3668 Google Scholar
S. Manohar,
S. E. Vaartjes,
J. C. van Hespen,
J. M. Klaase,
F. M. van den Engh,
W. Steenbergen, and
T. G. van Leeuwen,
“Initial results of in vivo non-invasive cancer imaging in the human breast using near-infrared photoacoustics,”
Opt. Express, 15
(19), 12277
–12285
(2007). https://doi.org/10.1364/OE.15.012277 1094-4087 Google Scholar
X. Wang,
X. Xie,
G. Ku,
L. V. Wang, and
G. Stoica,
“Noninvasive imaging of hemoglobin concentration and oxygenation in the rat brain using high-resolution photoacoustic tomography,”
J. Biomed. Opt., 11
(2), 024015
(2006). https://doi.org/10.1117/1.2192804 1083-3668 Google Scholar
G. Ku and
L. V. Wang,
“Deeply penetrating photoacoustic tomography in biological tissues enhanced with an optical contrast agent,”
Opt. Lett., 30
(5), 507
–509
(2005). https://doi.org/10.1364/OL.30.000507 0146-9592 Google Scholar
M. A. Anastasio,
J. Zhang,
D. Modgil, and
P. J. L. Riviere,
“Application of inverse source concepts to photoacoustic tomography,”
Inverse Probl., 6 S21
(2007). https://doi.org/10.1088/0266-5611/23/6/S03 0266-5611 Google Scholar
V. G. Andreev,
A. A. Karabutov,
S. V. Solomatin,
E. V. Savateeva,
V. Aleynikov,
Y. V. Zhulina,
R. D. Fleming, and
A. A. Oraevsky,
“Optoacoustic tomography of breast cancer with arc-array transducer,”
Proc. SPIE, 3916 36
–47
(2000). https://doi.org/10.1117/12.386339 0277-786X Google Scholar
R. A. Kruger,
P. Liu,
Y. R. Fang, and
C. R. Appledorn,
“Photoacoustic ultrasound (PAUS)—reconstruction tomography,”
Med. Phys., 22
(10), 1605
–1609
(1995). https://doi.org/10.1118/1.597429 0094-2405 Google Scholar
M. Xu and
L. V. Wang,
“Universal back-projection algorithm for photoacoustic computed tomography,”
Phys. Rev. E, 71
(1), 016706
(2005). https://doi.org/10.1103/PhysRevE.71.016706 1063-651X Google Scholar
S. Y. Emelianov,
S. R. Aglyamov,
J. Shah,
S. Sethuraman,
W. G. Scott,
R. Schmitt,
M. Motamedia,
A. Karpiouk, and
A. A. Oraevsky,
“Combined ultrasound, optoacoustic and elasticity imaging,”
Proc. SPIE, 5320 101
–112
(2004). https://doi.org/10.1117/12.537155 0277-786X Google Scholar
R. J. Zemp,
L. Song,
R. Bitton,
K. K. Shung, and
L. V. Wang,
“Realtime photoacoustic microscopy of murine cardiovascular dynamics,”
Opt. Express, 16
(22), 18551
–18556
(2008). https://doi.org/10.1364/OE.16.018551 1094-4087 Google Scholar
R. G. Kolkman,
P. J. Brands,
W. Steenbergen, and
T. G. van Leeuwen,
“Real-time in vivo photoacoustic and ultrasound imaging,”
J. Biomed. Opt., 13
(5), 050510
(2008). https://doi.org/10.1117/1.3005421 1083-3668 Google Scholar
“K/DOQI clinical practice guidelines for vascular access, 2000,”
Am. J. Kidney Dis., 37
(1), S137
–S181
(2001). https://doi.org/10.1016/S0272-6386(01)70007-8 0272-6386 Google Scholar
M. L. Robbin,
M. H. Gallichio,
M. H. Deierhoi,
C. J. Young,
T. M. Weber, and
M. Allon,
“US vascular mapping before hemodialysis access placement,”
Radiology, 217
(1), 83
–88
(2000). 0033-8419 Google Scholar
M. Sedlacek,
V. Teodorescu,
A. Falk,
J. A. Vassalotti, and
J. Uribarri,
“Hemodialysis access placement with preoperative noninvasive vascular mapping: comparison between patients with and without diabetes,”
Am. J. Kidney Dis., 38
(3), 560
–564
(2001). https://doi.org/10.1053/ajkd.2001.26873 0272-6386 Google Scholar
P. J. Pappas,
Z. Jamil,
C. T. Araki,
M. C. Goldberg,
G. Gwertzman, and
F. T. Padberg Jr.,
“A strategy for increasing use of autogenous hemodialysis access procedures: impact of preoperative noninvasive evaluation,”
J. Vasc. Surg., 27
(2), 302
–308
(1998). https://doi.org/10.1016/S0741-5214(98)70360-X 0741-5214 Google Scholar
, American National Standard for Safe Use of Lasers,
(2000) Google Scholar
D. I. Sessler,
“Thermoregulatory defense mechanisms,”
Crit. Care Med., 37
(7), S203
–210
(2009). https://doi.org/10.1097/CCM.0b013e3181aa5568 0090-3493 Google Scholar
K. Chen,
R. N. Pittman, and
A. S. Popel,
“Nitric oxide in the vasculature: where does it come from and where does it go? A quantitative perspective,”
Antioxid. Redox Signal., 10
(7), 1185
–1198
(2008). https://doi.org/10.1089/ars.2007.1959 Google Scholar
N. P. Riksen,
G. A. Rongen,
D. Yellon, and
P. Smits,
“Human in vivo research on the vascular effects of adenosine,”
Eur. J. Pharmacol., 585
(2–3), 220
–227
(2008). https://doi.org/10.1016/j.ejphar.2008.01.053 0014-2999 Google Scholar
M. R. Weir,
“Beta-blockers in the treatment of hypertension: are there clinically relevant differences,”
Postgrad Med., 121
(3), 90
–98
(2009). https://doi.org/10.3810/pgm.2009.05.2007 0032-5481 Google Scholar
P. N. Suding and
S. E. Wilson,
“Strategies for management of ischemic steal syndrome,”
Semin. Vasc. Surg., 20
(3), 184
–188
(2007). https://doi.org/10.1053/j.semvascsurg.2007.07.009 Google Scholar
J. Allen,
“Photoplethysmography and its application in clinical physiological measurement,”
Physiol. Meas, 28
(3), R1
–39
(2007). https://doi.org/10.1088/0967-3334/28/3/R01 0967-3334 Google Scholar
R. J. Woodman and
G. F. Watts,
“Measurement and application of arterial stiffness in clinical research: focus on new methodologies and diabetes mellitus,”
Med. Sci. Monit., 9
(5), RA81
–89
(2003). 1234-1010 Google Scholar
M. E. Alnaeb,
N. Alobaid,
A. M. Seifalian,
D. P. Mikhailidis, and
G. Hamilton,
“Optical techniques in the assessment of peripheral arterial disease,”
Curr. Vasc. Pharmacol., 5
(1), 53
–59
(2007). https://doi.org/10.2174/157016107779317242 Google Scholar
G. Belcaro,
N. Labropoulos,
D. Christopoulos,
S. Vasdekis,
G. Laurora,
M. R. Cesarone, and
A. Nicolaides,
“Noninvasive tests in venous insufficiency,”
J. Cardiovasc. Surg. (Torino), 34
(1), 3
–11
(1993). Google Scholar
A. A. Graham,
“Plethysmography: safety, effectiveness, and clinical utility in diagnosing vascular disease,”
Health Technol. Assess (Rockv), 7 1
–46
(1996). Google Scholar
A. Roggan,
M. Friebel,
K. Dorschel,
A. Hahn, and
G. Muller,
“Optical properties of circulating human blood in the wavelength range ,”
J. Biomed. Opt., 4
(1), 36
–46
(1999). https://doi.org/10.1117/1.429919 1083-3668 Google Scholar
R. G. Kolkman,
J. H. Klaessens,
E. Hondebrink,
J. C. Hopman,
F. F. de Mul,
W. Steenbergen,
J. M. Thijssen, and
T. G. van Leeuwen,
“Photoacoustic determination of blood vessel diameter,”
Phys. Med. Biol., 49
(20), 4745
–4756
(2004). https://doi.org/10.1088/0031-9155/49/20/006 0031-9155 Google Scholar
V. G. Andreev,
A. A. Karabutov, and
A. A. Oraevsky,
“Detection of ultrawide-band ultrasound pulses in optoacoustic tomography,”
IEEE Trans. Ultrason. Ferroelectr. Freq. Control, 50
(10), 1383
–1390
(2003). https://doi.org/10.1109/TUFFC.2003.1244756 0885-3010 Google Scholar
M. Jaeger,
L. Siegenthaler,
M. Kitz, and
M. Frenz,
“Reduction of background in optoacoustic image sequences obtained under tissue deformation,”
Proc. SPIE, 7177 71770Z
(2009). https://doi.org/10.1117/12.810074 0277-786X Google Scholar
|