
|
|
1.IntroductionBy some estimates, mice and rats account for up to 95% of all laboratory animals used in biomedical testing and research.1 This includes research in the biomedical optics field, where rodents, particularly mice, are used in the development of diagnostic and therapeutic technologies. Most of these technologies aim to be noninvasive, and thus measurements are often taken directly of or through the skin. Consequently, research that either directly or indirectly involves optical measurement of mouse skin is considerable. This includes work in photodynamic therapy, 2, 3 fluorescence spectroscopy,4 in-vivo bioluminescence and fluorescence imaging,5 in-vivo monitoring of hemodynamics and tumor growth, 6, 7 skin disease research,8 in-vivo glucose monitoring, 9, 10 and pharmacokinetics.11 As in all research studies, controlling for sources of biological variability is essential. When mice are involved, this entails maintaining consistency in strain, age, and housing conditions. For this work, we explore a parameter that is rarely considered in biomedical optics: gender. The layered structure of mammalian skin consists of the epidermis, dermis, and hypodermis. The epidermis, the outer layer, is a nonvascularized stratified squamous keratinizing epithelium. In nonacral areas, especially in mice, this layer is thin (less than 20 μm). While keratin is a strong scatterer, its optical effect is minimal in our measurements, since the photon path length through the epidermis is so short. The dermal layer lies directly below the epidermis, and is composed of high levels of structural proteins, such as collagen and elastin, providing mechanical integrity and elasticity to the skin, and hair follicles in haired areas. Often referred to as the subcutaneous fat layer, the hypodermis lies beneath the dermis, and is composed primarily of adipose tissue, loose fibrous connective tissue, and larger blood vessels.12 A skeletal muscle layer, the panniculus carnosus, is usually present under the hypodermis of the mouse dorsal skin. Optically, absorption in the dermal and hypodermal layers is due to hemoglobin (both oxygenated and deoxygenated) from blood in the capillary network. Melanin also contributes to skin absorption, primarily in the epidermis and hair follicles. In the dermis, scattering is due to collagen, one of the strongest scattering structures found in soft tissue. In the hypodermis, scattering is due primarily to adipocytes. 13, 14 In the field of dermatology, it has long been known that male and female human skin differs significantly, primarily in the skin's overall thickness and the thicknesses of its constituent layers. 15, 16, 17, 18, 19, 20, 21 Differences in the thickness of the skin layers are regulated primarily by sex hormones. 18, 19, 22 The hypodermis is thicker in females than in males due to a greater number of fat cells.20 However, the overall thickness of male skin is greater than in females due to a higher concentration of collagen in the dermis, which has been shown to correlate with dermal thickness. 15, 21 Similar thickness differences have also been reported in mice, 22, 23, 24 although to a much lesser extent. These differences are likely to result in variations in the observed optical characteristics of the skin. Given the extensive involvement of mouse skin in biomedical optics research, we sought to study this important factor, and examine the mechanisms that underlie experimental variability of optical measurements due to variations in skin thickness and optical properties. Motivation for this work is the result of experimental observation during a previous study5 in which optical reflectance spectra were collected from mouse skin using elastic scattering spectroscopy (ESS). ESS is a specific implementation of reflectance spectroscopy, and is a noninvasive diagnostic method used in the optical and physiological characterization of tissue (and other turbid media). It has been widely used in the diagnosis of disease, including colon cancer,25 melanoma,26 brain tumors,27 Barrett's esophagus,28 and prostate cancer.29 As opposed to diffuse reflectance spectroscopy, ESS examines light interaction when the delivery and collection probes are separated by less than one mean-free-path length, restricting interrogation to the most superficial layers, which is generally the epithelial layer, where carcinomas originate.30 For this length scale, diffusion theory is not applicable. Preliminary ESS results from the previous study of murine skin revealed significant differences between males and females, in both spectral amplitude and shape, indicating a difference in the observed optical properties of the tissue. The implications of this observation are important for any research that involves photon travel through mouse skin. In direct study of the skin, gender differences may mask other, more subtle optical changes being investigated; and for optical measurements that are collected from subdermal areas, gender variations in absorption and scattering will directly affect the amount of signal being collected through the skin. In both cases, the result can be significant experimental error if gender differences are unaccounted for. It is important to note that the results reported in this study are specific to the ESS geometry and probe dimensions employed. Measurements taken with other geometries should exhibit different results, but it is expected that the same general trends would be observed. 2.Materials and Methods2.1.AnimalsAll animal handling and care was conducted in accordance with the Animal Care and Use Committee at Novartis Institutes for BioMedical Research, Incorporated, in Cambridge, Massachusetts. A total of 60 mice (8 weeks old) were used in this study, with equal numbers of C57Bl/6 mice, CD-1 mice (Charles River Laboratories, Wilmington Massachusetts), and athymic nude mice (Harlan, Boston, Massachusetts). For each strain, ten males and ten females were used. All mice were housed under a normal 12-h light/dark cycle, and fed ad libitum standard rodent chow. Except for the nude mice, hair was removed from the mice one day prior to experiments to reduce signal attenuation. A rectangular region of hair on the dorsal side, from the hind legs to the front legs, was first removed using an electric razor (Norelco G390, Philips, Andover, Massachusetts), and the skin was then depilated using the chemical Nair (Church and Dwight Company, Incorporated, Princeton, New Jersey). Occasional skin lesions were treated by veterinary care with triple antibiotic ointment (Taro Pharmaceuticals, Hawthorne, New York). A one-day lag was allowed for any inflammation from the hair removal process to subside. 2.2.Experimental Setup and ProtocolFigure 1 is a schematic of the elastic scattering spectroscopy system used in this study. It consists of a pulsed xenon arc lamp (Perkin Elmer LS1130-3, Waltham, Massachusetts) for the light source, a spectrometer with a linear charge-coupled device (CCD) detector (Ocean Optics S2000, Dunedin, Florida), an ADC/timer microcontroller board (TERN, Incorporated, Davis, California), and a computer interface. A fiber probe is used for delivery and collection of light; the probe used in these experiments consisted of two optical fibers with core diameters of 200 μm, numerical aperture of 0.22, and a center-to-center separation of approximately 250 μm. A single probe was used for all measurements to avoid variability. ESS spectra were collected between 400 and 750 nm. All measurements were taken while the mice were under anesthesia (2% isoflurane in oxygen). Animals were first placed in an anesthesia induction chamber with 2% isoflurane in oxygen flowing at 150 ml/min for five minutes, and then transferred to a nose cone apparatus to maintain anesthesia levels. In collecting ESS measurements, the mice were consistently probed at three separate locations on their dorsal side: over the left and right shoulder blades, and just above the right hip. To improve optical contact between the fiber probe tip and tissue, water was applied to wet the skin surface. The locations of ESS measurements were circled for coregistration with histological examination. After collecting ESS data, the mice were euthanized by cervical dislocation while under deep anesthesia. The dorsal skin (from the hind to front legs) was sampled, pinned to a corkboard, and fixed in 10% neutral buffered formalin. Skin samples from each of the probed areas were routinely processed to paraffin block, sectioned at 4 μm, and stained with hematoxylin and eosin (HE) for light microscopy examination. Each skin section was examined under light microscopy to assess the hair follicle stage. In addition, each section was scanned using a Scanscope console from Aperio (version 9.0.0.1516, Vista, California). Using the Aperio software, the thickness of the epidermis (E), epidermis plus dermis (E+D), and epidermis plus dermis plus hypodermis (E+D+H) were recorded. 2.3.Data AnalysisTo extract optical and physiological information about the tissue, the collected spectra were analyzed using a previously developed empirical reflectance model.31 Briefly, the relative reflectance [TeX:] $R_T^{{\rm REL}} ({\rm \lambda })$ is defined as the ratio of the tissue spectrum I T(λ) to the reference spectra I R(λ) taken from a spectrally flat diffuse reflector (Spectralon™, Labsphere, North Sutton, New Hampshire). To eliminate variations in the relative reflectance amplitude due to variations in the distance between the probe and the Spectralon reference (measurement taken noncontact), the spectrum is normalized using the signal at λ0 = 610 nm taken on a solid calibration phantom with known optical properties I C(λ0) (made with titanium dioxide such that [TeX:] $\mu^\prime _s$ (λ0) ∼10 cm−1). For this calibration phantom, the measurement was taken with the probe tip in contact with the phantom, using water for improved index matching. The empirical equation relating optical property values to relative reflectance values is: Eq. 1[TeX:] \documentclass[12pt]{minimal}\begin{document}\begin{eqnarray} \hspace*{-10.5pt}R_T^{{\rm REL}} (\lambda) &=& \frac{{I_T (\lambda)}}{{I_R (\lambda)}}\frac{{I_R (\lambda _0)}}{{I_C (\lambda _0)}}\nonumber\\ &=& a\mu '_s (\lambda){\rm exp}\!\left\{ {\hspace*{-1.5pt} - C_{{\rm corr}} (\lambda)\mu _a (\lambda)\frac{b}{{[C_{{\rm corr}} (\lambda)\mu _a (\lambda)\mu '_s (\lambda)]^c }}} \!\right\}\!\!,\!\!\!\!\!\!\nonumber\\ \end{eqnarray}\end{document}Eq. 2[TeX:] \documentclass[12pt]{minimal}\begin{document}\begin{equation} C_{Corr} (\lambda) = \left\{ {\frac{{1 - {\rm exp[} - 2\mu _{a,bl} (\lambda) \cdot r{\rm ]}}}{{2\mu _{a,bl} (\lambda) \cdot r}}} \right\}, \end{equation}\end{document}Eq. 3[TeX:] \documentclass[12pt]{minimal}\begin{document}\begin{equation} \begin{array}{*{20}c} {\mu '_s (\lambda) = d({\lambda ^{ - e}})} \\[4pt] {\mu _a (\lambda) = f_1 [f_2 \varepsilon _{{\rm HbO}} (\lambda) + {\rm (}1 - f_2)\varepsilon _{{\rm Hb}} (\lambda)],} \\ \end{array} \end{equation}\end{document}The collected ESS spectra were fit to Eq. 1 using a least-squares fit with a Levenberg-Marquardt algorithm, using d, e, f 1, f 2, and r as fitting parameters that were constrained to have physically meaningful values. Matlab (Math Works, Natick, Massachusetts) was used for implementation. 2.4.Monte CarloTo model the observed results, multilayer Monte Carlo simulations were performed using a program based on previous codes, 34, 35 and employed a variance reduction technique.36 The delivery and collection fibers were modeled to match the actual geometry of the probe used in the experiments. The fibers are both perpendicular to the surface of the material, and parallel to one another. Photon delivery and collection is restricted to the area of the fiber tip, and is constrained by the NA and index mismatch of the setup. Photon propagation in the medium is dictated by defined values for [TeX:] $\mu^\prime _s$ and μ a. The Henyey-Greenstein (HG) phase function is assumed.37 The index of refraction of the fibers and the medium were set to 1.45 and 1.35, respectively;38 however, variation in the refractive index of the medium between 1.34 and 1.38 caused only minor differences in results. Simulations were terminated once 10,000 photons were successfully collected by the collection fiber. 3.Results3.1.Histological Skin Thickness MeasurementsFigure 2 plots the averages of thickness values for each layer of mouse skin, as determined by histology. Data are separated by strain and gender (Gray refers to C57Bl/6 mice, and White refers to CD-1 mice), and are consistent with previous findings in mice.22 For all strains, the difference in the overall thickness of the skin between males and females is statistically significant. (Throughout this work, statistical significance was determined using the unpaired t-test, with p values less than 0.01 being considered significant.) The thickness of the dermis is the most substantial difference between genders for all three strains. Gender difference in the thickness of the hypodermis is statistically significant only for gray mice, while gender differences in epidermal thickness were not significant for any strain. As a general trend, the p values comparing gender differences are most significant for gray mice (p < 1e-8), and are least significant for nude mice (0.001 < p < 0.002), indicating that gender differences are most prominent in gray mice. Because hair follicle stage also influences skin thickness,39 we ensured that the observed thickness differences were not gender biased based on hair cycle. Microscopic assessment of skin samples demonstrated a comparable distribution of anagen, telogen, and catagen hair cycle stages between strain-matched male and female mice (see Table 1). Table 1The distribution of animals in each hair growth phase, separated by strain and gender, demonstrates that there is no gender bias based on hair growth cycle.
Fig. 2Averaged values of the epidermis, dermis, and hypodermis thicknesses as measured by histology, separated by strain and gender. Gray refers to C57Bl/6 mice, and White refers to CD-1 mice. Variation in the thickness of the dermis is the most significant difference between genders. Error bars correspond to the standard error of the mean.  3.2.Elastic Scattering Spectroscopy Reflectance Measurements and Extracted Optical PropertiesThe average ESS spectra for males and females of each strain are presented in Fig. 3. The red and blue lines represent female and male mice, respectively (color online only). The solid, dashed, and dotted curves represent gray, white, and nude mice, respectively. Note that the difference between male and female spectra is greatest for gray mice, and smallest for nude mice. This is consistent with the degree of difference between genders in the layer thickness values. Fig. 3Relative reflectance spectra of skin, averaged for each gender and strain. Differences in amplitude and shape indicate significant difference in the optical properties. 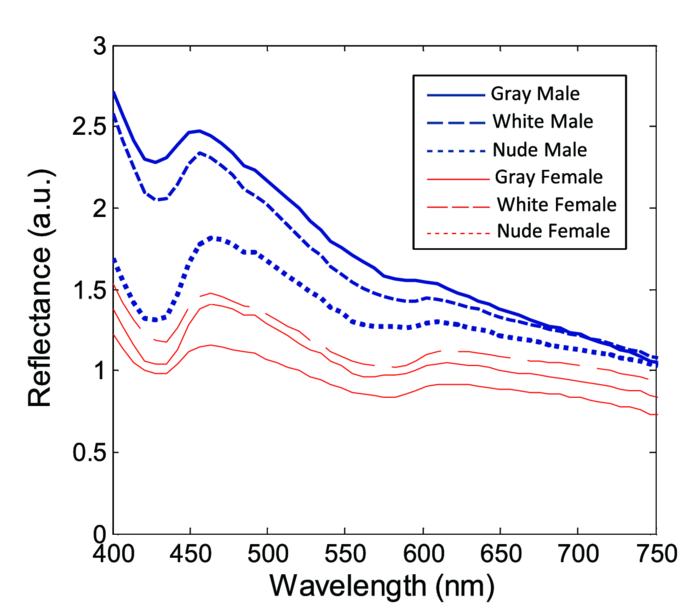 To understand the physiological differences that lead to these spectral variations, the previously described empirical model was used to calculate (from the ESS spectra) the average optical properties of the skin. Figure 4 presents the average extracted values of the reduced scattering and absorption coefficients [TeX:] $\mu^\prime _s$ and μ a, along with the measured relative reflectance values [ [TeX:] $R_T^{{\rm REL}} ({\rm \lambda })$ ]. These values are reported at the wavelength λ = 550 nm, which falls within the hemoglobin absorption q-bands. Note that because the reduced scattering coefficient [TeX:] $\mu^\prime _s$ is linearly proportional to relative reflectance,31 the scattering coefficient and reflectance values follow similar trends. Fig. 4Averaged values of the measured reflectance, and calculated scattering and absorption coefficients, separated by strain and gender at the wavelength 550 nm. Scattering and reflectance values are the most significant gender differences; gender difference in absorption is moderate. Error bars correspond to the standard error of the mean.  The gender differences in reflectance and scattering values are significant for all three strains, with gray mice showing the greatest significance (p < 2e-10). We posit that this difference is due to the larger dermal thickness in males as compared to females; an increase in dermal thickness increases the photon path length in the dermis, and decreases the path length in the hypodermis and structural muscle layers (assuming similar total path lengths and penetration depths). The total collected reflectance signal is thus composed of a larger contribution from the dermis, and the observed average scattering coefficient is weighted more heavily by the optical properties of that layer. Given the strong scattering properties of collagen in the dermis, this leads to higher reflectance and scattering coefficient values. In terms of the fitting parameters in Eq. 3, the increase in reduced scattering coefficient is due to an average 81% increase in the value of c, and an average 24% increase in the value of d in males as compared to females. For the absorption coefficient values, strong statistical significance was observed only in gray mice (p = 1e-7), while the gender differences for white and nude mice were marginal (p = 0.019 and p = 0.0043, respectively). The increase in absorption observed in females is due to an average 28% increase in blood volume fraction (f 1) compared to males, as determined from the spectral analysis. We deduce that this is from increased blood profusion in either the hypodermis fat layer, the subjacent structural muscle layer, or both, as compared to the dermis. With an increased proportion of the path length lying in the hypodermis and muscle layers, increased hemoglobin/myoglobin absorption in these deeper layers results in slightly higher absorption coefficient values as compared to males. However, we emphasize that this effect is small; the strongest source of signal variation is due to differences in scattering. To better visualize the relationship of dermal thickness and observed optical properties, scatter plots are presented in Fig. 5. Because gray mice were observed to have the greatest gender differences in both thickness values and optical properties, we use their data to illustrate these relationships. In both plots of Fig. 5, the data points of males and females are well separable. The positive correlation between dermal thickness and scattering, and the negative correlation between dermal thickness and absorption in Figs. 5a and 5b, respectively, support the previous conclusions that measured scattering and absorption values are a function of the thickness of the dermis. The relationships between hypodermis thickness and optical properties (not shown) were not found to have a strong correlation, indicating that the thickness of the hypodermis does not significantly impact reflectance signal variations. Additionally, relationships between the total skin thickness (epidermis + dermis +hypodermis) and optical properties (not shown) reveal very similar trends to those in Fig. 5, confirming that the dominant variable is the thickness of the dermis as opposed to the hypodermis. It also suggests that variation in photon path length in the muscle layer does not greatly contribute to reflectance variation for the fiber probe geometry used here. Fig. 5Scatter plots relating dermal thickness to observed scattering and absorption coefficients for gray mice at the wavelength 550 nm. Male and female data points are well separable and illustrate (a) positive correlation between dermis thickness and reduced scattering coefficient and (b) negative correlation between dermis thickness and absorption coefficient. 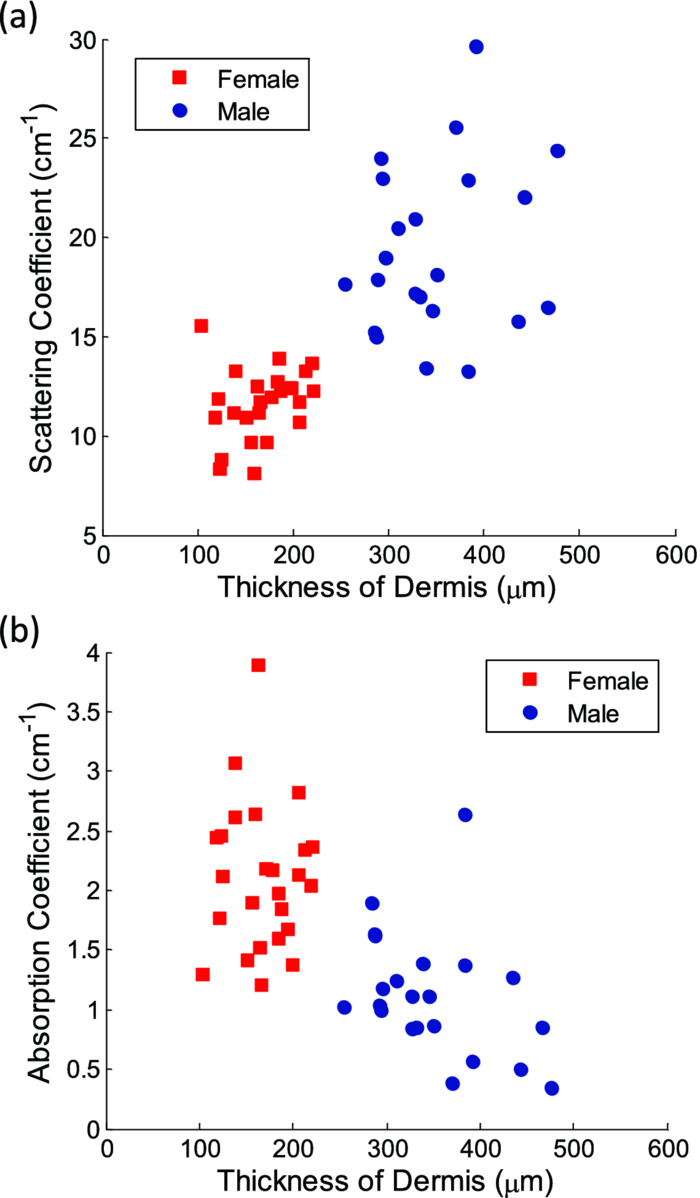 3.3.Monte Carlo SimulationsMonte Carlo simulations were run to further validate our conclusions concerning the mechanisms underlying gender variations in ESS reflectance signals. The tissue structure was modeled with three layers. The top layer represents the combined epidermis and dermis. Because of its small thickness, and thus minimal optical contribution, the epidermis is grouped with the dermis. Further, the optical properties in the epidermis have been reported to be similar to those in the dermis.40 The middle layer represents the hypodermis fat layer, and the bottom layer represents the muscle below the skin. Thickness values for the dermis and hypodermis layers were chosen to cover the range of values observed in histology (Fig. 2), while the muscle layer was modeled to be semi-infinite. For dermal thickness, five values were chosen: 200, 250, 300, 350, and 400 μm. For each dermis thickness value, four values of hypodermis thickness were chosen: 100, 150, 200, and 250 μm. This resulted in a set of 20 simulations. Six additional simulations were also run, corresponding to the average dermis and hypodermis thickness values observed in males and females of each strain (Fig. 2). Unfortunately, representative optical property values could not be obtained from the literature because there are few sources that report on the optical properties of mouse skin, 41, 42 and none that report on the separate property values for the individual layers of skin. While the optical properties of skin layers in humans cannot be directly assumed for mice, these values were used as guidelines in defining the relative differences among layers. 13, 40, 43, 44, 45 Hence, optical property values at the wavelength 550 nm were defined for each of the layers as: μ a = 2, 3, and 3 cm−1, and [TeX:] $\mu^\prime _s$ = 27, 14, and 7.5 cm−1, for the dermis, hypodermis, and muscle layers, respectively. Note that for our purpose of observing reflectance trends, the actual values of the properties are less important than the relative differences between them. Figure 6 illustrates the results of the simulations in a plot relating the total thickness of the skin (dermis + hypodermis) to reflectance values. The data are separated into five sets, each representing a different dermal thickness. For each of these sets, the data points from left to right on each curve represent different hypodermis thickness values, from smallest (100 μm) to largest (250 μm). The reflectance values from the simulations representing the males and females in this study are also plotted, illustrating a similar gender separation as observed in Fig. 5a. Confirming experimental conclusions, the primary variable in the determination of reflectance is shown to be the thickness of the dermis. Conversely, the thickness of the hypodermis plays only a minor role; for each dermis thickness, an increase in hypodermis thickness produces only a marginal increase in reflectance. This increase is the result of the hypodermis having a higher scattering coefficient value than the muscle layer. The effects of absorption on the simulations were also examined by performing the simulations with different absorption coefficient values. Changes in absorption coefficient values of up to 50% in the hypodermis and subjacent skeletal muscle layers did not result in significant changes to reflectance, supporting the minimal correlation between absorption coefficient and layer thickness observed experimentally. It should be noted that all of these parametric dependences of reflectance on skin layer properties are specific to the optical geometry described here. Results are likely to change for different fiber separation, NA, angle of incidence, etc., but the general trends are expected to hold. Fig. 6Monte Carlo simulation data: reflectance versus total skin thickness (dermis+hypodermis). Data are separated into five sets, each representing a different dermal thickness. For each set, the data points from left to right on each curve represent different hypodermis thicknesses, from 100 to 250 μm. Representative reduced scattering and absorption coefficients at 550 nm for each skin layer were used in the simulations. Reflectance values from the simulations representing the male and female geometries measured experimentally are plotted as triangles and squares, respectively. Results show that dermal thickness impacts reflectance much more than hypodermal thickness.  Figure 7 illustrates the percentage of the path length traveling through each layer of the skin as the dermal thickness increases. This plot indicates that more than 60% of the photon path length occurs in the dermis, while path lengths through the hypodermis and muscle layers each account for less than 20%. These data assume a constant hypodermal thickness of 200 μm; variations in hypodermis thickness result in minimal differences to the plot. Because the signal contribution from the dermal layer is so much larger, changes in its thickness are much more influential than changes in hypodermis thickness. This clarifies why dermal thickness plays such a dominant role in the variation of reflectance. In comparing the percentage path length values for the simulations representing male and female geometries in our experimental study, an average increase in dermal path length percentage from 67% in females to 88% in males results in an average reflectance increase of 40%. An alternative approach to conceptualizing these results is to consider the hypodermis and muscle layers as a “photon-sink.” Once a photon reaches the hypodermis, it experiences much less scattering because of the lower scattering coefficient values of the subdermal layers. Consequently, it has a low enough probability of scattering to reverse the direction back toward the collection probe before it is absorbed. Fig. 7The percentage of photon path length in each layer. More than 60% of the path length resides in the dermis, and increases to more than 90% as its thickness increases. This large contribution causes small changes in the dermis geometry to result in more drastic reflectance differences than would occur for layers with less percentage path lengths. Representative reduced scattering and absorption coefficients at 550 nm for each skin layer were used in the simulations along with a hypodermal thickness of 200 μm. 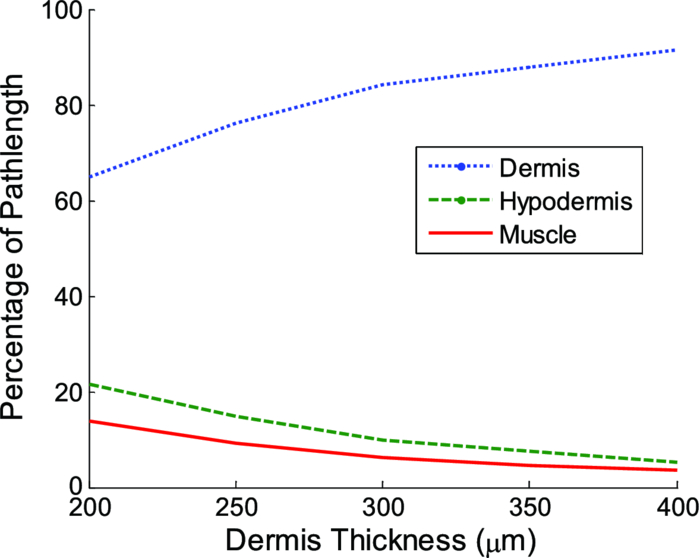 4.DiscussionIn this work, experimental variation in optical measurements from the skin of mice was examined as a function of gender. However, other factors such as location on the body, age, hydration level, and hair growth phase have also been reported as factors influencing skin thickness. 39, 46, 47, 48 These additional factors likely contributed to the experimental variability observed in our study, but were likely less significant than layer thickness differences; as was presented in the results, the influence of hair growth phase was specifically investigated to ensure that there was no gender bias based on hair cycle. It is also important to consider that gender differences in the skin may not be limited to changes in geometrical thickness. Variations in the physical and optical properties of the skin are possible, and would also result in measurement variability, independent of layer thickness. Some factors that would alter the optical properties of the skin include variation in collagen density,15 larger sebaceous gland size in males,23 and variations in blood volume based on vasoconstriction, vasodilatation, or opening of reserve capillaries, all in response to various stimuli (e.g., heat, cold, irritation, exercise, hypotension, etc.). However, as demonstrated in the Monte Carlo simulations, variation in layer thickness is more influential than variation in optical property values. These confounding factors highlight the challenges involved in biological measurements, and underscore the importance of proper experimental controls; even unlikely factors can result in measurement variability, which may be significant enough to obscure desired information. While the trends observed here are likely to be observed in other optical applications, the degree of observed optical variation will differ depending on measurement geometry. In general, variations will be considerable when a significant percentage of the path length is in the skin, and when the optical path travels through multiple layers. These conditions are often achieved when measurements are taken in the reflection geometry with diffuse illumination. Alternatively, in applications such as fluorescence spectroscopy and bioluminescence imaging, in cases where the source of collected light is deeper in the tissue, the skin only accounts for a small percentage of the total optical path length. In this case, differences in dermal thickness will have much less impact on the collected signal than other variables. Given the probe geometry used in this study, little gender variation would be expected in measurements of human skin, since the combined thickness of the epidermis and dermis is much thicker than in mice, and thus very little, if any, of the optical signal will be collected from a secondary layer. It is plausible, however, that gender variations would be significant when probes are used that have larger source detection separations, and signal penetration is deeper. Aside from identifying the importance of gender in optical measurement variability in mouse skin, these results highlight the more general concern of optical measurement variation in any layered tissue. When identifying epithelial disease, for example, differences in spectra are considered to be the result of variation in the local optical properties due to histological changes at the cellular level. However, if layer thicknesses are not consistent among samples, large spectral changes may be the result of geometry changes, and differences in observed optical properties would be based on path length variations, and not necessarily disease. Thus, in layered tissues, it is important to distinguish microscopic changes based on disease from macroscopic changes based on structure. 5.ConclusionIn this work, we identify gender as a significant source of variation in optical reflectance measurements of mouse skin, and illustrate that variation in the thickness of the dermal layer is the key explanatory variable. For three strains of mice, the thickness values of the epidermis, dermis, and hypodermis layers, as measured by histology, are correlated to optical reflectance measurements collected with elastic scattering spectroscopy (ESS). Males are found to have significantly thicker dermal layers, resulting in increases of up to 80% in reflectance as compared to females. As a result, collagen in the dermis is identified as the source of these differences due to its strong scattering properties. It is concluded that increased dermal thickness results in longer photon path lengths through the collagen, which produces a larger scattering signal. A small increase in the observed absorption coefficient in females is also observed, resulting from a longer path length in the lower layers, and a presumed greater blood volume fraction in the hypodermis and/or subdermal muscle layers. Monte Carlo simulations that model thickness changes in a layered structure support our conclusions. These results emphasize the importance of considering gender during experimental design of any study that involves photon interaction with mouse skin. They also emphasize the significant impact that relatively small thickness changes can have on observed optical measurements in layered tissues. AcknowledgmentsThis work was supported in part by the Boston University Photonics Center and the CIMIT consortium. ReferencesF. L. Trull and
B. A. Rich,
“More regulation of rodents,”
Science, 284 1463
(1999). https://doi.org/10.1126/science.284.5419.1463 Google Scholar
M. A. Middelkamp-Hup, I. Sánchez-Carpintero, S. Kossodo, P. Waterman, S. González, M. C. Mihm Jr., and R. R. Anderson,
“Photodynamic therapy for cutaneous proliferative vascular tumors in a mouse model,”
J. Invest. Dermatol., 121 634
–639
(2003). https://doi.org/10.1046/j.1523-1747.2003.12412.x Google Scholar
D. Robinson, H. S. de Bruijn, N. Van Der Veen, M. R. Stringer, S. B. Brown, and
W. M. Star,
“Protoporphryin IX fluorescence photobleaching during ALA-mediated photodynamic therapy of UVB-induced tumors in hairless mouse skin,”
Photochem. Photobiol., 69 61
–70
(1999). https://doi.org/10.1111/j.1751-1097.1999.tb05307.x Google Scholar
D. S. Gareau, P. R. Bargo, W. A. Horton, and
S. L. Jacques,
“Confocal fluorescence spectroscopy of subcutaneous cartilage expressing green fluorescent protein versus cutaneous collagen autofluorescence,”
J. Biomed. Opt., 9
(2), 254
–258
(2004). https://doi.org/10.1117/1.1645798 Google Scholar
A. Curtis, K. W. Calabro, J. Galarneau, I. J. Bigio, and
T. Krucker,
“Temporal variations of skin pigmentation in C57Bl/6 mice affect optical bioluminescence quantitation,”
Mol. Imaging. Biol.,
(2010) Google Scholar
M. Xia, V. Kodibagkar, H. Liu, and
R. P. Mason,
“Tumor oxygen dynamics measured simultaneously by near-infrared spectroscopy and 19F magnetic resonance imaging in rats,”
Phys. Med. Biol., 51 45
–60
(2006). https://doi.org/10.1088/0031-9155/51/1/004 Google Scholar
G. M. Palmer, R. J. Viola, T. Schroeder, P. S. Yarmolenko, M. W. Dewhirst, and
N. Ramanujam,
“Quantitative diffuse reflectance and fluorescence spectroscopy: tool to monitor tumor physiology in vivo,”
J. Biomed. Opt., 14
(2), 024010
(2009). https://doi.org/10.1117/1.3103586 Google Scholar
M. Amouroux, G Díaz-Ayil, W. C. P. M. Blondel, G. Bourg-Heckly, A. Leroux, and
F. Guillemin,
“Classification of ultraviolet irradiated mouse skin histological stages by bimodal spectroscopy: multiple excitation autofluorescence and diffuse reflectance,”
J. Biomed. Opt., 14
(1), 014011
(2009). https://doi.org/10.1117/1.3077194 Google Scholar
M. Kinnunen, R. Myllylä, and
S. Vainio,
“Detecting glucose-induced changes in in vitro and in vivo experiments with optical coherence tomography,”
J. Biomed. Opt., 13
(2), 021111
(2008). https://doi.org/10.1117/1.2904957 Google Scholar
Handbook of Optical Sensing of Glucose in Biological Fluids and Tissues, CRC Press, Taylor & Grancis Group, London
(2009). Google Scholar
J. McMurdy, J. Reichner, A. Mathews, M. Markey, S. Intwala, and
G. Crawford,
“Broadband reflectance spectroscopy for establishing a quantitative metric of vascular leak using the Miles assay,”
J. Biomed. Opt., 14
(5), 054012
(2009). https://doi.org/10.1117/1.3233654 Google Scholar
J. C. Peckham and
K. Heider,
“Skin and subcutis,”
Pathology of the Mouse, 555
–635 Cache River Press, St. Louis, MO
(1999). Google Scholar
A. N. Bashkatov, E. A. Genina, V. I. Kochubey, and
V. V. Tuchin,
“Optical properties of human skin, subcutaneous and mucous tissues in the wavelength range from 400 to 2000nm,”
J. Phys. D: Appl. Phys., 38 2543
–2555
(2005). https://doi.org/10.1088/0022-3727/38/15/004 Google Scholar
S. Tseng, A. Grant, and
A. J. Durkin,
“In vivo determination of skin near-infrared optical properties using diffuse optical spectroscopy,”
J. Biomed. Opt., 13
(1), 014016
(2008). https://doi.org/10.1117/1.2829772 Google Scholar
S. Shuster, M. M. Black, and E. McVitie,
“The influence of age and sex on skin thickness, skin collagen and density,”
Brit. J. Dermatol., 93 639
–643
(1975). https://doi.org/10.1111/j.1365-2133.1975.tb05113.x Google Scholar
H. Dao Jr. and R. A. Kazin,
“Gender differences in skin: a review of the literature,”
Gender Med., 4 308
–328
(2007). https://doi.org/10.1016/S1550-8579(07)80061-1 Google Scholar
E. Tur,
“Physiology of the skin-differences between women and men,”
Clin. Dermatol., 15 5
–16
(1997). https://doi.org/10.1016/S0738-081X(96)00105-8 Google Scholar
M. Brincat, S. Kabalan, J. W. Studd, C. F. Moniz, J. de Trafford, and
J. Montgomery,
“A study of the decrease of skin collagen content, skin thickness and bone mass in the postmenopausal woman,”
Obstet. Gynecol., 70 840
–845
(1987). Google Scholar
C. Eisenbeiss, J. Welzel, and
W. Schmeller,
“The influence of female sex hormones on skin thickness: evaluation using 20 MHz sonography,”
Brit. J. Dermatol., 139 462
–467
(1998). https://doi.org/10.1046/j.1365-2133.1998.02410.x Google Scholar
L. Sjöström, U. Smith, M. Krotkiewski, and
P. Björntorp,
“Cellularity in different regions of adipose tissue in young men and women,”
Metabolism, 21 1143
–1153
(1972). https://doi.org/10.1016/0026-0495(72)90109-6 Google Scholar
S. Seidenari, A. Pagnoni, A. D. di Nardo, and
A. Giannetti,
“Echographic evaluation with image analysis of normal skin: variations according to age and sex,”
Skin Pharmacol., 7 201
–209
(1994). https://doi.org/10.1159/000211295 Google Scholar
L. Azzi, M. El-Alfy, C. Martel, and
F. Labrie,
“Gender differences in mouse skin morphology and specific effects of sex steroids and dehydroepiandrosterone,”
J. Invest. Dermatol., 124 22
–27
(2005). https://doi.org/10.1111/j.0022-202X.2004.23545.x Google Scholar
L. Azzi, M. El-Alfy, and
F. Labrie,
“Gender differences and effects of sex steroids and dehydroepiandrosterone on androgen and oestrogen alpha receptors in mouse sebaceous glands,”
Brit. J. Dermatol., 154 21
–27
(2006). https://doi.org/10.1111/j.1365-2133.2005.06847.x Google Scholar
S. Movérare, M. K. Lindberg, J. Faergemann, J. Å Gustafsson, and
C. Ohlsson,
“Estrogen receptor alpha, but not estrogen receptor beta, is involved in the regulation of the hair follicle cycling as well as the thickness of epidermis in male mice,”
J. Invest. Dermatol., 119 1053
–1058
(2002). https://doi.org/10.1046/j.1523-1747.2002.00637.x Google Scholar
G. Zonios, L. T. Perelman, V. Backman, R. Manoharan, M. Fitzmaurice, J. Van Dam, and
M. S. Feld,
“Diffuse reflectance spectroscopy of human adenomatous colon polyps in vivo,”
Appl. Optics, 38 6628
–6637
(1999). https://doi.org/10.1364/AO.38.006628 Google Scholar
G. Zonios, A. Dimou, I. Bassukas, D. Galaris, A. Tsolakidis, and
E. Kaxiras,
“Melanin absorption spectroscopy: new method for noninvasive skin investigation and melanoma detection,”
J. Biomed. Opt., 13
(1), 014017
(2008). https://doi.org/10.1117/1.2844710 Google Scholar
M. Canpolat, M. Akyüz, G. Gürer, and
R. Tuncer,
“Intra-operative brain tumor detection using elastic light single-scattering spectroscopy: a feasibility study,”
J. Biomed. Opt., 14
(5), 054021
(2009). https://doi.org/10.1117/1.3247151 Google Scholar
L. B. Lovat, K. Johnson, G. D. Mackenzie, B. R. Clark, M. R. Novelli, S. Davies, M. O’Donovan, C. Selvasekar, S. M. Thorpe, D. Pickard, R. Fitzgerald, T. Fearn, I. Bigio, and
S. G. Brown,
“Elastic scattering spectroscopy accurately detects high grade dysplasia and cancer in Barrett's oesophagus,”
Gut, 55 1078
–1083
(2006). https://doi.org/10.1136/gut.2005.081497 Google Scholar
I. J. Bigio, O. A’Amar, and
M. S. Hirsch,
“Elastic scattering spectroscopy for detection of prostate cancer: preliminary feasibility study,”
Proc. SPIE, 5141 142
–146
(2003). https://doi.org/10.1117/12.500947 Google Scholar
A. M. J. Wang, J. E. Bender, J. Pfefer, U. Utzinger, and
R. A. Drezek,
“Depth-sensitive reflectance measurements using obliquely oriented fiber probes,”
J. Biomed. Opt., 10
(4), 044017
(2005). https://doi.org/10.1117/1.1989335 Google Scholar
R. Reif, O. A’Amar, and
I. J. Bigio,
“Analytical model of light reflectance for extraction of optical properties in small volumes of turbid media,”
Appl. Optics, 46 7317
–7328
(2007). https://doi.org/10.1364/AO.46.007317 Google Scholar
R. L. P. van Veen, W. Verkruysse, and
H. J. C. M. Sterenborg,
“Diffuse-reflectance spectroscopy from 500 to 1060nm by correction for inhomogeneously distributed absorbers,”
Opt. Lett., 27 246
–248
(2002). https://doi.org/10.1364/OL.27.000246 Google Scholar
R. Graaff, J. G. Aarnoudse, J. R. Zijp, P. M. A. Sloot, F. F. M. de Mul, J. Greve, and
M. H. Koelink,
“Reduced light-scattering properties for mixtures of spherical particles: a simple approximation derived from Mie calculations,”
Appl. Optics, 31 1370
–1376
(1992). https://doi.org/10.1364/AO.31.001370 Google Scholar
S. L. Jacques, and
L. Wang,
“Monte Carlo modeling of light transport in tissue,”
Optical-Thermal Response of Laser Irradiated Tissue, 73
–100 Plenum, New York
(1995). Google Scholar
L. H. Wang, S. L. Jacques, and
L. Zheng,
“MCML: Monte-Carlo modeling of light transport in multilayered tissues,”
Comput. Meth. Prog. Biol., 47 131
–146
(1995). https://doi.org/10.1016/0169-2607(95)01640-F Google Scholar
M. Hiraoka, M. Firbank, M. Essenpreis, M. Cope, S. R. Arridge, P. van der Zee, and
D. T. Delpy,
“A Monte Carlo investigation of optical path length in inhomogeneous tissue and its application to near-infrared spectroscopy,”
Phys. Med. Biol., 38 1859
–1876
(1993). https://doi.org/10.1088/0031-9155/38/12/011 Google Scholar
L. G. Henyey and
J. L. Greenstein,
“Diffuse radiation in the galaxy,”
Astrophys. J., 93 70
–83
(1941). https://doi.org/10.1086/144246 Google Scholar
H. Ding, J. Q. Lu, W. A. Wooden, P. Kragel, and
X. Hu,
“Refractive indicies of human tissues at eight wavelengths and estimated dispersion relationships between 300 and 1600nm,”
Phys. Med. Biol., 51 1479
–1489
(2006). https://doi.org/10.1088/0031-9155/51/6/008 Google Scholar
L. S. Hansen, J. E. Coggle, J. Wells, and
M. W. Charles,
“The influence of the hair cycle on the thickness of mouse skin,”
Anat. Rec., 210 569
–573
(1984). https://doi.org/10.1002/ar.1092100404 Google Scholar
C. R. Simpson, M. Kohl, M. Essenpreis, and
M. Cope,
“Near-infrared optical properties of ex vivo human skin and subcutaneous tissues measured using the Monte Carlo inversion technique,”
Phys. Med. Biol., 43 2465
–2478
(1998). https://doi.org/10.1088/0031-9155/43/9/003 Google Scholar
R. Samatham, S. L. Jacuques, and
P. Campagnola,
“Optical properties of mutant versus wild-type mouse skin measured by reflectance-mode confocal scanning laser microscopy (rCSLM),”
J. Biomed. Opt., 13
(4), 041309
(2008). https://doi.org/10.1117/1.2953195 Google Scholar
W. Cheong, S. A. Prahl, and
A. J. Welch,
“A review of the optical properties of biological tissues,”
IEEE J. Quant. Elect., 26 2166
–2185
(1990). https://doi.org/10.1109/3.64354 Google Scholar
I. V. Meglinski and
S. J. Matcher,
“Quantitative assessment of skin layers absorption and skin reflectance spectra simulation in the visible and near-infrared spectral regions,”
Physiol. Meas., 23 741
–753
(2002). https://doi.org/10.1088/0967-3334/23/4/312 Google Scholar
S. Tseng, P. Bargo, A. Durkin, and
N. Kollias,
“Chromophore concentrations, absorption, and scattering properties of human skin in-vivo,”
Opt. Express, 17 14599
–14617
(2009). https://doi.org/10.1364/OE.17.014599 Google Scholar
E. Salomatina, B. Jiang, J. Novak, and
A. N. Yaroslavsky,
“Optical properties of normal and cancerous human skin in the visible and near-infrared spectral range,”
J. Biomed. Opt., 11
(6), 064026
(2006). https://doi.org/10.1117/1.2398928 Google Scholar
G. Pellacani and
S. Seidenari,
“Variations in facial skin thickness and echogenicity with site and age,”
Acta Derm.-Venereol., 79 366
–369
(1999). https://doi.org/10.1080/000155599750010283 Google Scholar
S. Diridollou, V. Vabre, M. Berson, L. Vaillant, D. Black, J. M. Lagarde, J. M. Grégoire, Y. Gall, and
F. Patat,
“Skin ageing: changes of physical properties of human skin in vivo,”
Intl. J. Cosmetic Sci., 23 353
–362
(2001). https://doi.org/10.1046/j.0412-5463.2001.00105.x Google Scholar
C. Eisenbeiss, J. Welzel, W. Eichler, and
K. Klotz,
“Influence of body water distribution on skin thickness: measurements using high-frequency ultrasound,”
Brit. J. Dermatol., 144 947
–951
(2001). https://doi.org/10.1046/j.1365-2133.2001.04180.x Google Scholar
|
|||||||||||||||||||||||||||||||||||


