|
|
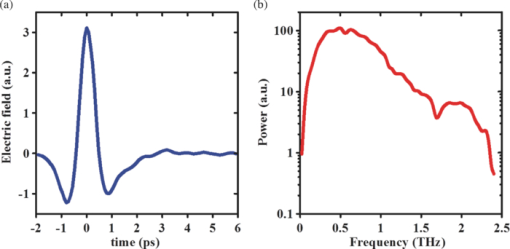
1.IntroductionThe terahertz (THz) region of the electromagnetic (EM) spectrum is defined as frequencies ranging from 0.1 to 10 THz (1 THz = 1012 Hz = 1 ps). Historically, few sources have been available to efficiently generate THz radiation. However, over the past few years, several technological advances have resulted in the unprecedented development of many new types of THz sources and components.1, 2, 3, 4, 5 These technologies are now being used as tools for a plethora of basic science investigations.6, 7, 8 In addition, they are increasingly being integrated into innovative sensing and imaging operational schemes, which are finding widespread use in a host of medical, military, and defense applications. For example, THz devices are now being tested at hospitals for early cancer and burn diagnosis, 9, 10, 11, 12, 13, 14, 15, 16, 17, 19, 20, 21, 22, 23 at major airports for security screening purposes,23, 24, 25 and at border patrol checkpoints for identification of explosives,3, 26 drugs,27, 28 liquids,7, 8, 29, 30, 31 and biological macromolecules.32, 33, 34, 35 The strength of many THz dermatological applications is derived from the fact that water, the primary constituent of skin tissues (~70% by volume), exhibits strong absorption at THz frequencies (μ a = 300 cm−1 at 1.5 THz).29 Due to the strong optical absorption of water, THz waves can only penetrate a few hundred microns in biological tissues. Therefore, THz techniques are best suited for imaging the surface of biological tissues. However, the strong absorption of water is also beneficial because it provides for excellent soft-tissue contrast. Consequently, THz sensing and imaging approaches are very sensitive to small differences in the water concentration levels of tissues. Several recent studies have successfully exploited this contrast mechanism to differentiate healthy, dehydrated, burned, and diseased tissues.12, 13, 14 Water exhibits many unique chemical and physical properties that contribute to its strong interaction with THz radiation. One property is that water molecules are able to form tetrahedral arrangements of hydrogen bonds to neighboring molecules. This property gives water molecules the ability to actively engage in both inter- and intramolecular bonding. Due to these interactions, water molecules create an extensive dynamic hydrogen bond network, which behaves in a collective manner. Interestingly, the intermolecular stretching vibrations of this network, which are the origin of macroscopic water dynamics, occur on the picosecond timescale (5.6 THz).36, 37, 38 In addition, due to the slow relaxation time of water molecules, large intermolecular bending vibrations also occur on the picosecond timescale (1.5 THz).36, 37, 38 Water also functions as a universal solvent and is required for the proper folding and function of biological macromolecules (i.e., carbohydrates, proteins, and nucleic acids).39, 40, 41, 42, 43 Many of these macromolecules also exhibit collective vibrational modes on the picosecond timescale.32, 35, 44, 45, 46 Overall, water and many biological macromolecules exhibit dynamics that occur on the picosecond timescale. Numerous basic science investigations have used THz spectroscopic techniques to characterize the frequency-dependent optical properties of water and biological molecules. 7, 8, 29, 30, 31, 33, 47, 48, 49, 50 There are two advantages to using THz spectroscopic techniques rather than conventional microwave or Fourier transform far-infrared spectroscopic (FTFIR) approaches. The first advantage is that microwave spectroscopic approaches operate on the 100 ps timescale, whereas THz techniques operate on the subpicosecond to picosecond timescales. Since the vibrational motion of water and biomolecules occur on the picosecond timescale, THz approaches permit time-resolved investigation of these dynamics because they operate on the same timescale (1 ps = 1 THz). The second advantage of THz spectroscopic approaches is that they permit the measurement of amplitude and phase information, which are directly related to the absorption coefficient and index of refraction of the tissue. Thus, the complex permittivity of samples can be obtained without having to perform Kramers–Kronig analysis.51 THz spectroscopy is typically performed in either a reflection or transmission geometry. Transmission-based approaches have been used to examine the dynamics of water, biomolecules, and biological tissues. However, due to the strong absorption of water, a transmission-based measurement is typically performed on either lyophilized tissues or on very thin tissue slices (≤100μm).15, 16, 17 Lyophilization and tissue sectioning approaches make it feasible to conduct transmission-based measurements; however, these methods greatly affect the hydration level and morphology of the tissue. As a consequence, these changes can alter the optical properties that are collected, thereby reducing the accuracy of the measurements. Due to these factors, reflection geometries are preferred for both in vivo and ex vivo THz spectroscopic measurements of biological tissues. Over the past decade, several reflection-based THz systems have been developed for the noninvasive evaluation of biological tissues.9, 10, 11, 52, 53, 54 These systems have been used to evaluate tissue hydration,15, 16, 17 to diagnose skin cancers, 9, 10, 11, 12, 13, 14, 54, 55, 56, 57 and to assess the depth and severity of skin burns.19, 20, 21, 22, 23 These studies have demonstrated that the tissue's water concentration levels and its optical properties are the primary contrast mechanisms for differentiating healthy, burned, and diseased tissues.12, 13, 14 These studies have also demonstrated that the optical properties of biological tissues depend on the organism (e.g., human, rat, porcine),10, 11, 53, 54, 58 tissue type (e.g., skin, muscle, adipose, liver, heart),54, 59, 60 method of tissue preparation (e.g., fresh versus frozen/thawed), and duration of tissue fixation.15, 58 In recent years, many THz-TDS systems have become commercially available. These systems are useful for many applications, but due to their size (3000 to 50000 in3 or 50 to 250 liters) and weight (55 to 220 pounds or 25 to 100 kg), they have restricted portability and are impractical for military and battlefield settings where space is limited. For example, in battlefield hospitals or medical evacuation aircraft, and other Medevac transportation vehicles. In this study, we developed and tested the performance of a compact (180 in3 or 2.95 liters), light (4.2 lbs or 1.9 kg), and portable THz-TDS device. This device is envisioned to be employed as a tool for the rapid assessment of skin wounds and/or burns (i.e., thermal, chemical, physical) in battlefield settings. To examine the performance of this device, we measured the optical properties for several liquids and biological tissues, and compared our results to those reported in the literature. 2.Materials and Methods2.1.Liquid and Biological Sample PreparationWe measured the spectra for water, ethanol, and several porcine tissues using our compact THz-TDS device. All measurements were made at room temperature. Five or more measurements were made for each liquid, and each test was performed by placing a drop of liquid (~50 μL) on the measurement window. Excised porcine tissues (skin, adipose tissue, and muscle) were collected and prepared in adherence to a Brooks Air Force Research Laboratory exempt Institutional Animal Care and Use Committee protocol. The thickness of all samples was greater than or equal to 1 cm. Spectra was measured on the following freshly excised porcine tissues: muscle, adipose, and skin. To examine the effect that tissue preparation has on the optical properties, we also collected and compared the spectra for freshly excised and frozen/thawed skin samples. The spectra of the fresh samples was measured on tissues less than one hour after excision. The frozen/thawed skin samples were prepared as follows: excised two days prior to experimentation, wrapped in moistened gauze, frozen at −20°C, and thawed at room temperature 30 min prior to measurement. Seven to twenty-six measurements were made on each tissue sample, and samples were processed for conventional histological analysis using hematoxylin and eosin (H&E) stains. 2.2.Compact Terahertz Time Domain SpectrometerIn this study, we developed a modified THz-TDS system that permits reflection measurements for biological tissues. The system consists of a mini-ZTM THz-TDS system (Zomega Terahertz Corporation) and a custom-designed skin reflection unit [Figs. 1a, 1b, 1c]. The system is compact (180 in3 or 2.95 liters), light (4.2 lbs or 1.9 kg), inexpensive (~$150 K), portable, and robust. It is interesting to note that this system is 15 to 55 times lighter and 15 to 80 times smaller than conventional commercially available systems. The unit has the following performance specifications: frequency range (0.1 to 2.5 THz), frequency resolution (5 GHz), dynamic range (70 dB at 0.1 THz to 50 dB at 1.6 THz). The mini-ZTM THz-TDS system generates broadband THz radiation using a photoconductive (PC) switch technique, originally pioneered by Auston and colleagues.61, 62, 63, 64 In brief, the PC switch technique functions by using a pulse from a femtosecond (fs) near-infrared laser to excite a biased PC antenna consisting of metallic striplines deposited on semiconductor materials. Upon interaction with the semiconductor material, the optical pulse generates photocarriers, which when accelerated using a DC bias, create a photocurrent within the PC antenna. These time-varying photocurrents, which occur in the subpicosecond range, emit broadband EM radiation at THz frequencies. Fig. 1Compact terahertz time-domain spectrometer for the measurement of the optical properties of biological tissues. (a) Schematic illustration of the photoconductive switch used to generate THz radiation in our source. (b) Image of custom THz-TDS system consisting of a skin reflection unit and the Mini-ZTM spectrometer (Zomega Terahertz Corporation, LTD). (c) Schematic representation of principle optical elements used in the device. 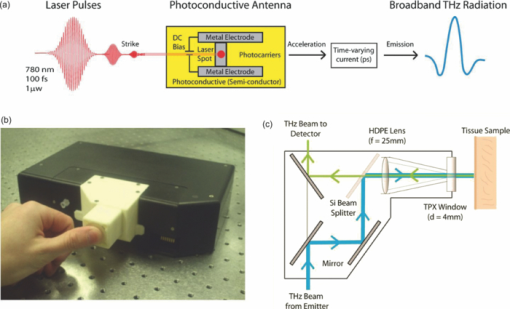 Figure 1a contains a schematic illustration of the primary elements used in our system. The pump laser used in this unit is a diode laser with the following specifications: λ = 780 nm, τp = 100 fs, and average power = 20 mW. Using a zinc telluride electro-optic crystal (1 mm thick), we obtained the time-varying electric fields of the THz reflected light which, upon performing a numerical Fourier transform, resulted in reflection spectra from 0.1 to 4.0 THz. The skin reflection unit contains three gold mirrors (R ≈ 0.99 at THz frequencies), a high resistivity (10K ohm-cm) Silicon beam splitter, a high-density polyethylene (HDPE) lens, and a polymethylpentene (TPX) window [Figs. 1b and 1c]. The HDPE lens has a diameter of 2.54 cm, a 25 mm focal length, and μ a = 0.1 to 5.0 cm−1 from 0.1 to 1.6 THz. The 4-mm thick TPX window has a diameter of 2.54 cm and μ a = 0.1 to 1.5 cm−1 from 0.1 to 1.6 THz. The window served two purposes: 1. to ensure samples were normal to the THz beam and 2. to accurately measure the phase of the reflected signal by monitoring the relative timing of the signal reflected from the sample compared to the reflection from the first surface of the TPX window. 2.3.THz TDS Source PerformanceFigures 2a and 2b contain sample plots of the broadband THz pulses created with our THz-TDS device. A plot of the wave form of the broadband THz pulses (FWHM = 660 fs) in time domain is provided in Fig. 2a, and a plot of the frequency power spectrum of the Fourier transform of the pulse is shown in Fig. 2b. 2.4.Data Acquisition and Signal ProcessingThe raw data collected with our system is in the time domain and the optical properties (n and μ a) of the samples are frequency dependent. Therefore, we conducted a fast Fourier transform (FFT) to compute these values. To do this, we obtained the power reflectance (R) and reflection phase (θ), and then took the complex Fourier transform of the sample measurements. The phase was accurately measured by comparing the reflection from the first and second interface of the TPX window. These signals were then compared to a reference consisting of a mirror pressed against the window. Each measurement was computed using an average of 250 waveforms acquired at a rate of 5 Hz. Given R and θ, we then used Fresnel equations to calculate the n and the extinction coefficient (κ) of the sample [see Eqs. 1, 2] where n 0 is the index of the TPX window. The absorption coefficient μ a was then calculated using the following relationship: μ a = 4πκ/λ, where λ is the free space wavelength. Then using Beer-Lambert Law, with the assumption that THz-liquid interactions are absorption-dominated, we then calculated the optical penetration depth (δ = 1/μ a).3.Results and Discussion3.1.System Calibration and Validation using Several Liquids3.1.1.EthanolThe goal for the first set of experiments was to validate that our system provided comparable values to those reported in the literature. Since the optical properties of ethanol are well-characterized at THz frequencies, we first used our system to measure the properties of ethanol. Figures 3a and 3b contain plots of the frequency-dependent optical properties for ethanol. We found that the index of refraction decreases with frequency, whereas the absorption coefficient increases with frequency. We also found that our collected values are in excellent agreement with previously published reports.29, 33, 65, 66 Figure 3c contains a plot of the optical penetration depth for ethanol. We found that at lower THz frequencies, ethanol has an optical penetration depth of roughly 1 mm. This finding suggests that ethanol does not absorb THz radiation as strongly as other polar liquids, such as water. Fig. 3Optical properties of ethanol at Terahertz frequencies. (a) Real index of refraction (n) plotted versus frequency (THz) and wavelength (μm). (b) The absorption coefficient (μ a) plotted versus frequency (THz) and wavelength (μm). (c) Optical penetration depth (δ) plotted versus frequency (THz). Ethanol spectra measured in this study, blue circles; fs-THz pulsed spectroscopy results from Kindt (Ref. 29), purple circles; Yomogida (Ref. 66), black circles; Jepsen (Ref. 33), yellow circles; Barthel (Ref. 65), green circles. Data are expressed as means ± SD, with a sample population of n = 5. 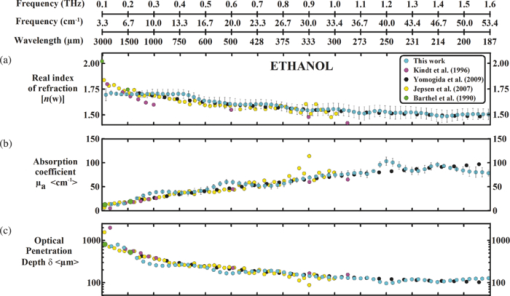 3.1.2.WaterWater was the second liquid that we used to calibrate our system. The optical properties of water, the primary constituent of all biological tissues, are also well-characterized at THz frequencies. 7, 29, 31, 33, 47, 49, 50, 67, 68 Figure 4a contains a plot of the average index of refraction that we measured for water. For comparison, we also provided data plots reported by several other groups. 7, 29, 31, 33, 47, 50, 67, 68 For water, we found that the magnitude of n decreases with increasing frequency and ranges between a value of 3.4 at 0.1 THz to 2.15 at 1.6 THz. Overall, the general slope and magnitude of the n values that we collected were comparable (≤8%) to those reported in previous studies.7, 30, 47 Fig. 4Optical properties of water at Terahertz frequencies. (a) Real index of refraction (n) plotted versus frequency (THz) and wavelength (μm). (b) The absorption coefficient (μ a) plotted versus frequency (THz) and wavelength (μm). (c) Optical penetration depth (δ) plotted versus frequency (THz). Water spectra measured in this study, dark blue circles; Thrane (Ref. 48), light blue squares; Hasted, orange crosses; Jepsen (Ref. 33), yellow triangles; Segelstein (Ref. 47), red triangles; Venables and Schmuttenmaer (Refs. 7 and 8), green triangles. Barthel (Ref. 65), black circles. Data are expressed as means ± SD, with sample population n = 9. 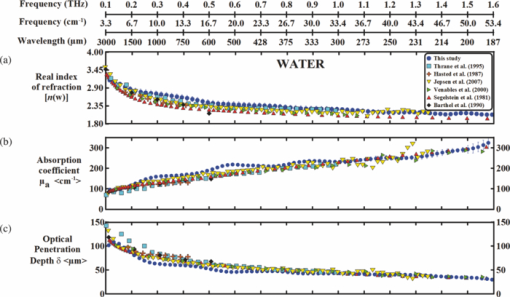 Figure 4b contains a plot of the average μ a values for water. Similar to ethanol, this data shows that the μ a of water also increases with frequency and ranges in value from 100 cm−1 at 0.1 THz to 300 cm−1 at 1.6 THz. For the most part, the slope and magnitude of our data is in well-agreement with previous reports.7, 30, 47 However, since the optical absorption of water does vary with temperature,38 it is possible that the slight variations between studies may be attributed to the different temperatures used in each work. Figure 4c shows that the δ of water equals 125 μm at 0.1 THz and 40 μm at 1.6 THz. 3.2.Biological Tissues: Histology and Frequency Dependent Optical PropertiesSeveral studies have shown that the optical properties of biological tissues vary with organism (e.g., human, rat, porcine),10, 11, 53, 54, 58 tissue type (e.g., skin, muscle, adipose, liver, heart),54, 59, 60 tissue preparation technique (e.g., freshly excised versus frozen/thawed), and duration of fixation.58 Given these findings, we conducted several experiments to measure the optical properties for skin tissue and its primary constituents, adipose tissue and muscle. In addition, to explore the effect that tissue preparation has on these values, we also collected data for both freshly excised and frozen/thawed skin tissues. The main goal for these studies was to determine whether the data collected with our compact THz-TDS system was consistent with values reported in the literature. 3.2.1.Histological evaluationConventional histological techniques were performed to evaluate the morphology of the porcine tissues tested with our system. Immediately after THz-TDS measurements, tissues were fixed, sectioned, and stained with hematoxylin and eosin (H&E). Figures 5a and 5d contain sample representations for the following tissues: panniculus carnosus (subcutaneous striated muscle), panniculus adiposus (subcutaneous adipose), freshly harvested skin (epidermis and dermis), and frozen/thawed prepared skin (epidermis and dermis). We found that the fascicles of the striated muscle ranged in thickness between 20 and 50 μm [Fig. 5a]. In addition, we found that the diameter of adipocytes ranged between 10 and 70 μm. An image of the panniculus adiposus, a fatty layer of subcutaneous tissue superficial to the vestigial layer of muscle is provided in Fig. 5b. Fig. 5Histological evaluation of porcine cutaneous and subcutaneous tissues examined with THz-TDS system. Fixed tissue sections were stained with hematoxylin and eosin (H&E). (a) Freshly harvested muscle. (b) Freshly harvested adipose. (c) Freshly harvested skin. (d) Frozen/thawed skin. In all images the scale bar = 75 μm. Abbreviations: muscle (panniculus carnosus = pc); adipose (panniculus adiposus = pa); epidermis = epi; basement membrane = bm; dermis = d; and capillary = c. 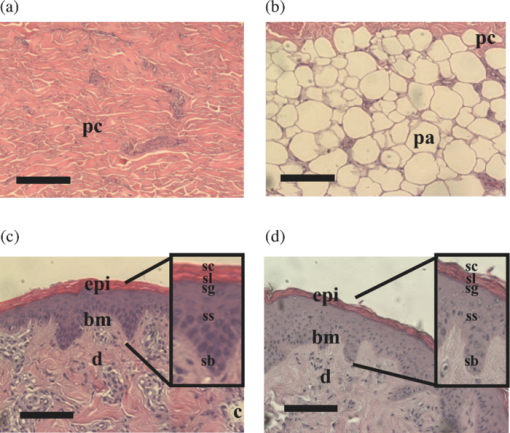 Porcine skin consists of three primary layers: epidermis, dermis, and hypodermis. In our images, the epidermis, basement membrane, and dermal tissue are all distinguishable [Figs. 5c and 5d]. In addition, in both the fresh and frozen/thawed skin sections, we can differentiate all five layers of the epidermis: stratum corneum (sc), stratum lucidum (sl), stratum granulosum (sg), stratum spinosum (ss), and stratum basale (sb) [Figs. 5c and 5d]. We found that the epithelium projections ranged in thickness between 40 and 125 μm. Given the limited penetration depth of THz radiation, these morphological features are important to note. 3.2.2.Fresh porcine muscleFigures 6a, 6b, 6c contain plots of the average optical properties and optical penetration depth for fresh porcine muscle. We found that the index of refraction decreases with frequency, whereas the absorption coefficient increases with frequency. Maximum (n = 2.5) and minimum (n = 2.1) values were observed at 0.13 and 1.6 THz, respectively. For comparison purposes, we also provided data plots from Sun 58 and Huang 52 [Figs. 6a and 6c]. Overall, the n values that we measured with our system were in excellent agreement (≤10%) with those reported in both of these studies. Fig. 6Optical properties of fresh porcine muscle. (a) Real index of refraction (n) plotted versus frequency (THz) and wavelength (μm). (b) The absorption coefficient (μ a) plotted versus frequency (THz) and wavelength (μm). (c) Optical penetration depth (δ) plotted versus frequency (THz). Muscle spectra this study, pink circles; Huang (Ref. 52), green triangles; Sun (Ref. 58), black stars. Data are expressed as means ± SD, with sample population = 8. 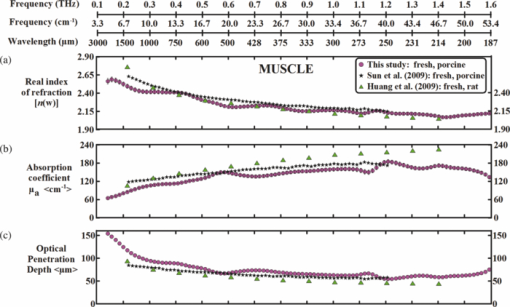 In contrast, we found that the μ a values for muscle increase with frequency, with minimum (μ a = 60 cm−1) and maximum values (μ a = 200 cm−1) occurring at 0.13 and 1.2 THz, respectively. These values are in excellent agreement with those reported in previous studies.52, 58 Figure 6c is a plot of the δ of muscle at THz frequencies. The data indicates that THz radiation has a δ in muscle of 150 μm at 0.13 THz and 75 μm at 1.6 THz. It is clear from the data that the optical properties we measured were consistent with several other reports. This finding is particularly interesting because in this study we measured the properties of freshly excised porcine muscle, while other groups used were either harvested from a different organism (porcine versus rat) and/or were prepared using a different technique (fresh versus refrigerated). Specifically, Sun measured the spectra of porcine muscle 24 h post-harvest, whereas Huang measured spectra on freshly harvested rat muscle.53, 58 This data suggests that the optical properties of muscle are fairly consistent regardless of the organism or tissue preparation technique employed. 3.2.3.Fresh porcine adipose tissueFigures 7a, 7b, 7c contain plots of the average optical properties (n and μ a) and optical penetration depth for adipose tissue. We found that the index of refraction for adipose tissue decreases with increases in frequency. Similar to muscle, maximum (n = 2.5) and minimum (n = 2.0) values were observed at 0.13 and 1.6 THz, respectively. The μ a values for adipose increases with frequency, with minimum (μ a = 50 cm−1) and maximum values (μ a = 150 cm−1) occurring at 0.13 and 1.6 THz, respectively. We found that the δ in adipose ranges in value from 200 μm at 0.13 THz to 50 μm at 1.6 THz [Fig. 7c]. Fig. 7Optical properties of fresh adipose tissue. (a) Real index of refraction (n) plotted versus frequency (THz) and wavelength (μm). (b) The absorption coefficient (μ a) plotted versus frequency (THz) and wavelength (μm). (c) Optical penetration depth (δ) plotted versus frequency (THz). Adipose tissue in this study, blue circles; Sun (Ref. 58), sea green triangles; Huang (Ref. 52), pink diamonds. Data are expressed as means ± SD, with sample population = 9. 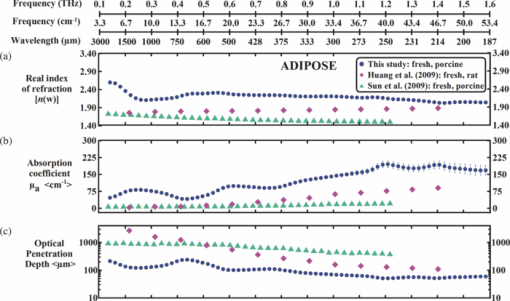 Both the slope and the index of refraction that we observed for adipose tissue were vastly different than those reported in other studies.52, 58 For instance, Huang found that the index of refraction actually increased with frequency and ranged in value from 1.5 at 0.2 THz to 1.9 at 1.4 THz. In addition, Sun found that the index of refraction decreased with frequency, and ranged in value from 1.7 at 0.15 THz to ~1.4 at 1.2 THz. Overall, these values are lower (~30%) than the index of refraction values that we measured with our system. Additionally, we found that the absorption coefficient values that we measured for adipose tissue were roughly two to ten times greater in magnitude than those previously reported.52, 58 Although the exact reason for these differences is unclear, it is possible that during our measurements a thin layer of water was present on the adipose tissue. This may also explain why the properties that we measured for adipose are similar to those that we measured for water. In contrast, Huang and Sun used blotting paper or ethanol to further dehydrate their adipose tissues prior to measurement. Such approaches are advantageous for collecting spectra from adipose tissue, but it is also important to keep in mind that in an in vivo scenario adipose tissue will be hydrated. Thus, although our data is inconsistent with previous reports, it may be more indicative of the values that may be measured on hydrated, intact biological tissues. Nevertheless, the differences in optical properties that we observed for adipose tissue are most likely due to the fact that we used different sample preparation and dehydration techniques. 3.2.4.Measurement and comparison of the optical properties of skinAfter measuring the spectra for muscle and adipose tissue, we then collected and compared the properties for fresh and frozen/thawed skin tissues. Plots for the index of refraction, absorption coefficient, and optical penetration depth are provided in Figs. 8a, 8b, 8c. Similar to previous tissues, we found that the index of refraction decreases with increases in frequency. For fresh skin, we found that the n ranged between 2.3 and 1.8, whereas for the frozen/thawed samples the n values were slightly higher and ranged in value between 2.6 and 2.0. The values we measured for the frozen/thawed samples were in excellent agreement with those reported by Pickwell 54 Fig. 8Optical properties of excised porcine skin prepared using fresh and frozen/thawed techniques. (a) Real index of refraction (n) plotted versus frequency (THz) and wavelength (μm). (b) The absorption coefficient (μa) plotted versus frequency (THz) and wavelength (μm). (c) Optical penetration depth (δ) plotted versus frequency (THz). Spectra for fresh excised porcine skin from left leg, pink line; frozen/thawed skin from leg, black line; human skin data from Pickwell (Ref. 10), light blue triangles. Data are expressed as means ± SD, with n = 9 or 26. 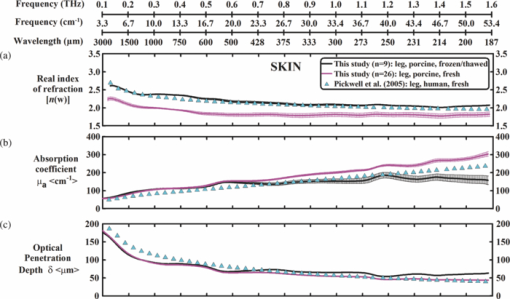 Similar to the trends observed in other tissues, we also found that the magnitude of μ a increased with frequency. At lower THz frequencies (0.1 to 0.8 THz), the fresh and frozen/thawed skin samples exhibited comparable values for μ a (50 to 180 cm−1), which were both in excellent agreement with those values measured by Pickwell In contrast, for frequencies greater than 0.8 THz, we found that fresh tissue exhibited μ a values that were 10 to 100% greater than those measured for frozen/thawed tissues. Interestingly, Pickwell reported μ a values that fell between these values. Figure 8c is a plot of the δ of THz radiation in fresh excised porcine skin. The data shows that THz radiation will have maximal penetration (δ ≈ 200 μm) at lower frequencies and minimal penetration at higher THz frequencies (δ ≈ 40 to 50 μm). These penetration depths are important to consider given the fact that the thickness of the epidermis ranges across the human body between 50 and 1000 μm. In addition, we found that the epithelial thickness for the same section of porcine skin ranged in thickness between 40 and 125 μm [Figs. 5c and 5d]. Since the optical penetration depth of THz radiation in skin is comparable to these distances, it is entirely possible that THz-TDS measurements may fluctuate with the thickness of the epithelium projections that are present in the sampled area. 4.ConclusionIn summary, we have developed and tested the performance of a compact THz-TDS device that is considerably smaller and lighter than conventional systems. Using this device, we measured the optical properties from 0.1 to 1.6 THz for ethanol, water, muscle, adipose tissue, and skin. In addition, we compared the spectra that we collected to values reported in the literature. Consistent with previously published reports, we found that the index of refraction decreases with frequency for all liquids and tissues tested. Muscle, adipose, and frozen/thawed skin exhibited comparable n values ranging from 2.5 at 0.1 THz to 2.0 at 2.0 THz; however, fresh skin exhibited values that were roughly 40% lower in magnitude. Also consistent with previous reports, we found that the μ a measured for each sample increases with frequency. Muscle and adipose tissue exhibited μ a values ranging between 50 and 200 cm−1, whereas both fresh and frozen/thawed skin samples exhibited slightly higher μ a values ranging between 50 and 300 cm−1. Additionally, we determined that the δ in skin was roughly 150 μm at 0.1 THz and 40 to 50 μm at 1.6 THz. Overall, our compact THz-TDS system provided measures for the optical properties of biological tissues that were consistent with previous studies. These results demonstrate that our compact THz spectrometer may be a useful and practical tool for the rapid battlefield assessment of skin health, wounds, and burns. AcknowledgmentsWe wish to thank the National Academy of Sciences NRC Research Associateship program and the Air Force Research Laboratory for providing us with the opportunity to conduct this study. This work was supported by grants provided by HQAF SGRS Clinical Investigation program: “Pulse Safety” and “Determination of Cellular Bio-effect Thresholds for Terahertz Frequencies.” In addition, funding was provided by the Air Force Office of Scientific Research (AFOSR) and the Partnership for Education and Research in Materials (PREM) provided by the National Science Foundation (NSF), Division of Materials Research Award (#0934218). ReferencesB. Ferguson and
X.-C. Zhang,
“Materials for terahertz science and technology,”
Nat Mater, 1
(1), 26
–33
(2002). https://doi.org/10.1038/nmat708 Google Scholar
I. Hosako, N. Sekine, M. Patrashin, S. Saito, K. Fukunaga, Y. Kasai, P. Baron, T. Seta, J. Mendrok, S. Ochiai, and
H. Yasuda,
“At the dawn of a new era in terahertz technology,”
Proc. IEEE, 95
(8), 1611
–1623
(2007). https://doi.org/10.1109/JPROC.2007.898844 Google Scholar
H.-B. Liu, H. Zhong, N. Karpowicz, Y. Chen, and
X.-C. Zhang,
“Terahertz spectroscopy and imaging for defense and security applications,”
Proc. IEEE, 95
(8), 1514
–1527
(2007). https://doi.org/10.1109/JPROC.2007.898903 Google Scholar
P. H. Siegel,
“Terahertz technology,”
IEEE Trans. Microwave Theory Tech., 50
(3), 910
–928
(2002). https://doi.org/10.1109/22.989974 Google Scholar
B. S. Williams,
“Terahertz quantum-cascade lasers,”
Nature Photon., 1
(9), 517
–525
(2007). https://doi.org/10.1038/nphoton.2007.166 Google Scholar
U. Heugen, G. Schwaab, E. Bründermann, M. Heyden, X. Yu, D. M. Leitner, and
M. Havenith,
“Solute-induced retardation of water dynamics probed directly by terahertz spectroscopy,”
Proc. Natl. Acad. Sci. U.S.A., 103
(33), 12301
–12306
(2006). https://doi.org/10.1073/pnas.0604897103 Google Scholar
D. Venables and
C. Schmuttenmaer,
“Spectroscopy and dynamics of mixtures of water with acetone, acetonitrile, and methanol,”
J. Chem. Phys., 113
(24), 11222
–11236
(2000). https://doi.org/10.1063/1.1328072 Google Scholar
D. S. Venables, A. Chiu, and
C. A. Schmuttenmaer,
“Structure and dynamics of nonaqueous mixtures of dipolar liquids. I. Infrared and far-infrared spectroscopy,”
J. Chem. Phys., 13
(8), 3243
–3248
(2000). https://doi.org/10.1063/1.1287145 Google Scholar
P. C. Ashworth, E. Pickwell-MacPherson, E. Provenzano, S. E. Pinder, A. D. Purushotham, M. Pepper, and
V. P. Wallace,
“Terahertz pulsed spectroscopy of freshly excised human breast cancer,”
Opt. Express, 17
(15), 12444
–12454
(2009). https://doi.org/10.1364/OE.17.012444 Google Scholar
E. Pickwell, A. J. Fitzgerald, B. E. Cole, P. F. Taday, R. J. Pye, T. Ha, M. Pepper, and
V. P. Wallace,
“Simulating the response of terahertz radiation to basal cell carcinoma using ex vivo spectroscopy measurements,”
J. Biomed. Opt., 10
(6), 064021
(2005). https://doi.org/10.1117/1.2137667 Google Scholar
E. Pickwell-MacPherson and
V. P. Wallace,
“Terahertz pulsed imaging—a potential medical imaging modality?,”
Photodiagnosis Photodyn. Ther., 6
(2), 128
–134
(2009). https://doi.org/10.1016/j.pdpdt.2009.07.002 Google Scholar
V. P. Wallace, P. F. Taday, A. J. Fitzgerald, R. M. Woodward, J. Cluff, R. J. Pye, and
D. D. Arnone,
“Terahertz pulsed imaging and spectroscopy for biomedical and pharmaceutical applications,”
Faraday Discuss., 126 255
–263
(2004). https://doi.org/10.1039/b309357n Google Scholar
R. M. Woodward, B. E. Cole, V. P. Wallace, R. J. Pye, D. D. Arnone, E. H. Linfield, and
M. Pepper,
“Terahertz pulse imaging in reflection geometry of human skin cancer and skin tissue,”
Phys. Med. Biol., 47
(21), 3853
–3863
(2002). https://doi.org/10.1088/0031-9155/47/21/325 Google Scholar
R. M. Woodward, V. P. Wallace, R. J. Pye, B. E. Cole, D. D. Arnone, E. H. Linfield, and
M. Pepper,
“Terahertz pulse imaging of ex vivo basal cell carcinoma,”
J. Invest. Dermatol., 120
(1), 72
–78
(2003). https://doi.org/10.1046/j.1523-1747.2003.12013.x Google Scholar
G. Png, J. Choi, B. Ng, S. Mickan, D. Abbott, and
X. Zhang,
“The impact of hydration changes in fresh bio-tissue on THz spectroscopic measurements,”
Phys. Med. Biol., 53
(13), 3501
(2008). https://doi.org/10.1088/0031-9155/53/13/007 Google Scholar
R. S. Singh, P. Tewari, J. L. Bourges, J. P. Hubschman, D. B. Bennett, Z. D. Taylor, H. Lee, E. R. Brown, W. S. Grundfest, and
M. O. Culjat,
“Terahertz sensing of corneal hydration,”
Proc. IEEE Conf. Eng. Med. Biol. Soc., 1 3021
–3024
(2010). https://doi.org/10.1109/IEMBS.2010.5626146 Google Scholar
J. Y. Suen, P. Tewari, Z. D. Taylor, W. S. Grundfest, H. Lee, E. R. Brown, M. O. Culjat, and
R. S. Singh,
“Towards medical terahertz sensing of skin hydration,”
Stud. Health Technol Inform., 142 364
–368
(2009). https://doi.org/10.1117/12.816433 Google Scholar
J. P. Dougherty, G. D. Jubic, and
J. W. L. Kiser,
“Terahertz imaging of burned tissue,”
Proc. SPIE, 6472 64720N
(2007). https://doi.org/10.1117/12.705137 Google Scholar
Z. D. Taylor, R. S. Singh, M. O. Culjat, J. Y. Suen, W. S. Grundfest, H. Lee, and
E. R. Brown,
“Reflective terahertz imaging of porcine skin burns,”
Opt. Lett., 33
(11), 1258
–1260
(2008). https://doi.org/10.1364/OL.33.001258 Google Scholar
D. M. Mittleman, M. Gupta, R. Neelamani, R. G. Baraniuk, J. V. Rudd, and
M. Koch,
“Recent advances in terahertz imaging,”
Appl. Phys. B: Lasers Opt., 68
(6), 1085
–1094
(1999). https://doi.org/10.1007/s003400050750 Google Scholar
R. S. Singh, Z. D. Taylor, M. O. Culjat, W. S. Grundfest, and
E. R. Brown,
“Towards THz medical imaging; reflective imaging of animal tissues,”
Stud. Health Technol. Inform., 132 472
–474
(2008). https://doi.org/10.1117/12.785337 Google Scholar
W. L. Chan, J. Deibel, and
D. M. Mittleman,
“Imaging with terahertz radiation,”
Rep. Prog. Phys., 70
(8), 1325
–1379
(2007). https://doi.org/10.1088/0034-4885/70/8/R02 Google Scholar
R. Bogue,
“Terahertz imaging: a report on progress,”
Sens. Rev., 29
(1), 6
–12
(2009). https://doi.org/10.1108/02602280910926706 Google Scholar
A. Dobroiu, C. Otani, and
K. Kawase,
“Terahertz-wave sources and imaging applications,”
Meas. Sci. Technol., 17
(11), R161
–R174
(2006). https://doi.org/10.1088/0957-0233/17/11/R01 Google Scholar
H.-B. Liu, Y. Chen, G. J. Bastiaans, and
X. C. Zhang,
“Detection and identification of explosive RDX by THz diffuse reflection spectroscopy,”
Opt. Express, 14
(1), 415
–423
(2006). https://doi.org/10.1364/OPEX.14.000415 Google Scholar
J. F. Federici, B. Schulkin, F. Huang, D. Gary, R. Barat, F. Oliveira, and
D. Zimdars,
“THz imaging and sensing for security applications: explosives, weapons and drugs,”
Semicond. Sci. Technol., 20
(7), S266
–S280
(2005). https://doi.org/10.1088/0268-1242/20/7/018 Google Scholar
K. Kawase, Y. Ogawa, Y. Watanabe, and
H. Inoue,
“Non-destructive terahertz imaging of illicit drugs using spectral fingerprints,”
Opt. Express, 11
(20), 2549
–2554
(2003). https://doi.org/10.1364/OE.11.002549 Google Scholar
J. T. Kindt and
C. A. Schmuttenmaer,
“Far-infrared dielectric properties of polar liquids probed by femtosecond terahertz pulse spectroscopy,”
J. Phys. Chem., 100
(24), 10373
–10379
(1996). https://doi.org/10.1021/jp960141g Google Scholar
D. S. Venables and
C. A. Schmuttenmaer,
“Far-infrared spectra and associated dynamics in acetonitrile–water mixtures measured with femtosecond THz pulse spectroscopy,”
J. Chem. Phys., 108
(12), 4935
–4944
(1998). https://doi.org/10.1063/1.475902 Google Scholar
P. U. Jepsen, J. K. Jensen, and
U. Moller,
“Characterization of aqueous alcohol solutions in bottles with THz reflection spectroscopy,”
Opt. Express, 16
(13), 9318
–9331
(2008). https://doi.org/10.1364/OE.16.009318 Google Scholar
B. M. Fischer,
“Broadband THz time-domain spectroscopy of biomolecules,”
Mathematics and Physics, 246 Albert-Ludwigs-Universitat, Freiburg im Bresigau
(2005). Google Scholar
P. U. Jepsen, U. Moller, and
H. Merbold,
“Investigation of aqueous alcohol and sugar solutions with reflection terahertz time-domain spectroscopy,”
Opt. Express, 15
(22), 14717
–14737
(2007). https://doi.org/10.1364/OE.15.014717 Google Scholar
U. Moller, J. R. Folkenberg, and
P. U. Jepsen,
“Dielectric properties of water in butter and water-AOT-heptane systems measured using terahertz time-domain spectroscopy,”
Appl. Spectrosc., 64
(9), 1028
–1036
(2010). https://doi.org/10.1366/000370210792434422 Google Scholar
T. Globus,
“THz-Spectroscopy of biological molecules,”
J. Biol. Phys., 29
(2), 89
–100
(2003). https://doi.org/10.1023/A:1024420104400 Google Scholar
B. M. Ladanyi and
M. S. Skaf,
“Computer simulation of hydrogen-bonding liquids,”
Annu. Rev. Phys. Chem., 44
(1), 335
–368
(1993). https://doi.org/10.1146/annurev.pc.44.100193.002003 Google Scholar
D. Russo, G. Hura, and
T. Head-Gordon,
“Hydration dynamics near a model protein surface,”
Biophys. J., 86
(3), 1852
–1862
(2004). https://doi.org/10.1016/S0006-3495(04)74252-6 Google Scholar
H. Yada, M. Nagai, and
K. Tanaka,
“Origin of the fast relaxation component of water and heavy water revealed by terahertz time-domain attenuated total reflection spectroscopy,”
Chem. Phys. Lett., 464
(4–6), 166
–170
(2008). https://doi.org/10.1016/j.cplett.2008.09.015 Google Scholar
S. K. Pal, J. Peon, and
A. H. Zewail,
“Ultrafast surface hydration dynamics and expression of protein functionality: alpha-Chymotrypsin,”
Proc. Natl. Acad. Sci. U.S.A., 99
(24), 15297
–15302
(2002). https://doi.org/10.1073/pnas.242600399 Google Scholar
S. K. Pal, J. Peon, and
A. H. Zewail,
“Biological water at the protein surface: dynamical solvation probed directly with femtosecond resolution,”
Proc. Natl. Acad. Sci. U.S.A., 99
(4), 1763
–1768
(2002). https://doi.org/10.1073/pnas.042697899 Google Scholar
S. K. Pal and
A. H. Zewail,
“Dynamics of water in biological recognition,”
Chem. Rev., 104
(4), 2099
–2123
(2004). https://doi.org/10.1021/cr020689l Google Scholar
S. K. Pal, L. Zhao, T. Xia, and
A. H. Zewail,
“Site- and sequence-selective ultrafast hydration of DNA,”
Proc. Natl. Acad. Sci. U.S.A., 100
(24), 13746
–13751
(2003). https://doi.org/10.1073/pnas.2336222100 Google Scholar
S. K. Pal, L. Zhao, and
A. H. Zewail,
“Water at DNA surfaces: ultrafast dynamics in minor groove recognition,”
Proc. Natl. Acad. Sci. U.S.A., 100
(14), 8113
–8118
(2003). https://doi.org/10.1073/pnas.1433066100 Google Scholar
M. Walther, B. Fischer, M. Schall, H. Helm, and
P. U. Jepsen,
“Far-infrared vibrational spectra of all-trans, 9-cis and 13-cis retinal measured by THz time-domain spectroscopy,”
Chem. Phys. Lett., 332
(3–4), 389
–395
(2000). https://doi.org/10.1016/S0009-2614(00)01271-9 Google Scholar
A. Xie,
“Excited-State Lifetimes of Far-Infrared Collective Modes in Proteins,”
J. Biol. Phys., 28 147
–154
(2002). https://doi.org/10.1023/A:1019986321524 Google Scholar
B. Fischer, M. Hoffmann, H. Helm, R. Wilk, F. Rutz, T. Kleine-Ostmann, M. Koch, and
P. Jepsen,
“Terahertz time-domain spectroscopy and imaging of artificial RNA,”
Opt. Express, 13
(14), 5205
–5215
(2005). https://doi.org/10.1364/OPEX.13.005205 Google Scholar
D. Segelstein,
“The Complex Refractive Index of Water,”
University of Missouri, Kansas City
(1981). Google Scholar
L. Thrane, R. H. Jacobsen, P. Uhd Jepsen, and
S. R. Keiding,
“THz reflection spectroscopy of liquid water,”
Chem. Phys. Lett., 240
(4), 330
–333
(1995). https://doi.org/10.1016/0009-2614(95)00543-D Google Scholar
P. U. Jepsen and
B. M. Fischer,
“Dynamic range in terahertz time-domain transmission and reflection spectroscopy,”
Opt. Lett., 30
(1), 29
–31
(2005). https://doi.org/10.1364/OL.30.000029 Google Scholar
P. U. Jepsen and
S. R. Keiding,
“Radiation patterns from lens-coupled terahertz antennas,”
Opt. Lett., 20
(8), 807
–809
(1995). https://doi.org/10.1364/OL.20.000807 Google Scholar
L. X. Cundin, G. J. Wilmink, and
W. P. Roach,
“Optical property of human skin,”
717517
(2009). https://doi.org/10.1117/12.805582 Google Scholar
S. Y. Huang, Y. X. Wang, D. K. Yeung, A. T. Ahuja, Y. T. Zhang, and
E. Pickwell-Macpherson,
“Tissue characterization using terahertz pulsed imaging in reflection geometry,”
Phys. Med. Biol., 54
(1), 149
–160
(2009). https://doi.org/10.1088/0031-9155/54/1/010 Google Scholar
S. Huang, P. C. Ashworth, K. W. Kan, Y. Chen, V. P. Wallace, Y. T. Zhang, and
E. Pickwell-MacPherson,
“Improved sample characterization in terahertz reflection imaging and spectroscopy,”
Opt. Express, 17
(5), 3848
–3854
(2009). https://doi.org/10.1364/OE.17.003848 Google Scholar
E. Pickwell, B. E. Cole, A. J. Fitzgerald, M. Pepper, and
V. P. Wallace,
“In vivo study of human skin using pulsed terahertz radiation,”
Phys. Med. Biol., 49
(9), 1595
–1607
(2004). https://doi.org/10.1088/0031-9155/49/9/001 Google Scholar
E. Pickwell and
V. P. Wallace,
“Biomedical applications of terahertz technology,”
J. Phys. D: Appl. Phys., 39 R301
–R310
(2006). https://doi.org/10.1088/0022-3727/39/17/R01 Google Scholar
V. P. Wallace, A. J. Fitzgerald, E. Pickwell, R. J. Pye, P. F. Taday, N. Flanagan, and
T. Ha,
“Terahertz pulsed spectroscopy of human Basal cell carcinoma,”
Appl. Spectrosc., 60
(10), 1127
–1133
(2006). https://doi.org/10.1366/000370206778664635 Google Scholar
V. P. Wallace, A. J. Fitzgerald, S. Shankar, N. Flanagan, R. Pye, J. Cluff, and
D. D. Arnone,
“Terahertz pulsed imaging of basal cell carcinoma ex vivo and in vivo,”
Br. J. Dermatol., 151
(2), 424
–432
(2004). https://doi.org/10.1111/j.1365-2133.2004.06129.x Google Scholar
Y. Sun, B. M. Fischer, and
E. Pickwell-MacPherson,
“Effects of formalin fixing on the terahertz properties of biological tissues,”
J. Biomed. Opt., 14
(6), 064017
(2009). https://doi.org/10.1117/1.3268439 Google Scholar
M. He,
“Far-infrared signature of animal tissues characterized by terahertz time-domain spectroscopy,”
Opt. Commun., 259
(1), 389
–392
(2006). https://doi.org/10.1016/j.optcom.2005.08.029 Google Scholar
A. J. Fitzgerald, E. Berry, N. N. Zinov, S. Homer-Vanniasinkam, R. E. Miles, J. M. Chamberlain, and
M. A. Smith,
“Catalogue of human tissue optical properties at terahertz frequencies,”
J. Biol. Phys., 29
(2), 123
–128
(2003). https://doi.org/10.1023/A:1024428406218 Google Scholar
D. H. Auston,
“Picosecond optoelectronic switching and gating in silicon,”
Appl. Phys. Lett., 26
(3), 101
–103
(1975). https://doi.org/10.1063/1.88079 Google Scholar
D. H. Auston, K. P. Cheung, and
P. R. Smith,
“Picosecond photoconducting Hertzian dipoles,”
Appl. Phys. Lett., 45
(3), 284
–286
(1984). https://doi.org/10.1063/1.95174 Google Scholar
X. C. Zhang, B. B. Hu, J. T. Darrow, and
D. H. Auston,
“Generation of femtosecond electromagnetic pulses from semiconductor surfaces,”
Appl. Phys. Lett., 56
(11), 1011
–1013
(1990). https://doi.org/10.1063/1.102601 Google Scholar
C. Fattinger and
D. Grischkowsky,
“Terahertz beams,”
Appl. Phys. Lett., 54 490
–492
(1989). https://doi.org/10.1063/1.100958 Google Scholar
J. Barthel, K. Bachhuber,
“Dielectric spectra of some common solvents in the microwave region. Water and lower alcohols,”
Chem. Phys. Lett., 165 369
–373
(1990). https://doi.org/10.1016/0009-2614(90)87204-5 Google Scholar
Y. Yomogida, Y. Sato, R. Nozaki, T. Mishina, and
J. I. Nakahara,
“Comparative dielectric study of monohydric alcohols with terahertz time-domain spectroscopy,”
J. Mol. Struct., 981
(1–3), 173
–178
(2010). https://doi.org/10.1016/j.molstruc.2010.08.002 Google Scholar
M. R. Querry, D. M. Wieliczka, and
D. J. Segelstein,
“Water (H2O),”
Handbook of Optical Constants of Solids, 1059
–1077 Academic Press, London
(1991). Google Scholar
G. M. Hale and
M. R. Querry,
“Optical constants of water in the 200-nm to 200-microm wavelength region,”
Appl. Opt., 12
(3), 555
–563
(1973). https://doi.org/10.1364/AO.12.000555 Google Scholar
J. B. Hasted, S. K. Husain, F. A. M. Frescura, and
J. R. Birch,
“The temperature variation of the near millimetre wavelength optical constants of water,”
Infrared Phys., 27
(1), 11
–15
(1987). https://doi.org/10.1016/0020-0891(87)90044-3 Google Scholar
|

