
|
|
1.IntroductionThe liver is the most important organ in the body for drug metabolism and excretion.1, 2 In situ liver perfusion is the main experimental technique used to study drug distribution in the liver. In such experiments, normal physiological and/or pathological hepatic conditions can be maintained for the duration of the experiment.1 A limitation in these models is the “black box” nature of the experiments, in which physiological pharmacokinetic models are used to deduce events occurring in the organs using the observed outflow profiles.3, 4, 5, 6 We have sought to improve on this modeling by building an in silico liver that consists of a collection of flexible, hepatomimetic, in silico “cells” which are, in turn, assembled together into hepatic “lobules” and using outflow profiles to validate the predicted drug disposition in the liver.7, 8 A much more precise method of analyzing pharmacokinetic events in the liver is to directly observe them. Noninvasive fluorescence microscopy is a unique approach that can enable the direct visualization of transport and distribution of fluorescent drugs both in the liver cell and at acinus level.2, 9 It has also been used to study vital cellular processes in the liver under various conditions.10 Fluorescein (F) has been a probe in fluorescence microscopy studies for over 50 years.11, 12 It is taken up by the hepatocytes and excreted into the bile by active transport.2, 13, 14 F is metabolized within the hepatocytes to fluorescein mono-glucuronide (FG), which is also excreted into the bile by the same active transporter.15 Both chemicals present overlapping excitation and emission spectra,16 making them hardly distinguishable under the fluorescence microscope. Fluorescence lifetime imaging microscopy (FLIM) adds the capability of discriminating between various fluorophores in biological tissues on the basis of their fluorescence lifetimes.17 The fluorescence lifetimes of F and FG differ, and can be detected using FLIM and have been reported to be 3.8 to 4.1 and 2.3 ns, respectively. The lifetime of F is highly dependent on the pH of the solvent.16, 18, 19 Multiphoton microscopy (MPM) is particularly well suited to in vivo studies of drug distribution in biological tissues, as it reduces tissue damage and enhances image quality due to reduced photobleaching and increased penetration depth in the near infrared spectral range, compared with conventional fluorescence microscopy predominantly carried out in the visible spectral range.20, 21, 22 Our group has used MPM in combination with FLIM to visualize the in vivo disposition of F in rat liver.23 We found that the average fluorescence lifetime measured in bile collected 20 min after F infusion was as low as 2.7 to 2.9 ns, which was attributed to the presence of FG, the effect of protein binding, and possible Förster resonance energy transfer between F and FG.23 In this study we explored the use of MPM and FLIM to study the pharmacokinetics of the fluorescent compound, F, and its metabolite FG in rat liver in vivo. In particular, we investigated the simultaneous, real-time, in vivo distribution of F and FG in liver tissue and bile. We use in vitro fluorescence lifetime values of F and FG in different concentrations and in environments of varying protein content as a guideline to interpret our in vivo results. 2.Materials and Methods2.1.ChemicalsSodium fluorescein and β-glucuronidase (type HP-2 from Helix pomatia) were purchased from Sigma Aldrich (St. Louis, Missouri). Ketamin hydrochloride and ilium xylazile were obtained from Parnell laboratories, Australia, and Bayer Australia, Pymble NSW, Australia, respectively. All other reagents were of analytical grade and obtained from commercial sources. 2.2.AnimalsMale Wistar rats, purchased from the animal resource centre (Perth, Western Australia), weighting approximately 350 grams, were used in all experiments. They were housed in the Biological Resource Facility at the Princess Alexandra Hospital, where the temperature was maintained at 20 ± 1 °C, and humidity of 60 to 75% with artificial light for 12 h (7 am to 7 pm). 2.3.Surgical Procedures and Bile CollectionRats were initially anaesthetized by an intraperitoneal injection of xylazine 10 mg/kg and ketamine hydrochloride 80 mg/kg, supplemented throughout the experiment by administering ketamine (2.2 mg/100 g) and xylazile (0.25 mg/100 g). Animal body temperature was controlled by placing them on a heated pad set to 37 °C. The jugular vein was cleared of surrounding tissue and cannulated using PE-10 tubing for administration of sodium fluorescein. A midline laparotomy was performed, the bile duct exposed and cannulated for collection of bile. The left lobe of the liver was exposed for fluorescence imaging. The liver as well as the intraperitoneal cavity was kept moist by administering 0.9% saline solution continuously throughout the experiment. Sodium fluorescein (5.5 mg/kg) was intravenously injected. Bile was collected every 10 min until 60 min, and then every 30 min until 4 h. 2.4.High-Performance Liquid ChromatographySemipreparative high-performance liquid chromatography (HPLC) (2.4.1.) was used to prepare FG from bile samples collected after injection of F. In addition, analytical HPLC was used to quantify the concentration of F and FG in each collected bile sample (2.4.2.). 2.4.1.Fluorescein glucuronide preparation from bile samples by semipreparative HPLCBile containing a mixture of F and FG was collected from rats after F injection. Bile was mixed 3:1 with pH 6, 10 mM ammonium formate, and sufficient acetonitrile was added to make a 15% acetonitrile solution. Samples were centrifuged (5 min, 1000 rpm) and injected onto a semipreparative HPLC system with spectrophotometric detection (488 nm, Shimadzu SPD-10AV with semipreparative flow through cell). Semipreparative (Phenomenex Luna C8, 15 μm, 250×21 mm) HPLC was used to separate the components of the bile containing F and FG. Mobile phase included ammonium formate (10 mM, pH 6): acetonitrile mixtures with pump A 95:5 and pump B 5:95, respectively. A gradient elution (12 mL/min A:B, 4:1 to 7:3 over 15 min followed by 5 min at 4:1) resulted in a retention time of 6 min for FG and 15 min for F. Bile was injected as 200 μL volumes and fractions were collected at intervals of 1.5 min. Chromatographed fractions shown to contain FG were pooled, acetonitrile was rotary evaporated under vacuum, and the solvent evaporated overnight by freeze-drying. 2.4.2.Quantification of F and FG in bile samplesFor analysis of F and FG, each bile sample was diluted in 0.2 mM acetate buffer (1:100). For analysis of F, 10 μL of the dilution was added to 100 μL of 0.2 mM acetate buffer and incubated for 1 h in 37 °C water bath. To analyze the concentration of FG, 10 μL of the dilution was added to 100 μL of β-glucuronidase (10 U/100 μl) and incubated for 1 h in 37 °C water bath. This causes breakage of FG to F and the concentration measured was the total concentration of F and FG. The concentration of FG was calculated by subtracting the F concentration from the total concentration. Standard solutions were prepared from sodium fluorescein in phosphate buffered saline (PBS) and prepared in the same way as the bile samples. Mobile phase consisted of 50 mM NaH2PO4 and methanol (2:3). 10 μL of the solution was injected into the HPLC system (Shimadzu, Kyoto, Japan) for F and FG analysis. A flow rate of 1 mL/min was used with a C18 column (Agilent HC-C18 (2) 4.6×150 mm, 5 μm) that included a security guard column (Phenomex C18 4×3 mm). Fluorescence excitation and emission wavelengths were 488 and 515 nm, respectively, with 5 min retention time. The bile was collected in a pre-weighted tube, enabling calculation of the excretion rate for each compound. The excretion rate was calculated by: Eq. 1[TeX:] \documentclass[12pt]{minimal}\begin{document}\begin{eqnarray} &&\hspace*{-15pt}{\rm Excretion\ rate} ({{{\rm \mu mol}}}/{{\min }})\nonumber\\ &&\hspace*{-15pt}\quad= \left(\frac{{{\rm concentration}\, \times\, {\rm bile\ weight}}}{{{\rm molecular\ weight}}}\right) /{\rm collection\ time}{\rm.} \end{eqnarray}\end{document}2.5.Solution Preparation for MicroscopySodium fluorescein and fluorescein glucuronide were each dissolved in PBS (pH 7.4), 4% bovine serum albumin (BSA, pH 7.4), and bile obtained from rats. The concentration of F was 0.11 mg/mL in PBS and BSA and 11 mg/mL in bile. The concentration of FG was 11 mg/mL in BSA and PBS, and 55 mg/mL in bile. Each solution was incubated for 1 h in 37 °C water-bath for equilibration. 2.6.Multiphoton Imaging and Fluorescence Lifetime MeasurementsMPM was performed using a DermaInspect system (JenLab GmbH, Jena, Germany) equipped with an ultrashort (pulse width, 85 femtosecond, repetition rate 80-MHz) pulsed mode-locked tunable Titanium:Sapphire laser (MaiTai, Spectra Physics, 25 Mountain View, USA). The excitation wavelength of 920 nm was used for the detection of F and FG. A bandpass filter (BG39) was employed to detect fluorescence emission in the spectral range of 350 to 650 nm. The laser power was 15 mW for in vivo imaging, 81 mW for imaging of F and FG in vitro in PBS and BSA, 11 and 30 mW for imaging of F and FG in bile, respectively. FLIM was performed using a TCSPC830 detection module (Becker and Hickl, Berlin, Germany) characterized by the time resolution of 100 ps. FLIM data of F and FG were detected in the emission range of 515 to 620 nm. Images were acquired up to 4 h after injection of sodium fluorescein. 2.7.Data Analysis2.7.1.SPCImage – fluorescence lifetime calculationFluorescence lifetime images were analyzed using SPCImage (Becker and Hickl, Berlin, Germany). Each pixel of a given fluorescence lifetime image contains photon decay data, to which an exponential function is fitted in order to retrieve the fluorescence lifetime value(s). These lifetimes characterize the decay and, by extension, the fluorophore(s) present in the sample. The bin number n in SPCImage defines the number of adjacent pixels where photon decay data is used to obtain a photon decay curve and calculate the lifetime(s) of a given pixel. The advantage of using adjacent pixels is a reduction in the noise of the calculated lifetime, at the expense of calculated lifetime precision.24 The bin number n is calculated according to the formula24 Eq. 2[TeX:] \documentclass[12pt]{minimal}\begin{document}\begin{equation} \# {\rm binned}\,{\rm pixels} = \left({2n + 1} \right) \times \left({2n + 1} \right). \end{equation}\end{document}We found n = 3 to be appropriate for our in vitro and in vivo images and set this bin number prior to fitting. After setting the bin number, we fitted the photon decay data F(t) of each image to either a mono-exponential [Eq. 3a] or a bi-exponential decay function [Eq. 3b]: Eq. 3a[TeX:] \documentclass[12pt]{minimal}\begin{document}\begin{equation} F\left(t \right) = \alpha _1 e^{ - t/\tau _1 }, \end{equation}\end{document}Eq. 3b[TeX:] \documentclass[12pt]{minimal}\begin{document}\begin{equation} F\left(t \right) = \alpha _1 e^{ - t/\tau _1 } + \alpha _2 e^{ - t/\tau _2 }. \end{equation}\end{document}In Eqs. 3a, 3b, the parameter τ i designates the fluorescence lifetime of fluorophore i.25 A fit to a mono-exponential decay function, yields a single lifetime. A fit to a bi-exponential decay function yields two separate fluorescence lifetimes [τ 1 and τ 2 in Eq. 3b], which can be used to distinguish between two fluorophores present in the sample. To determine the suitability of a mono- or bi-exponential fit for the pixels of a given image, we used the reduced chi-square coefficient (X2) calculated in SPCImage. Fluorescence lifetimes reported here are the mean ± standard deviation of the mean (SEM) of the values measured at the highest-intensity pixel in all images. 2.7.2.Matlab – for segmentation of fluorescence lifetime in different regionsAfter calculation of the fluorescence lifetimes in SPCImage, the decay matrices containing fit parameters and photon numbers were exported from SPCImage and imported into Matlab for further processing and segmentation. Photon numbers displayed as indexed grayscale images were segmented into three regions of interest namely blood, bile, and cells using a semi-automated intensity threshold approach. Mean values of lifetimes were calculated in each region. 2.8.Statistical AnalysisA t-test (paired, two tailed) was used to calculate the p-value when two groups were compared and one way analysis of variance with Tukey's multiple comparison test when three of more groups were compared. Results were considered statistically significant with a p-value ≤ 0.05. 3.Results3.1.In vitroThe fluorescence decay profiles obtained from F and FG individually mixed in PBS were best fitted to a mono-exponential decay function [Fig. 1a], yielding a single lifetime. Control bile fluorescence profiles, on the other hand, were best fitted using a bi-exponential decay function, yielding two lifetimes [Fig. 1b]. Table 1 shows the mean in vitro lifetimes of F and FG along with the lifetimes of control bile. The mean lifetimes of F in PBS, BSA, and bile were 3.48 ± 0.02, 3.08 ± 0.07, and 3.41 ± 0.01 ns, respectively. The mean lifetimes of FG were 2.36 ± 0.01 ns in PBS, 2.39 ± 0.03 in BSA, and 2.30 ± 0.01 ns in bile. No fluorescence was detected from control solutions of PBS and BSA. Fluorescence from a control bile solution was only detected at a significantly higher laser power and showed a bi-exponential decay, with a fast lifetime equal to 0.29 ± 0.002 ns and a slower lifetime of 2.62 ± 0.01 ns. Fluorescence lifetime imaging was also performed for mixtures of known concentrations of FG and F in PBS. For each ratio of concentrations, the fluorescence decay profiles were best fit to a mono-exponential decay function, yielding a single lifetime. The lifetime significantly decreased compared to the lifetime of F alone in PBS with increasing FG concentration from 3.3 ± 0.01 ns for a FG:F ratio of 10:1, to 2.5 ± 0.01 ns for an FG:F ratio of 5000:1 (Fig. 2). Fig. 1Representative fluorescence measurement data and fitting curves. (a) Single lifetime fluorescence decay from a solution of fluorescein in PBS. Fitting the data to a mono-exponential function yields a single lifetime characteristic of fluorescein. (b) Two-lifetime fluorescence decay of control bile tissue to which a bi-exponential function is fitted to obtain two lifetimes. 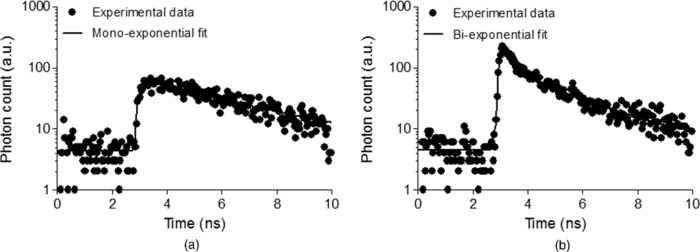 Fig. 2Average lifetimes (mean ± SEM, n = 3) obtained from mixtures of FG and F in PBS at varying FG:F concentration ratios. 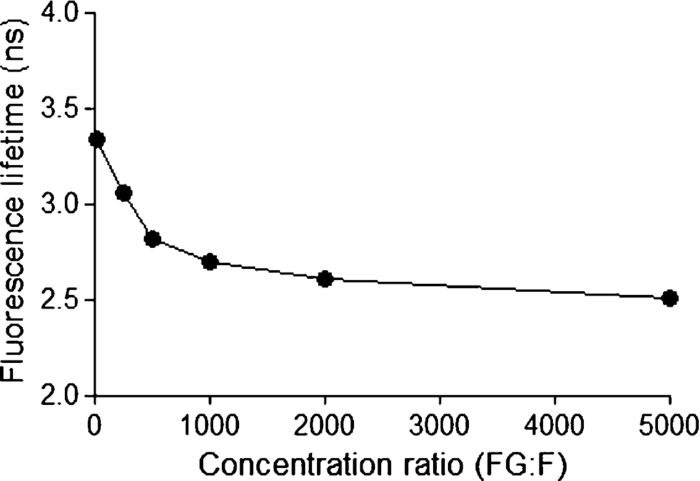 Table 1In vitro mean fluorescence lifetimes (±SEM) from fluorescein (F) and fluorescein mono-glucuronide (FG) solutions and from bile control solution. (# = p < 0.05 compared to F in PBS; * = p < 0.05 compared to fluorescein; $ = p < 0.05 compared to FG in PBS.)
3.2.In vivoFluorescence intensity of F and FG was quickly and evenly distributed across the liver cells and acinus (Figs. 3, 4). Fluorescence levels above the baseline tissue autofluorescence were initially detected in the periportal region and distributed over the entire acinus within 1 min after F injection (Fig. 3). Zonal differences in uptake and excretion were not observed. Using a four-fold higher magnification it was possible to distinguish hepatocytes, bile, and sinusoids (Fig. 4). Fig. 3Multiphoton microscopy intensity images showing F and FG distribution in liver acinus of one rat following fluorescein injection.  Fig. 4Multiphoton microscopy intensity images showing intracellular distribution of F and FG in liver tissue of one rat following fluorescein injection. The hollow arrow shows hepatocytes; the solid and thin white arrows point to bile duct and sinusoids, respectively.  The cumulative biliary excretion of FG was higher than that for F from 30 min after injection and onward [Fig. 5a]. The excretion rate for FG was higher than F after 30 min and continued to be higher until the end of the experiment [Fig. 5b]. Fig. 5(a) Cumulative amounts (μmol) and (b) biliary excretion rate (nmol/min) of F and FG in collected bile (mean ± SEM, n = 3).  Fluorescence lifetime images obtained from the liver tissue had photon decay profiles which were best fit by a mono-exponential function [Eq. 3a], yielding a single lifetime at each time point after F injection. Figure 6a shows lifetimes calculated from segmentation of the liver tissue images into blood, liver cells, and bile. At the 20 min time point following F injection, the mean lifetimes in the liver tissue, blood, and bile ducts were 3.1 ± 0.07, 3.1 ± 0.04, and 3.1 ± 0.04 ns, respectively. At the 20 min time point, the mean lifetimes were 2.8 ± 0.05, 2.8 ± 0.02, and 2.7 ± 0.03 ns, respectively. Fig. 6Mean fluorescence lifetime measured in (a) liver tissue and (b) collected bile in vivo after sodium fluorescein injection (mean ± SEM, n = 3). 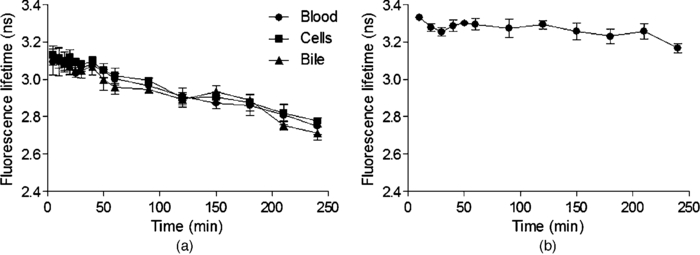 A sample of the collected bile was imaged by MPM-FLIM and its lifetime calculated. Figure 6b shows that the single lifetime measured in the collected bile is essentially constant over the duration of the perfusion, with 3.3 ± 0.01 ns 20 min after injection and 3.2 ± 0.03 ns 4 h after injection. 4.DiscussionF and FG have overlapping spectral signals,26 making it difficult to spectrally distinguish them. Their time-resolved fluorescence decay patterns, however, differ. Fluorescence lifetime measurements have been used to segregate different protomers of fluorescein27 and differentiate F and FG in eye research.16 The combination of multiphoton microscopy (MPM) and fluorescence lifetime imaging microscopy (FLIM) has been employed to study cellular redox states and metabolism,28, 29 the penetration of exogenous compounds into skin,23, 28 and as a diagnostic tool for skin lesions and cancers.30 In liver studies, it has been used to obtain high-resolution in vivo images of carboxyfluorescein diacetate (CFDA) uptake into hepatocytes and excretion into the bile canaliculi31 and to study the kinetics of CFDA distribution in liver with obstructive cholestasis.32 In this study, we employed MPM-FLIM to track and quantify real-time metabolic activity in the rat liver in vivo. The in vitro lifetime of F in PBS (3.5 ns) is of the same order of magnitude as values in aqueous solutions reported by others.16, 33, 34 The lifetime of F decreases with increasing protein content of the medium. The lower value of 3.08 ns in BSA most likely reflects binding to protein23 or quenching,35 which can be measured as a decrease in fluorescence intensity or lifetime.36 The in vitro lifetime of FG in PBS (2.4 ns) agrees with that reported by Larsen 16 Although FG has high affinity for plasma proteins,37 the lifetime did not significantly change in BSA solution compared to PBS or bile. Fluorescence data from mixtures of FG and F in ratios ranging from 10:1 to 5000:1 exhibited a single lifetime (Fig. 2). At low FG:F ratios we expect photon absorption and emission by FG to be masked by that of F, due to the lower quantum yield of FG compared to F.38 However, the lifetime was significantly decreased from FG:F ratios of 10:1 to 5000:1 compared to the lifetime of F alone in PBS. The decrease in lifetime is due to an increase in FG concentration. Collected bile samples without F or FG showed fluorescence at high laser power, where the fast and slow lifetimes in bile are likely to be due to bilirubin (Table 1). Bilirubin has the same excitation and emission range as F and can interfere with the F signal at high concentrations, as in bile and liver tissue.39 It has been shown to have a fast (0.03 to 0.30 ns) and slow lifetime (1.0 to 2.3 ns).40 The slow lifetime of bilirubin is similar to the lifetime of FG. However, fluorescence from bile was only seen at high laser powers (81 mW) and there was no measurable fluorescence of bile or liver tissue at the laser powers used in this study. In addition, since bilirubin has a low quantum yield,41 its fluorescence in liver in vivo was considered insignificant. The cumulative biliary excretion in the collected bile samples shows the total amount of F and FG excreted by the liver. At 30 min after injection, the amount excreted was higher for FG than for F and remained so until the end of the experiment. In addition, the excretion rate of FG was higher than F. This could be explained by a higher rate of excretion for FG than F by the active transport system in the liver. Glucuronidation of a molecule, such as F, is a metabolic process enhancing the excretion by making the molecule more hydrophilic.42 In the case of F and FG the octanol:water partition coefficients are 0.7 and 0.04, respectively.15 The initial analysis of the fluorescence lifetime in liver tissue in vivo exhibited fluorescence decay data that could be appropriately fit only to a mono-exponential decay function [Eq. 3a], thus yielding only one characteristic lifetime at each time point after F injection. The mean lifetimes in sinusoids, hepatocytes, and bile were calculated from the liver cell images by selecting the appropriate areas. The mean lifetimes decreased over time from 3.1 ns, 20 min after injection, to 2.7 to 2.8 ns, 240 min after injection in all three regions [Fig. 6a]. In collected bile, however, the decrease in lifetime was not as pronounced, although significantly decreased at 240 min compared to 20 min [Fig. 6b]. A possible explanation to why we see a decrease in lifetime in the liver images, but not in the excreted bile, could be due to a higher concentration ratio of FG:F in the liver compared to the collected bile. As seen in Fig. 2, for the lifetime to decrease a 10 times higher concentration ratio of FG:F is necessary. As seen in Fig. 5a, the concentration of FG is only about twice the concentration of F at any given time, which could explain why we did not see any pronounced decrease of lifetime in excreted bile. In this study, we present a simple noninvasive imaging technique of cellular processes in space and time using MPM and FLIM. Whereas our previous studies have represented the changes in drug and metabolite disposition in the liver using a physiological pharmacokinetic based model at a global level,43, 44, 45 it is evident from this work that a more complex model able to describe events occurring at a cellular and acinar level in both space and time is needed. A limitation of this study is the lack of quantitative information of the concentration of F and FG in the liver over time. One of our next challenges will be to further develop a synthetic model to describe events based on liver outflow profiles in normal46, 47 and diseased states.48 This would help us explain what occurs in the liver in space and time with noninvasive imaging using MPM with FLIM. 5.ConclusionWe have presented a novel method of studying metabolism of fluorescein in the liver in vivo using multiphoton microscopy in combination with fluorescence lifetime imaging. Current work in our group focuses on improving the data analysis of the liver images in selecting the regions of interest and to improve the sensitivity to detect molecules with lower quantum yields. The reported MPM-FLIM methodology enables study of zonal differences in metabolism and pharmacokinetics in healthy and diseased livers. AcknowledgmentsWe are grateful to the National Health and Medical Research Council (Australia) for a grant that supported this study. We also thank Professor Anthony Hunt from University of California, San Francisco, for professional advice. ReferencesP. Li, G. J. Wang, T. Robertson, and
M. S. Roberts,
“Liver transporters in hepatic drug disposition: an update,”
Curr. Drug Metab., 10
(5), 482
–498
(2009). https://doi.org/10.2174/138920009788898037 Google Scholar
I. A. Sherman and
M. M. Fisher,
“Hepatic transport of fluorescent molecules: in vivo studies using intravital TV microscopy,”
Hepatology, 6
(3), 444
–449
(1986). Google Scholar
P. Li, T. A. Robertson, C. A. Thorling, Q. Zhang, L. M. Fletcher, D. H. Crawford, and
M. S. Roberts,
“Hepatic pharmacokinetics of cationic drugs in a high-fat emulsion-induced rat model of nonalcoholic steatohepatitis,”
Drug Metab. Dispos., 39
(4), 571
–579
(2011). https://doi.org/10.1124/dmd.110.036806 Google Scholar
M. S. Roberts, X. Liu, Y. Zou, G. A. Siebert, P. Chang, M. W. Whitehouse, L. Fletcher, and
D. H. Crawford,
“Effect of adjuvant-induced systemic inflammation in rats on hepatic disposition kinetics of taurocholate,”
Am. J. Physiol. Gastrointest. Liver Physiol., 300
(1), G130
–G136
(2011). https://doi.org/10.1152/ajpgi.00162.2010 Google Scholar
Y. H. Zou, X. Liu, A. M. Khlentzos, P. Asadian, P. Li, C. A. Thorling, T. A. Robertson, L. M. Fletcher, D. H. Crawford, and
M. S. Roberts,
“Liver fibrosis impairs hepatic pharmacokinetics of liver transplant drugs in the rat model,”
Drug Metab. Pharmacokinet, 25
(5), 442
–449
(2010). https://doi.org/10.2133/dmpk.DMPK-10-RG-031 Google Scholar
M. Weiss, P. Li, and
M. S. Roberts,
“An improved nonlinear model describing the hepatic pharmacokinetics of digoxin: evidence for two functionally different uptake systems and saturable binding,”
Pharmacol. Res., 27
(9), 1999
–2007
(2010). https://doi.org/10.1007/s11095-010-0204-9 Google Scholar
L. Yan, C. A. Hunt, G. E. Ropella, and
M. S. Roberts,
“In silico representation of the liver-connecting function to anatomy, physiology and heterogeneous microenvironments,”
Conf. Proc. IEEE Eng. Med. Biol. Soc., 2 853
–856
(2004). https://doi.org/10.1109/IEMBS.2004.1403292 Google Scholar
S. Park, G. E. Ropella, S. H. Kim, M. S. Roberts, and
C. A. Hunt,
“Computational strategies unravel and trace how liver disease changes hepatic drug disposition,”
J. Pharmacol. Exp. Ther., 328
(1), 294
–305
(2009). https://doi.org/10.1124/jpet.108.142497 Google Scholar
R. Schmidt and
H. P. Buscher,
“Hepatic uptake of fluorescein, investigated by video fluorescence microscopy and digital image analysis,”
J. Hepatol., 13
(2), 208
–212
(1991). https://doi.org/10.1016/0168-8278(91)90816-T Google Scholar
N. Watanabe, S. Kojima, S. Takashimizu, Y. Nishizaki, T. Kagawa, and
M. J. Phillips,
“Initial site of bile regurgitation following extrahepatic biliary obstruction in living rats,”
J. Gastroenterol. Hepatol, 22
(11), 1983
–1992
(2007). https://doi.org/10.1111/j.1440-1746.2006.04623.x Google Scholar
V. Hanzon,
“Liver cell secretion under normal and pathologic conditions studied by fluorescence microscopy on living rats,”
Acta Physiol. Scand. Suppl., 28
(101), 1
–268
(1952). Google Scholar
A. L. Grafflin and
E. H. Bagley,
“Studies of hepatic structure and function by fluorescence microscopy,”
Bull Johns Hopkins Hosp., 90
(6), 395
–437
(1952). Google Scholar
Y. Liu, H. C. Chen, S. M. Yang, T. L. Sun, W. Lo, L. L. Chiou, G. T. Huang, C. Y. Dong, and
H. S. Lee,
“Visualization of hepatobiliary excretory function by intravital multiphoton microscopy,”
J. Biomed. Opt., 12
(1), 014014
(2007). https://doi.org/10.1117/1.2710237 Google Scholar
D. H. Sweet, S. A. Eraly, D. A. Vaughn, K. T. Bush, and
S. K. Nigam,
“Organic anion and cation transporter expression and function during embryonic kidney development and in organ culture models,”
Kidney Int., 69
(5), 837
–845
(2006). https://doi.org/10.1038/sj.ki.5000170 Google Scholar
D. Grotte, V. Mattox, and
R. F. Brubaker,
“Fluorescein glucuronide: can this metabolite interfere with fluorescein tracer studies,”
Trans. Am. Ophthalmol. Soc., 81 125
–129
(1983). Google Scholar
M. Larsen and
L. B. Johansson,
“Time-resolved fluorescence properties of fluorescein and fluorescein glucuronide,”
Exp. Eye Res., 48
(4), 477
–485
(1989). https://doi.org/10.1016/0014-4835(89)90031-6 Google Scholar
D. Chorvat and
A. Chorvatova,
“Multi-wavelength fluorescence lifetime spectroscopy: a new approach to the study of endogenous fluorescence in living cells and tissues,”
Laser Phys. Lett., 6
(3), 175
–193
(2009). https://doi.org/10.1002/lapl.200810132 Google Scholar
H. Elmgren,
“The fluorescence lifetime of free and conjugated fluorescein in various environments,”
J. Polymer Sci.: Polymer Letters Edition., 18 815
–822
(1980). https://doi.org/10.1002/pol.1980.130181212 Google Scholar
M. Hammer, D. Schweitzer, S. Richter, and
E. Konigsdorffer,
“Sodium fluorescein as a retinal pH indicator,”
Physiol. Meas., 26
(4), N9
–N12
(2005). https://doi.org/10.1088/0967-3334/26/4/N01 Google Scholar
K. W. Dunn and
P. A. Young,
“Principles of multiphoton microscopy,”
Nephron Exp. Nephrol., 103
(2), e33
–e40
(2006). https://doi.org/10.1159/000090614 Google Scholar
H. S. Lee, Y. Liu, H. C. Chen, L. L. Chiou, G. T. Huang, W. Lo, and
C. Y. Dong,
“Optical biopsy of liver fibrosis by use of multiphoton microscopy,”
Opt. Lett., 29
(22), 2614
–2616
(2004). https://doi.org/10.1364/OL.29.002614 Google Scholar
R. M. Williams, W. R. Zipfel, and
W. W. Webb,
“Multiphoton microscopy in biological research,”
Curr. Opin. Chem. Biol., 5
(5), 603
–608
(2001). https://doi.org/10.1016/S1367-5931(00)00241-6 Google Scholar
M. S. Roberts, M. J. Roberts, T. A. Robertson, W. Sanchez, C. Thorling, Y. H. Zou, X. Zhao, W. Becker, and
A. V. Zvyagin,
“In vitro and in vivo imaging of xenobiotic transport in human skin and in the rat liver,”
J. Biophoton., 1
(6), 478
–493
(2008). https://doi.org/10.1002/jbio.200810058 Google Scholar
W. Becker and
H. Hickl, DCS-120 Confocal Scanning FLIM Systems, Becker & Hickl GmbH, Berlin
(2009). Google Scholar
M. S. Roberts, Y. Dancik, T. W. Prow, C. A. Thorling, L. L. Lin, J. E. Grice, T. A. Robertson, K. Konig, and
W. Becker,
“Non-invasive imaging of skin physiology and percutaneous penetration using fluorescence spectral and lifetime imaging with multiphoton and confocal microscopy,”
Eur. J. Pharm. Biopharm., 77
(3), 469
–488
(2011). https://doi.org/10.1016/j.ejpb.2010.12.023 Google Scholar
D. Grotte, V. Mattox, and
R. Brubaker,
“Fluorescent, physiological and pharmacokinetic properties of fluorescein glucuronide,”
Exp. Eye Res., 40
(1), 23
–33
(1985). https://doi.org/10.1016/0014-4835(85)90105-8 Google Scholar
S. W. Klonis N,
“Spectral properties of the protopic forms of fluorescein in aqueous solution,”
J. Fluoresc., 6
(3), 147
–157
(1996). https://doi.org/10.1007/BF00732054 Google Scholar
M. C. Skala, K. M. Riching, D. K. Bird, A. Gendron-Fitzpatrick, J. Eickhoff, K. W. Eliceiri, P. J. Keely, and
N. Ramanujam,
“In vivo multiphoton fluorescence lifetime imaging of protein-bound and free nicotinamide adenine dinucleotide in normal and precancerous epithelia,”
J. Biomed. Opt., 12
(2), 024014
(2007). https://doi.org/10.1117/1.2717503 Google Scholar
R. Niesner, B. Peker, P. Schlusche, and
K. H. Gericke,
“Noniterative biexponential fluorescence lifetime imaging in the investigation of cellular metabolism by means of NAD(P)H autofluorescence,”
ChemPhysChem, 5
(8), 1141
–1149
(2004). https://doi.org/10.1002/cphc.200400066 Google Scholar
R. Cicchi, S. Sestini, V. De Giorgi, D. Massi, T. Lotti, and
F. S. Pavone,
“Nonlinear laser imaging of skin lesions,”
J. Biophoton., 1
(1), 62
–73
(2008). https://doi.org/10.1002/jbio.200710003 Google Scholar
Y. Liu, H. C. Chen, S. M. Yang, T. L. Sun, W. Lo, L. L. Chiou, G. T. Huang, C. Y. Dong, and
H. S. Lee,
“Visualization of hepatobiliary excretory function by intravital multiphoton microscopy,”
J. Biomed. Opt., 12
(1), 014014
(2007). https://doi.org/10.1117/1.2710237 Google Scholar
F. C. Li, Y. Liu, G. T. Huang, L. L. Chiou, J. H. Liang, T. L. Sun, C. Y. Dong, and
H. S. Lee,
“In vivo dynamic metabolic imaging of obstructive cholestasis in mice,”
Am. J. Physiol. Gastrointest. Liver Physiol., 296
(5), G1091
–G1097
(2009). https://doi.org/10.1152/ajpgi.90681.2008 Google Scholar
M. Arik, N. Celebi, and
Y. Onganer,
“Fluorescence quenching of fluorescein with molecular oxygen in solution,”
J. Photochem. Photobiol., A, 170
(2), 105
–111
(2005). https://doi.org/10.1016/j.jphotochem.2004.07.004 Google Scholar
D. Magde, G. E. Rojas, and
P. G. Seybold,
“Solvent dependence of the fluorescence lifetimes of xanthene dyes,”
Photochem. Photobiol., 70
(5), 737
–744
(1999). https://doi.org/10.1111/j.1751-1097.1999.tb08277.x Google Scholar
J. R. Lakowicz, J. Malicka, S. D’Auria, and
I. Gryczynski,
“Release of the self-quenching of fluorescence near silver metallic surfaces,”
Anal. Biochem., 320
(1), 13
–20
(2003). https://doi.org/10.1016/S0003-2697(03)00351-8 Google Scholar
M. R. Eftink and
C. A. Ghiron,
“Fluorescence quenching studies with proteins,”
Anal. Biochem., 114
(2), 199
–227
(1981). https://doi.org/10.1016/0003-2697(81)90474-7 Google Scholar
P. S. Chahal, M. J. Neal, and
E. M. Kohner,
“Metabolism of fluorescein after intravenous administration,”
Invest. Ophthalmol. Vis. Sci., 26
(5), 764
–768
(1985). Google Scholar
N. P. Blair, M. A. Evans, T. S. Lesar, and
M. Willett,
“Plasma fluorescein and fluorescein glucuronide in patients with selected eye diseases,”
Graefe's Arch. Clin. Exp. Ophthalmol., 227
(2), 114
–117
(1989). https://doi.org/10.1007/BF02169781 Google Scholar
F. V. Bright, G. H. Vickers, and
G. M. Hieftje,
“Use of time resolution to eliminate bilirubin interference in the determination of fluorescein,”
Anal. Chem., 58
(6), 1225
–1227
(1986). https://doi.org/10.1021/ac00297a056 Google Scholar
C. D. Tran and
G. S. Beddard,
“Excited state properties of bilirubin and its photoproducts using picosecond flourescence and ciruclarly polarized luminescence spectroscopy,”
Biochim. Biophys. Acta, 678
(3), 497
–504
(1981). https://doi.org/10.1016/0304-4165(81)90131-8 Google Scholar
B. Zietz, A. N. Macphersona, and
T. Gillbro,
“Resolution of ultrafast excited state kinetics of bilirubin in chloroform and bound to human serum albumin,”
Phys. Chem. Chem. Phys., 6
(19), 4535
–4537
(2004). https://doi.org/10.1039/b409840d Google Scholar
B. L. Coffman, C. D. King, G. R. Rios, and
T. R. Tephly,
“The glucuronidation of opioids, other xenobiotics, and androgens by human UGT2B7Y(268) and UGT2B7H(268),”
Drug Metab. Dispos., 26
(1), 73
–77
(1998). Google Scholar
D. Y. Hung, P. Chang, K. Cheung, B. McWhinney, P. P. Masci, M. Weiss, and
M. S. Roberts,
“Cationic drug pharmacokinetics in diseased livers determined by fibrosis index, hepatic protein content, microsomal activity, and nature of drug,”
J. Pharmacol. Exp. Ther., 301
(3), 1079
–1087
(2002). https://doi.org/10.1124/jpet.301.3.1079 Google Scholar
D. Y. Hung, P. Chang, M. Weiss, and
M. S. Roberts,
“Structure-hepatic disposition relationships for cationic drugs in isolated perfused rat livers: transmembrane exchange and cytoplasmic binding process,”
J. Pharmacol. Exp Ther., 297
(2), 780
–789
(2001). Google Scholar
M. Weiss, O. Kuhlmann, D. Y. Hung, and
M. S. Roberts,
“Cytoplasmic binding and disposition kinetics of diclofenac in the isolated perfused rat liver,”
Br. J. Pharmacol., 130
(6), 1331
–1338
(2000). https://doi.org/10.1038/sj.bjp.0703448 Google Scholar
C. A. Hunt, G. E. Ropella, L. Yan, D. Y. Hung, and
M. S. Roberts,
“Physiologically based synthetic models of hepatic disposition,”
J. Pharmacokinet Pharmacodyn., 33
(6), 737
–772
(2006). https://doi.org/10.1007/s10928-006-9031-3 Google Scholar
L. Yan, G. E. Ropella, S. Park, M. S. Roberts, and
C. A. Hunt,
“Modeling and simulation of hepatic drug disposition using a physiologically based, multi-agent in silico liver,”
Pharm. Res., 25
(5), 1023
–1036
(2008). https://doi.org/10.1007/s11095-007-9494-y Google Scholar
S. Park, S. H. Kim, G. E. Ropella, M. S. Roberts, and
C. A. Hunt,
“Tracing multiscale mechanisms of drug disposition in normal and diseased livers,”
J. Pharmacol. Exp. Ther., 334
(1), 124
–136
(2010). https://doi.org/10.1124/jpet.110.168526 Google Scholar
|


