|
|
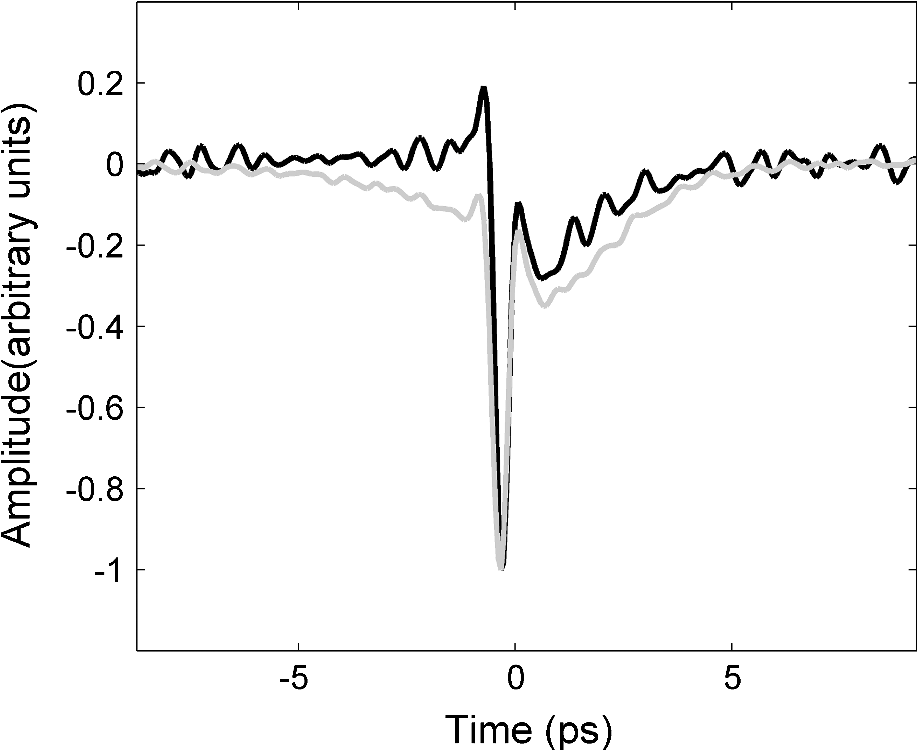
1.IntroductionBased on current statistics one in eight women will contract breast cancer making it the second most common form of cancer among women and the third leading cause of death from cancer after lung and colon cancers.1 Approximately 70% of women diagnosed will undergo breast conserving surgery, which entails removal of the cancer with a view to achieving a microscopic margin of clearance of 2 mm or more thereby preserving as much healthy breast tissue as possible.2 Localization of the tissue to be removed is often through mammography, ultrasound, wire-guided (for impalpable lesions), intraoperative postexcision imaging, and manual palpation with the surgeon attempting to cut a clear margin around the tumor. If, on histologic inspection, diseased tissue is found at the margin or within 2 mm of the surface of the resected tissue, current protocol at Guy’s Hospital, London recommends that patients should undergo a re-excision to ensure adequate clearance of tumor. Failure to remove the entire cancer with an adequate margin of normal tissue occurs in about 20% to 30% of cases,3 resulting in an increased risk of local recurrence unless a second operation is undertaken to remove additional tissue. This potentially causes further morbidity, poorer cosmetic result, a delay in giving adjuvant therapy, increased risk of wound infection, a potential reduction in survival rates, and increased cost to healthcare systems. Thus, there is a clinical need to accurately define regions of tumor during surgery, to conserve normal tissue, and minimize the number of second surgical procedures. There are a number of techniques, either in current usage, in clinical trials, or in the research phase for use preoperatively or intraoperatively that propose to reduce the number of second procedures. Hook wires, intraoperative frozen sections, and specimen x-rays are all used clinically but each has a limitation typically being a lack of specificity or high cost.2 Other techniques are being investigated; for example, spectral reflectance imaging4 and optical coherence tomography5 are both optical based imaging technology that provide unique signatures for disease but are still very much in the research phase. Terahertz imaging has also been used to image breast tissue samples from lumpectomies which have shown good contrast between diseased and healthy tissues;6 in this paper we further explore the ability of this technique to discriminate between tissue types. THz () frequency radiation lies between the millimeter and infrared regions of the electromagnetic (EM) spectrum. The THz regime is typically defined as the range 0.1 to 10 THz7 or in wavelength, 3 mm to 30 µm. The development of THz time-domain spectroscopy and imaging has led to commercial systems for use inside and outside the laboratory, which have found wide applications in security, manufacturing, pharmaceutical sciences, and nondestructive testing.8–11 Early experiments demonstrated that THz could have biomedical applications with images of porcine tissue displaying contrast between muscle and fat.12 THz imaging has also been used to reveal contrast between regions of healthy skin and basal cell carcinoma, the most common form of skin cancer, in vitro13 and in vivo.14 This has led to the development of a proto-type handheld (intraoperative) THz imaging probe with potential for use during breast surgery.15,16 Other published work has shown17 that THz can detect dysplastic changes (pre-cancer) in excised colon tissue and the THz data have been correlated to histopathologic images using stains that show angiogenesis related changes. New blood vessels (angiogenesis) are known to be “leaky” and thus more interstitial fluid is present, leading to increased absorption of the THz signal.18 The purpose of this study was to investigate the feasibility of using terahertz measurements to differentiate tumor and normal tissue in freshly excised human breast tissue. Because terahertz imaging produces large volumes of data, due to the spatial and temporal components both being recorded, we investigated data reduction methods prior to classification. THz images have typically been formed using a range of parameters (or features), derived from the pulse or spectral profiles.19–21 We compare this heuristic approach to data reduction with an unsupervised method that has traditionally been used in other areas, principal component analysis (PCA).22–24 PCA is well suited for this purpose as it provides a theoretically optimal linear reduction, which requires no underlying assumptions about the statistical nature of the data.25 In this study, the PCA method was applied to the THz pulses directly. However, there is some evidence in the literature to suggest that PCA may demonstrate improved performance on discretized data26 compared with the continuous representation of THz pulses. To investigate this hypothesis and to aid feature selection in relation to the THz data, we also applied PCA to the parameter data space as a subsequent method of data reduction and applied classification to this reduced data set. Classification for this study was performed using the support vector machine (SVM) classification algorithm. This technique is well suited to finding complicated decision boundaries and has been used with good effect with THz data sets.27,28 SVM is a relatively recent method29 that has been shown to be more robust and superior at separating higher-order nonlinear features when compared with methods such as linear discriminate analysis and partial least squares discrimination analysis.30 2.Materials and Methods2.1.Patients and Specimen PreparationBreast tissue was studied from 51 random, nonconsecutive patients (patient age range, 39 to 80 years; mean age, 59 years) undergoing either wide local excision (WLE) or mastectomy at Addenbrooke’s Hospital in Cambridge and Guy’s Hospital in London.6 Approval for the study was granted by the respective Research Ethics Committees; signed informed consent, agreeing to research on tissue removed at the time of surgery, was obtained from all patients. All samples were fresh at the time of measurement. Samples were first inked according to a standard pathology protocol so that margins could be identified during examination of the slides. They were then sliced to expose any palpable lesion; slices were typically thick. If there was no palpable tumor the specimen was sliced through suspected regions of tumor identified from the radiographs of the excised sample. 2.2.Data AcquisitionData from all breast specimens were collected using TPIscan (TeraView Ltd., Cambridge, UK). The system uses photoconductive methods to generate and detect terahertz pulses in reflection mode.31 A detailed description of the system is given by Wallace et al.32 The data were collected over an area that was typically 20 mm by 20 mm, consisting of 75 × 75 pixels, and took less than 5 min to acquire. At each pixel position an entire THz waveform was acquired. The orientation of the sample on the imaging window and location of the inked boundaries were recorded and a photograph was taken by a camera within the system so that the THz image could later be correlated with the histology section. After imaging, all samples were prepared routinely by being formalin fixed, wax embedded, and then sliced and mounted onto histology slides and stained. A terahertz impulse function was obtained from each raw terahertz waveform by deconvolving the system response as described in Ref. 33. Each impulse function, referred to as a THz pulse, contained 512 time-domain points which covered a time range of 33.8 ps. 2.3.Correlation of Terahertz Images with HistologyThe histology was read by a pathologist and all areas of pathology (tumor, normal tissue, adipose, fibrosis, etc.) were identified along with inked margins and other landmarks. The histology was then oriented to the THz images in an image-processing package so that the areas of pathology could be mapped directly onto the THz images. An example to demonstrate the orientation of the terahertz image with histology is given in Fig. 1. Fig. 1Correlation of terahertz image with histology. The scale facilitates size correction, and inks and photographs enable orientation. 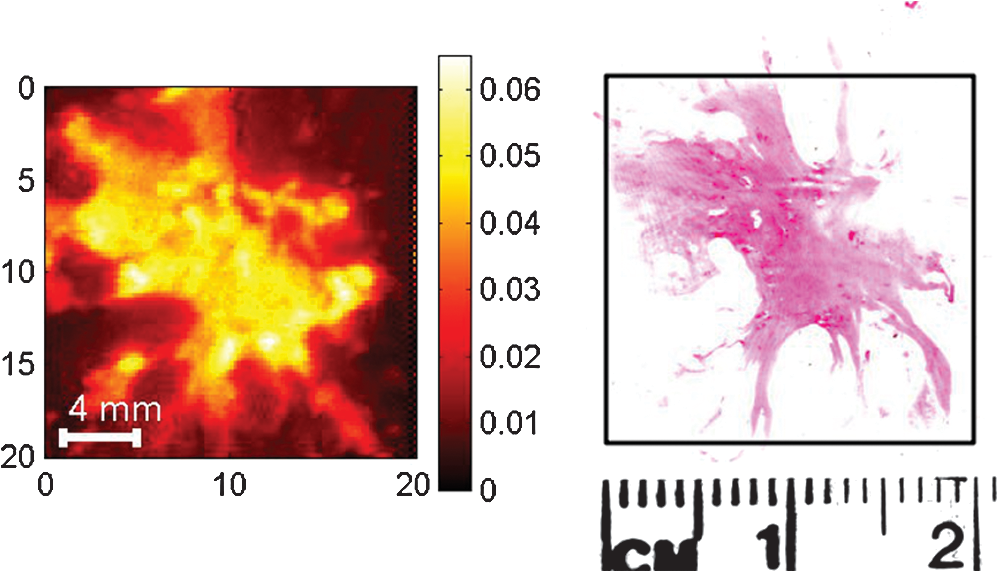 This mapping enabled the regions of the terahertz image to be identified and grouped as normal, tumor, or alternative pathologies. Regions of interest within each image were then applied to extract terahertz pulses with each type of pathology. These extracted pulses were grouped into a database containing pulses grouped as normal, tumor, and other pathologies. The database contained 31,236 pulses from normal tissue and 30,405 pulses from tissue with tumor. These pulses from the database were used in the subsequent data reduction and classification algorithms. 2.4.Data Dimensionality Reduction and ClassificationGiven the large numbers of pulses and number of values for each pulse (512 data points) it was important for the application of classification techniques to reduce the dimensionality of the data and the size of the entire data set. Data dimensionality reduction was explored in two ways. The first method used parameters, often applied in THz imaging, that were heuristic and based on characteristics of the terahertz pulse in the time and frequency domains.21 The second method made use of the well-known unsupervised method, PCA. Classification, for outputs of all data reduction techniques was performed using the SVM classification algorithm. 2.5.Data Reduction Method 1: THz Image ParametersTHz data can be represented in either the time-domain or, through Fourier transform, in the spectral domain. The mean time-domain pulses for the dataset for normal and tumor tissue, together with their power spectra, are shown in Fig. 2 to illustrate the often subtle differences between the two. Fig. 2The mean pulses for normal fibrous tissue (black line) and tumor (grey line) in the (a) time-domain and (b) frequency domain. 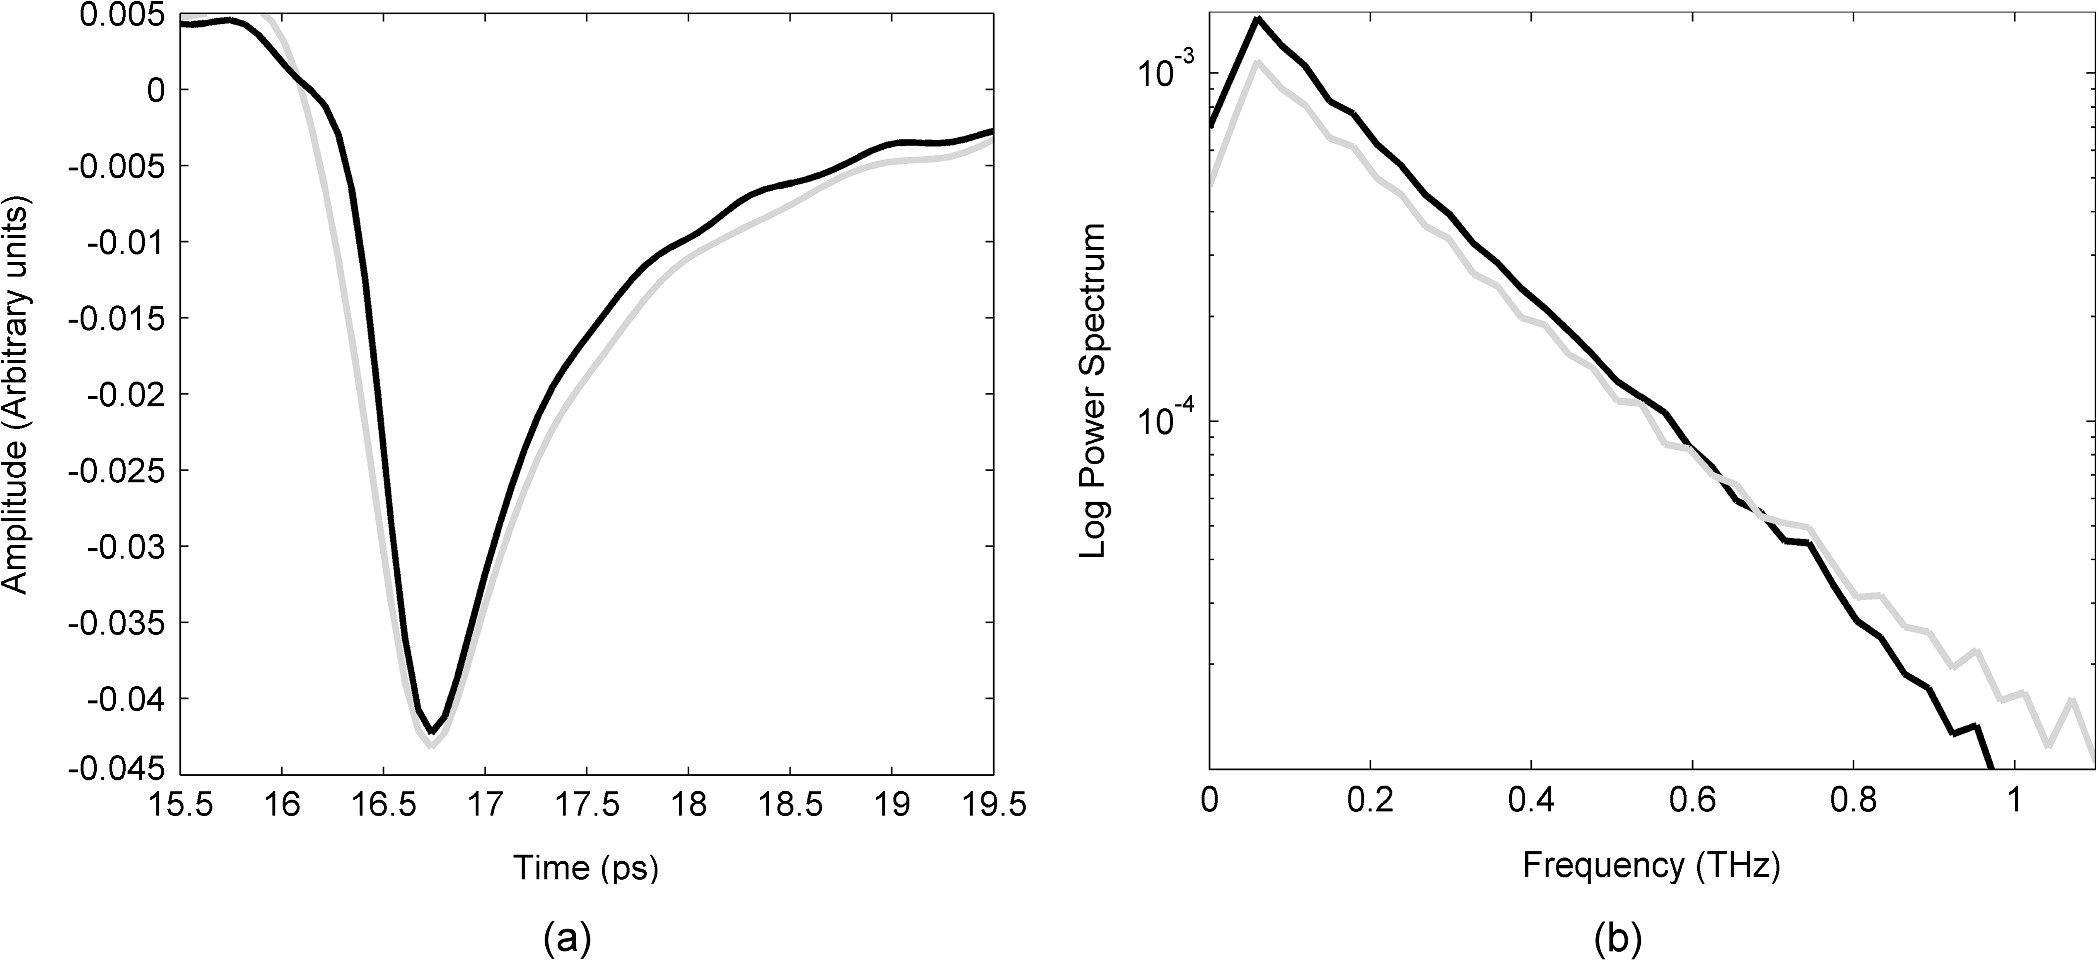 Ashworth and colleagues34 performed THz spectroscopy measurements on normal and tumor breast tissue which they entered into a computer model35 to simulate pulses which showed very similar profiles to those in Fig. 2. It appears that physical and biochemical changes in the tissue lead to changes in the dielectric properties that affect the absorption coefficient and refractive index across the entire frequency range in such a way that the pulse shape is altered with broadening and retardation after reflection from tumor tissue, when compared with normal tissue. This is similar to what was found with THz data from basal cell carcinoma.36 Parameters can be derived from these pulses that can be used to characterize the response of the underlying tissue. Hence parameters that are sensitive to these changes in pulse shape will be useful in enabling differentiation of tumor from normal tissue with THz imaging. A large number of parameters may be derived from the THz pulses and spectra based on time or frequency domain characteristics. To reduce this number we used two steps. First we determined the optimal time and frequency index points at which these parameters could be evaluated, and secondly we removed any highly correlated parameters. To aid analysis and parameter calculation, all pulses were baseline corrected, and the peaks aligned in time. For the purposes of parameter definition, the term is defined as the amplitude at which the pulse is a minimum. All pulses are aligned in time so that occurs at the same time in the time range. The time at which occurs is defined as and is identically set to zero as the reference point on the time-domain axis. All time indices relating to the parameters are relative to this point unless otherwise specified. For many of the characteristics, such as the value of the amplitude of the pulse at a given time, there was a large range of time or frequency data points at which the parameter could be evaluated. For example, the amplitude of the pulse at a given time point could be evaluated at 512 possible time points over a time range of 33.8 ps. To refine the selection of optimal time and frequency points for classification, a receiver operator characteristics (ROC) analysis37–39 was performed on the time and frequency range for each dependent parameter. ROC is a fast and efficient method for determining the differentiation ability of each parameter, so it was suitable for determining the optimal parameters from the large number of time and frequency data. ROC determines discrimination ability by adjusting the discrimination threshold and plotting, for the range of threshold values, sensitivity, or true-positive rate (normals classified as normal), against 1-specificity, which is the false positive rate (tumors classified as normal). This produces a graph, and the area under the curve (AUROC), is a measure of the predictive power of each parameter. The higher the AUROC value the better the classification strength of that parameter. To demonstrate this procedure, Fig. 3 shows the ROC and AUROC for the parameter P7; the amplitude of the pulse parameter over a range of time indices. In this way, the best performing time index and frequency index points were chosen for parameters related to the values of the pulse or the spectra. Fig. 3ROC analysis to evaluate the discrimination ability of parameter P7, the amplitude of the pulse at a given time. (a) AUROC values, which are a measure of the discrimination ability, for the time range around the time at which the pulse is minimum (). From this analysis it can be seen that the time that gives the largest AUROC is , hence the amplitude at this time was used as a parameter feature. (b) The ROC curve for parameter P7 with the time index of . 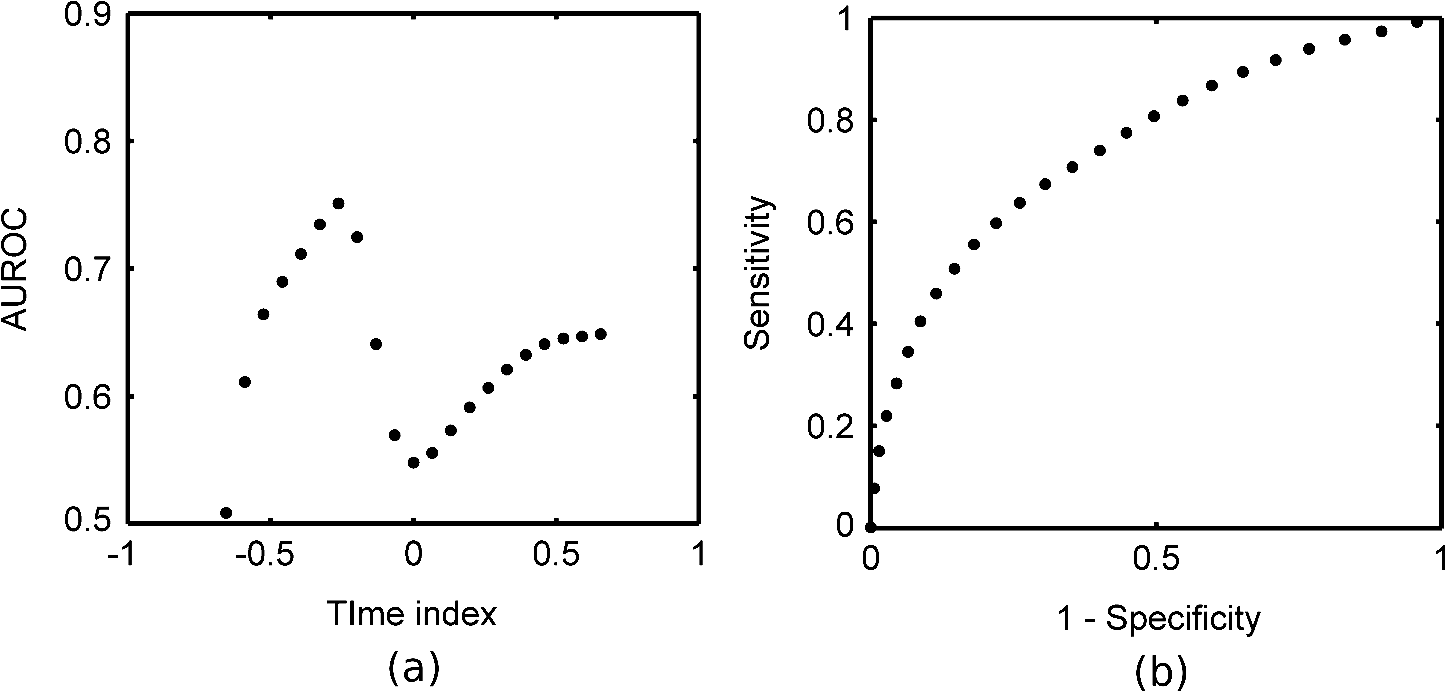 To determine independent parameters, the linear correlation coefficient was calculated between all parameters and the correlated parameters removed, leaving the better performing parameter, according to the AUROC. The ten remaining optimal and uncorrelated parameters were then used for classification with the SVM technique. Table 1 contains the list of parameters and their descriptions, whereas Fig. 4 illustrates an example terahertz time-domain pulse and power spectrum, with sections of the pulse that were curve-fitted by various functions to give parameters related to aspects of the pulse shape. Table 1Time-domain and frequency domain terahertz parameters for the ten parameter space.
Fig. 4(a) The sections of the pulse in the time-domain that were fitted with linear (section 1), quadratic (section 2) and exponential (section 3) functions in the time-domain. Section (1) was fitted with linear regression for parameter P4. Section (2) was fitted with a quadratic for parameter P5, whereas section (3) was fitted with an exponential for parameter P6. (b) For parameter P10, the log power spectrum was fitted with a linear fit.  The ten parameters (Table 1) were assessed for their individual ability to discriminate between normal and tumor pulse responses by applying the SVM classifier (Table 2). The values obtained from the SVM, given in Table 2, were then used to select the order in which parameters were added to the combinations of parameters that could give better classification than the individual parameters alone. It is not immediately obvious in which order parameters should be added in the subsequent combinations to give the optimal results. To investigate whether order was important we compared a number of different combinations. We compared combining two individual parameters that were the best performing, according to the individual SVM results, against combining two that were the worst performing. The combinations that used the best performing individual parameters always equaled or outperformed those using combinations of lower accuracy parameters (results not shown). With this justification we use the combinations formed by adding the individual parameters in order according to their classification accuracy from the SVM, starting with the best performing parameter, and adding one parameter at a time until all ten parameters were included in the combination. Results for the combinations of parameters are given in Table 3. Table 2Performance of the SVM on the parameter feature space.
Table 3Performance of the SVM on combinations of parameter features for method 1.
2.6.Data Reduction Method 2: PCA on Database PulsesPCA is a well-known unsupervised linear feature extraction algorithm traditionally used to reduce data dimensionality. It involves an orthogonal transformation of the feature space to form a set of uncorrelated values with each successive principal component having the highest variance possible under the orthogonality constraint. For the purposes of this study the Matlab implementation of PCA was used (MATLAB 7.7, The Mathworks Inc., Natick, MA, 2008). PCA was applied to the database of tumor and normal pulses. Combinations of the projections in the principal components were then used for classification with the SVM. The first combination used only the first principal component, the second combination used the first two principal components, and so on, up to the tenth combination which used the highest ten principal components. Results for the SVM classification on these ten combinations of principal components are given in Table 4. Table 4Performance of the SVM with increasing numbers of principal components from the time-domain THz pulses for method 2.
2.7.Data Reduction Method 3: PCA on Parameter Feature SpaceWith method 1, although we combined parameters in the order according to the individual accuracy from the SVM, there was no obvious optimal order in which to combine them. To investigate if there is a better grouping based on variation under the orthogonality constraint, we applied the PCA to the ten parameter space described in method 1. There is evidence in the literature to suggest that PCA performs better on discrete data, such as the parameter feature space, compared to time-domain waveforms such as the pulses used in method 2.26 Combinations of the principal components (PCs) from the highest 10 PCs were used for the SVM classification in the same manner as method 2. Results for the SVM classification on the PCs of the parameter space are given in Table 5. Table 5Performance of the SVM on the PCA parameter space for method 3.
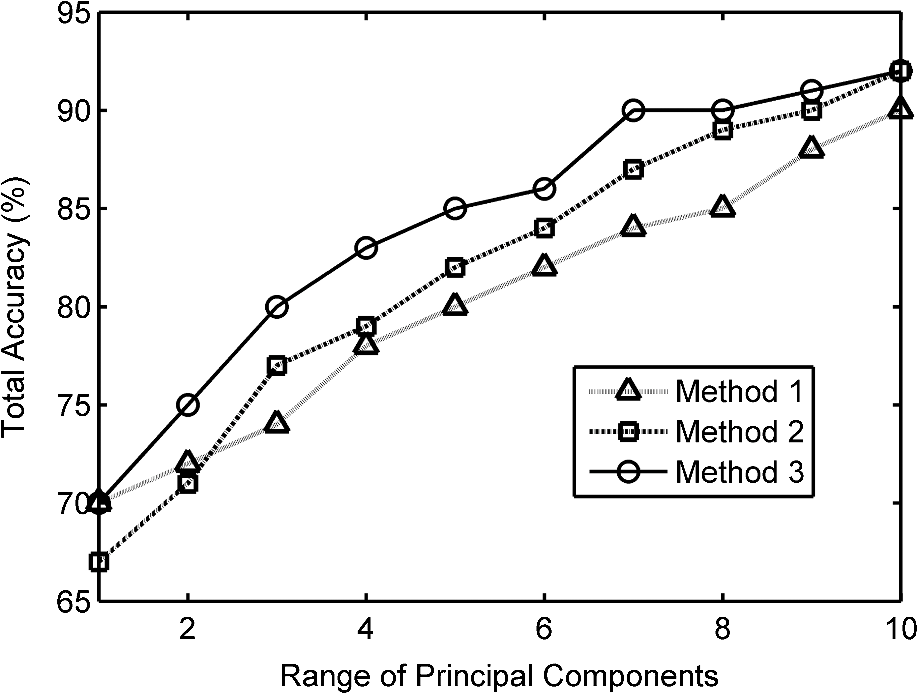
2.8.Classification of TPI Data by SVMAll classification was performed using the SVM algorithm to find decision boundaries between the classes in the reduced dimension feature spaces. This nonlinear classification function uses an iterative method to maximize the margin between the classes with an estimated optimal boundary by selecting a minimum number of support vectors.40 For SVM classification in this study we used the Matlab implementation developed by the researchers at the National Taiwan University41 with the radial basis function. The kernels and coefficients were optimized by grid search for each of the methods, giving optimized cost and gamma coefficients of 32 and 128, respectively for methods 1 and 3, the parameter space and PCA of the feature space; and 8 and 8 for method 2, the PCA on the pulses. The SVM was trained on 75% of the normal and tumor database pulses, randomly selected, and tested on the other 25%. From the SVM, we obtained the total overall classification percentage accuracy, as well as the accuracy rates for classifying tumor and normal pulses. The precision or error on the classification accuracy, which is dependent on sample size and the desired confidence limit, is given by Fisher and van Belle42 as: where is the total number of cases, is the number of correctly classified cases, and comes from the normal distribution table.43 In this work, all classification accuracys are quoted with a 99% confidence limit, giving .3.Results3.1.Method 1: SVM Classification of Parameter FeaturesThe ten parameters used for classification are compared in Table 2 for their ability to classify tumor and normal tissue from THz pulses. It is apparent that certain parameters more accurately identify tumor tissue than normal tissue, for example parameters 1 and 2, and vice versa (e.g., parameters 8 and 9). Combinations of parameters clearly perform better at classifying tumor and normal tissue than single parameters alone, and the more parameters used in a combination, the better classification accuracy as shown in Fig. 5. 3.2.Method 2: Classification of PCA for THz PulsesThe first principal component of the database pulses was compared with the difference between the mean database normal and tumor THz pulses. As might be expected, the highest variance principal component had a very similar profile to the difference between the mean tumor and normal THz pulses (Fig. 6). The first three principal components are illustrated in Fig. 7, showing the importance of the region around the pulse minimum and the decay, accompanied with pulse broadening on either side as observed in the parameter space. Table 4 shows that the SVM classification accuracy increases for greater numbers of PCs. Fig. 5 shows that the increase in the classification accuracy is largest for the first three PCs, which contribute the most to the overall variance, and then increases steadily with the addition of the next seven PCs. This continued increase could be due to the contribution of variation on the pulse being spread widely across all ten PCs. 3.3.Method 3: Classification of PCA for THz ParametersTable 5 shows the SVM classification accuracy for the PCA on the parameter space. Again, increasing numbers of PCs leads to improved classification accuracy. Also, as before, the first three PCs contribute the most to the overall variance (80%), and therefore contribute to the classification accuracy. However, after these first three PCs, the subsequent PCs appear to contribute less to the overall variance, and hence classification. 4.DiscussionIn all three data reduction methods, the number of correctly classified pulses increased when using more PCs, as would be expected. Fig. 5 compares the three methods. Method 3, the PCA on parameters, performed better overall than method 2, the PCA on pulses, whereas method 1, the parameter combinations, gave the lowest accuracy overall after three or more features were combined. For method 1, the parameter space, classification improved almost linearly with increasing numbers of parameter combinations, whereas methods 2 and 3, involving principal components, displayed a faster increase in accuracy due to the improved contribution of the high-order PCs when only a few were used. The fast increase observed for method 3 appears to come from the strong contribution of the first three principal components, while the slower linear rise of method 2 reflects the more even spread of contributions to the variation of the PCs. Variation due to noise will affect the pulses and therefore parameter calculation and subsequently PCAs with varying degrees. Because the PCA, which uses variation for separability, deals with the highest-order variations, it should somewhat filter the effect of noise compared with the parameter calculation, which will be more sensitive. Another source of variation in the data is interpatient variability. As shown from other work published on colon tissue,44 the natural biological variation in parameter values for normal tissue between patients can be large. This biological variation of normal values from patient-to-patient can be larger than the difference in normal and tumor parameter values for a given individual. This implies that pooling the data into a single database to be used for analysis can introduce discrepancies in the classification depending on the individual patient’s original normal value in the range of the database. Given this biological variation, there are two approaches that can be taken; one is to still use a database, but to establish the location of the patient’s normal values relative to the established database values, and then use the equivalent tumor range. A second approach is to limit the analysis to only data from within a patient’s measurements for classification. This would involve establishing the patient normal range within the known normal, nonpathologic tissue, and then to base classification on the changes beyond this normal range. 4.1.Classification of THz Image Data Using SVMAs a visual demonstration of the classification technique we apply the data reduction and classification to several example images. During breast surgery the intraoperative THz probe will be used to classify pulses and not form images as such. However, the exercise of forming and classifying pixels in images can inform the practical development of portable clinical devices based on THz technology, for example the intraoperative breast probe. Because data reduction method 3, the PCA on the parameter feature space using 10 PCs, leads to best classification accuracy, this method was used in the images. Training of the SVM model was done using the PCA results from all pulses in the database. The SVM output was a probability that each pixel in the image was tumor or normal. The values near 1 represented the probability that the pixel was classified by the SVM model as tumor, whereas a value near zero represented tissue classified as normal. Prior to data reduction and classification, there were two structures in the images that were excluded from the analysis. These were the adipose tissue, and gaps in the tissue due to the internal structure or damage due to the slicing of the tissue. These regions were determined by an algorithm that identified them through their pulse shapes, which are very different to normal fibrous and tumor pulses. To represent the results, a classification probability map was plotted, with a neutral background for all pixels that were calculated to be adipose or gaps; these results are presented in Fig. 8. Fig. 8Demonstration of SVM classifications on example THz images of breast tissue. Probability maps (top row), obtained from the SVM classification using the PCA on the parameter space are displayed with red representing the probability that the pixel is tumor, whereas green represents the probability from the SVM that the pixel is normal. Adipose and gaps in the tissue are removed from the analysis and shown as white background. The bottom row shows the corresponding histology for the various cases (a) normal tissue, (b) normal tissue, (c) mixed normal tissue and multifocal tumor (invasive ductal and DCIS), (d) mixed normal and tumor (invasive lobular), (e) tumor (invasive lobular), (f) tumor (invasive ductal), and (g) tumor (invasive ductal and necrosis). The square box around the classification maps and histology represents 20 mm by 20 mm.  Adipose tissue can be easily identified and removed in images with a simple algorithm, because the pulse shape due to its refractive index and absorption34 is so different to normal or tumor fibrous tissue. However, at the border of adipose and fibrous tissue, an edge effect occurs that is more complicated to deal with in classification. At this border, the pulse shape undergoes a transition where the finite dimension of the THz pulse profile samples a portion of both adipose and fibrous tissues. This edge has been observed with other THz imaging applications45,46 and is frequency dependent because the beam diameter, and therefore resolution, is smaller at higher frequencies.47 This distortion of the recorded pulse shape leads to features not recognized in the classification database, and hence not well classified by the algorithms. It may be possible to train the SVM classifier for edges to deal with these features; however, in practice this may not be necessary as it does not appear to affect the classification significantly. In the few cases where it does appear to be an issue, for example in case 2, the edge is mostly misclassified on the top or side edges, suggesting there is a directional component, probably due to the 30-deg angle of incidence of the THz pulse.48 In practice with the concept of the intraoperative probe, the angle of incidence is much lower, approximately 5 deg, so the effect is likely to be less profound. However, if the effect remains and causes ambiguity, the surgeon would simply be able to change the orientation and determine if it is an edge effect or not. There is also a second type of edge effect present in case 1, whereby the edge of the tissue presents a discontinuous boundary. It occurs in this case because the tissue has been removed by incision and has edges that are thin compared to the thicker central portion. This type of edge effect would not normally occur during surgery in situ as the surrounding breast tissue would still be intact. The combination of the discontinuous edge and thin profile in the third dimension produced an altered profile not accounted for in the database. In general the image pixels appear to be well classified. In most cases there appear to be small numbers of pixels, around 10% to 15%, misclassified, which is similar to the accuracy rate seen in the classification algorithm on the database pulses. In some images however, e.g., case 6, nearly all the pixels are misclassified, highlighting the importance of considering interpatient variability in this approach. 5.ConclusionWe have shown that using appropriate data reduction methods based on parametric features and/or PCs on THz signals reflected from freshly excised breast cancer tissue, when compared with histopathology, can be classified with accuracies up to 92%. Previous successful studies on THz imaging of cancer tissues have led to development of a THz probe for use intraoperatively, which is currently undergoing clinical trials. This paper provides further evidence for the efficacy of the technique and points to methods to improve classification of signals obtained by the probe. However, there are several challenges to using this technique during surgery, such as the presence of blood and other fluids in the region, maintaining good contact of the probe with the breast tissue, and interpatient variability. Although the presence of blood and other fluids can be managed during surgery, e.g., through cauterization, this may also affect the THz response of the tissue to a varying degree and thus will require further study. Other factors, such as tissue hydration and temperature of in vivo tissue, may remove some of the variability seen in ex vivo tissue measurements. To date, the temperature and hydration of ex vivo tissue specimens measured were allowed to equilibrate with ambient conditions which may vary from day-to-day. As the THz response of tissue is strongly influenced by the presence of water and water itself has a temperature dependent THz response,49 it is possible that these factors may have introduced some variability between specimens in an ex vivo setting. In the case of in vivo measurements, the hydration and temperature of tissue being measured is probably more stable in the surgical environment. The use of a sterile sheath on a THz probe to prevent cross-contamination between patients is likely to introduce a systematic offset in the THz response of the tissue. This will in turn affect the values of the parameters calculated prior to application of the classification algorithm, and so it may be necessary to redefine the loading values of the parameters before the technique can be applied directly in surgery. This paper has shown that THz responses from breast tissue can be classified with data reduction methods and classification algorithms with an encouraging degree of accuracy, which may be improved further when allowing for patient-to-patient variability and tissue boundary transitions. AcknowledgmentsP. Ashworth acknowledges funding from EPSRC and TeraView. This work was supported by the Australian Research Council, grant No. DP1096514. ReferencesA. Jemalet al.,
“Cancer statistics, 2008,”
Ca-a Cancer J. Clin., 58
(2), 71
–96
(2008). http://dx.doi.org/10.3322/CA.2007.0010 CAMCAM 0007-9235 Google Scholar
R. G. Pleijhuiset al.,
“Obtaining adequate surgical margins in breast-conserving therapy for patients with early-stage breast cancer: current modalities and future directions,”
Ann. Surg. Oncol., 16
(10), 2717
–2730
(2009). http://dx.doi.org/10.1245/s10434-009-0609-z 1068-9265 Google Scholar
J. R. Harriset al., Diseases of the Breast, Lippincott, Williams & Wilkins, Philadelphia
(2004). Google Scholar
W. P. ZhuX. R. Xin,
“Study on the distribution pattern of skin temperature in normal Chinese and detection of the depth of early burn wound by infrared thermography,”
in Occupational Electrical Injury: An International Symposium,
300
–313
(1999). Google Scholar
S. A. Boppartet al.,
“Optical coherence tomography: feasibility for basic research and image-guided surgery of breast cancer,”
Breast Cancer Res. Treat., 84
(2), 85
–97
(2004). http://dx.doi.org/10.1023/B:BREA.0000018401.13609.54 BCTRD6 0167-6806 Google Scholar
A. J. Fitzgeraldet al.,
“Terahertz pulsed imaging of human breast tumors,”
Radiology., 239
(2), 533
–540
(2006). http://dx.doi.org/10.1148/radiol.2392041315 RADLAX 0033-8419 Google Scholar
D. AbbottX. C. Zhang,
“Scanning the issue: T-ray imaging, sensing, and retection,”
Proc. IEEE, 1509
–1513
(2007). http://dx.doi.org/10.1109/JPROC.2007.900894 IEEPAD 0018-9219 Google Scholar
P. H. Siegel,
“Terahertz technology in biology and medicine,”
IEEE Trans. Microwave Theory Tech., 52
(10), 2438
–2447
(2004). http://dx.doi.org/10.1109/TMTT.2004.835916 IETMAB 0018-9480 Google Scholar
V. P. Wallaceet al.,
“Terahertz pulsed imaging and spectroscopy for biomedical and pharmaceutical applications,”
Faraday Discussions,, 126 255
–263,
(2004). http://dx.doi.org/10.1039/B309357N FDISE6 0301-7249 Google Scholar
V. P. Wallaceet al.,
“Three-dimensional imaging of optically opaque materials using nonionizing terahertz radiation,”
J. Opt. Soc. Am. A-Opt. Image Sci. Vis., 25
(12), 3120
–3133
(2008). http://dx.doi.org/10.1364/JOSAA.25.003120 1084-7529 Google Scholar
E. Pickwellet al.,
“A comparison of terahertz pulsed imaging with transmission microradiography for depth measurement of enamel demineralisation in vitro,”
Caries Res., 41
(1), 49
–55
(2007). http://dx.doi.org/10.1159/000096105 CAREBK 0008-6568 Google Scholar
D. ArnoneC. CieslaM. Pepper,
“Terahertz imaging comes into view,”
Phys. World., 13
(4), 35
–40
(2000). PHWOEW 0953-8585 Google Scholar
R. M. Woodwardet al.,
“Terahertz pulse imaging of ex vivo basal cell carcinoma,”
J. Invest. Dermatol., 120
(1), 72
–78
(2003). http://dx.doi.org/10.1046/j.1523-1747.2003.12013.x JIDEAE 0022-202X Google Scholar
V. P. Wallaceet al.,
“Terahertz pulsed imaging of basal cell carcinoma ex vivo and in vivo,”
Br. J. Dermatol., 151
(2), 424
–432
(2004). http://dx.doi.org/10.1111/bjd.2004.151.issue-2 BJDEAZ 1365-2133 Google Scholar
P. Ashworthet al.,
“An intra-operative thz probe for use during the surgical removal of breast tumors,”
IEEE, Pasedena, California
(2008). Google Scholar
A. F. Vincent Wallaceet al.,
“Development of an intra-operative THz imaging probe for breast conserving surgery,”
IEEE, Cardiff, UK
(2007). Google Scholar
C. B. Reidet al.,
“Terahertz pulsed imaging of freshly excised human colonic tissues.,”
Phys. Med. Biol., 56
(14), 4333
–4353
(2011). http://dx.doi.org/10.1088/0031-9155/56/14/008 PHMBA7 0031-9155 Google Scholar
D. A. I. FukumuraR. K. Jain,
“Imaging angiogenesis and the microenvironment,”
APMIS., 116
(78), 695
–715
(2008). http://dx.doi.org/10.1111/apm.2008.116.issue-7-8 APMSEL 0903-4641 Google Scholar
T. Loffleret al.,
“Visualization and classification in biomedical terahertz pulsed imaging,”
Phys. Med. Biol., 47
(21), 3847
–3852
(2002). PHMBA7 0031-9155 Google Scholar
A. J. Fitzgeraldet al.,
“An introduction to medical imaging with coherent terahertz frequency radiation,”
Phys. Med. Biol., 47
(7), R67
–84
(2002). http://dx.doi.org/10.1088/0031-9155/47/7/201 PHMBA7 0031-9155 Google Scholar
R. M. Woodwardet al.,
“Terahertz pulse imaging in reflection geometry of skin tissue using time domain analysis techniques,”
in Clin. Diagnos. Syst.: Technol. Instrument.,
160
–169
(2002). Google Scholar
H. Hotelling,
“Analysis of a complex of statistical variables into principal components.,”
J. of Educat. Psychol., 24
(6), 417
–441
(1933). http://dx.doi.org/10.1037/h0071325 0022-0663 Google Scholar
J. E. Jackson, A User’s Guide to Principal Components, John Wiley & Sons, Inc., Hoboken, NJ,
(2004). Google Scholar
J. Hutchingset al.,
“The potential for histological screening using a combination of rapid raman mapping and principal component analysis,”
J. Biophoton., 2
(12), 91
–103
(2009). http://dx.doi.org/10.1002/jbio.v2:1/2 JBOIBX 1864-063X Google Scholar
I. T. Jolliffe, Principal Component Analysis, Springer, New York
(2002). Google Scholar
V. C. Chen,
“Evaluation of bayes, ICA, PCA and SVM methods for classification,”
(2004). Google Scholar
X. Yinet al.,
“Support vector machine applications in terahertz pulsed signals feature sets,”
IEEE. Sens. J., 7
(11–12), 1597
–1608
(2007). ISJEAZ 1530-437X Google Scholar
J. L. ShenR. PanS. S. Zhao,
“Terahertz spectra applications in identification of illicit drugs using support vector machines,”
Proc. Eng., 7 15
–21
(2010). PERNBE 1877-7058 Google Scholar
V. Vapnik, The Nature of Statistical Learning Theory, Springer, New York, London
(1995). Google Scholar
M. Sattleckeret al.,
“Investigation of support vector machines and raman spectroscopy for lymph node diagnostics,”
Analyst (Amsterdam)., 135
(5), 895
–901
(2010). ANLYAG 0365-4885 Google Scholar
R. M. Woodwardet al.,
“Terahertz pulse imaging in reflection geometry of human skin cancer and skin tissue,”
Phys. Med. Biol., 47
(21), 3853
–3863
(2002). http://dx.doi.org/10.1088/0031-9155/47/21/325 PHMBA7 0031-9155 Google Scholar
V. P. Wallaceet al.,
“Terahertz pulsed imaging and spectroscopy for biomedical and pharmaceutical applications,”
Faraday Discuss., 126 255
–263
(2004). FDISE6 1359-6640 Google Scholar
B. E. Coleet al.,
“Terahertz imaging and spectroscopy of human skin in vivo,”
Proc. SPIE., 4276 1
–10
(2001). http://dx.doi.org/10.1117/12.428010 PSISDG 0277-786X Google Scholar
P. C. Ashworthet al.,
“Terahertz pulsed spectroscopy of freshly excised human breast cancer,”
Opt. Exp., 17
(15), 12444
–12454
(2009). http://dx.doi.org/10.1364/OE.17.012444 OPEXFF 1094-4087 Google Scholar
E. Pickwellet al.,
“Simulation of terahertz pulse propagation in biological systems,”
Appl. Phys. Lett., 84
(12), 2190
–2192
(2004). http://dx.doi.org/10.1063/1.1688448 APPLAB 0003-6951 Google Scholar
E. Pickwellet al.,
“Simulating the response of terahertz radiation to basal cell carcinoma using ex vivo spectroscopy measurements,”
J. Biomed. Opt., 10
(6),
(2005). http://dx.doi.org/10.1117/1.2137667 JBOPFO 1083-3668 Google Scholar
C. E. Metz,
“Basic principles of roc analysis,”
Semin. Nucl. Med, 8
(4), 283
–298
(1978). http://dx.doi.org/10.1016/S0001-2998(78)80014-2 SMNMAB 0001-2998 Google Scholar
M. H. ZweigG. Campbell,
“Receiver operating characteristic (roc) plots—a fundamental evaluation tool in clinical medicine (vol 39, pg 561, 1993),”
Clin. Chem., 39
(8), 1589
–1589
(1993). CLCHAU 0009-9147 Google Scholar
V. P. Wallaceet al.,
“Spectrophotometric assessment of pigmented skin lesions: Methods and feature selection for evaluation of diagnostic performance,”
Phys. Med. Biol., 45
(3), 735
–751
(2000). http://dx.doi.org/10.1088/0031-9155/45/3/312 PHMBA7 0031-9155 Google Scholar
C. CortesV. Vapnik,
“Support-vector networks,”
Mach. Learn., 20
(3), 273
–297
(1995). MALEEZ 0885-6125 Google Scholar
C.-J. L. Chih-Chung Chang,
“Libsvm: A library for support vector machines,”
(2007) http://www.csie.ntu.edu.tw/~cjlin/libsvm/ Google Scholar
L. D. FisherG. van Belle, Biostatistics: A Methodology for the Health Sciences, John Wiley & Sons(1993). Google Scholar
D. G. Altman, Practical Statistics for Medical Research, Chapman & Hall(1992). Google Scholar
C. B. Reidet al.,
“Terahertz pulsed imaging of freshly excised human colonic tissues,”
Phys. Med. Biol., 56
(14), 4333
–4353
(2011). http://dx.doi.org/10.1088/0031-9155/56/14/008 PHMBA7 0031-9155 Google Scholar
J. F. Federiciet al.,
“Thz imaging and sensing for security applications—explosives, weapons and drugs,”
Semicond. Sci. Tech., 20
(7), S266
–S280
(2005). http://dx.doi.org/10.1088/0268-1242/20/7/018 SSTEET ‘0268-1242 Google Scholar
T. Loffleret al.,
“Terahertz dark-field imaging of biomedical tissue,”
Opt. Exp., 9
(12), 616
–621
(2001). http://dx.doi.org/10.1364/OE.9.000616 OPEXFF 1094-4087 Google Scholar
A. J. Fitzgeraldet al.,
“Evaluation of image quality in terahertz pulsed imaging using test objects,”
Phys. Med. Biol., 47
(21), 3865
–3873
(2002). http://dx.doi.org/10.1088/0031-9155/47/21/326 PHMBA7 0031-9155 Google Scholar
R. M. Woodwardet al.,
“Terahertz pulsed imaging of skin cancer in the time and frequency domain,”
J. Biol. Phys., 29
(2–3), 257
–261
(2003). JBPHBZ 0092-0606 Google Scholar
C. Ronneet al.,
“Investigation of the temperature dependence of dielectric relaxation in liquid water by thz reflection spectroscopy and molecular dynamics simulation,”
J. Chem. Phys., 107
(14), 5319
–5331
(1997). http://dx.doi.org/10.1063/1.474242 JCPSA6 0021-9606 Google Scholar
|
|||||||||||||||||||||||||||||||||||||||||||||||||||||||||||||||||||||||||||||||||||||||||||||||||||||||||||||||||||||||||||||||||||||||||||||||||||||||||||||||||||||||||||||||||||||||||||||||||||||||||||||||||||||||||||||||||||||||||||||||||||||