|
|
1.IntroductionOptoacoustic imaging is an emerging modality in which optical absorption is detected acoustically exploiting the photoacoustic effect, whereby the transient deposition of light energy gives rise to mechanical waves.1,2 The primary advantage of this approach over pure optical imaging is that resolution does not degrade as fast with increased penetration depth, because the scattering of ultrasound in tissue is orders of magnitude lower than that of light. In particular, MSOT uses multiple excitation wavelengths to obtain separate images of specific chromophores of interest including the oxygenation states of hemoglobin and optical probes such as fluorescent dyes and light absorbing nanoparticles.3–5 With the ability to detect hemoglobin states, anatomical optical contrast and molecular biomarkers in vivo, MSOT is well suited for cardiovascular imaging.6,7 Cardiovascular disease (CVD) is an important topic in imaging and studies of atherosclerosis and myocardial infarction are of major interest, both in small animals and clinical settings.8 The visualization of targeted dyes and nanoparticles at high resolution could enable unique insights into the mechanisms of CVD and therapeutic responses. For this reason, a significant portion of the literature on optoacoustic imaging describes imaging of the heart, ranging from implementations that require minutes to generate images at single wavelengths,1,9,10 to high frame-rate systems that capture only microscopic fields of view.7 We have recently demonstrated an implementation capable of producing transverse slices through the heart in mice from each laser pulse so that the myocardium can be distinguished from blood in the heart chambers.6 The high resolution made possible by MSOT, however, is degraded in cardiac imaging by motion caused by the heartbeat. While multielement ultrasound detection enables real-time optoacoustic imaging, the added spectral dimension needed for identifying specific spectral signatures of chromophores of interest comes with time delays, due to wavelength scanning, resulting in multiwavelength images captured at different stages of the cardiac cycle. The spectral unmixing of single frames from each wavelength can yield unpredictable results because of the arbitrary combination of stages of the cardiac cycle. An alternative approach could acquire several frames for each wavelength and then calculate the average, producing a blurred representation of all stages of the motion, and then apply spectral unmixing. We aim to improve the resulting motion-blurred MSOT images by automatically grouping or clustering images according to their similarities prior to spectral unmixing. Several established imaging modalities such as positron emission tomography (PET), single photon emission computed tomography (SPECT), computed tomography (CT), and magnetic resonance imaging (MRI) employ triggering, gating, or synchronization schemes that only activate data acquisition during the same stage of the cardiac cycle. This effect would be possible in MSOT imaging too, but would require heart monitoring systems and external triggering of the laser source, causing added complexity and increased acquisition times because the laser would not fire at the maximum possible rate. Instead, MSOT offers a significant advantage in that full frames can be acquired from each laser pulse. Therefore, motion correction of MSOT can also be considered in the context of grouping motion insensitive single frames into sets of images corresponding to similar time points in the cardiac cycle, with the aim of producing images with reduced motion blurring. To this end we considered a -means clustering algorithm to classify multiple images acquired at different wavelengths according to the stage of the cardiac cycle. After subsequent spectral unmixing, we compared the results to MSOT images obtained without clustering. 2.Materials and Methods2.1.Real-time MSOT Imaging SystemMeasurements were performed using an MSOT system described before.6,11 Briefly, the system acquires and reconstructs transverse slice images through mice in real-time at a rate of , governed by the laser repetition rate (10 Hz). An Nd:YAG laser pumps an optical parametric oscillator (OPO) to provide tunable near-infrared pulses of approximately 10 ns duration. Incident fluence is kept below the maximum permissible exposure limits (ANSI Z136.1-2000). A 64-element piezocomposite transducer array with a 5 MHz center frequency detects optoacoustic signals (Imasonic SAS, Voray, France). The elements are arranged in a single row, forming a spherical concave array covering 172 deg underneath the animal with a mechanical focal distance of 4 cm. The dimensions of the transducer array allow it to be considered as being cylindrically focused on one transverse, cross-sectional slice through the imaged animal. The detected signals are digitized in parallel by a custom-built data acquisition system at and 12-bit resolution. The imaged animal lies horizontally (prone position for cardiac imaging) in a custom-built holder. The animal is thus centered around the focal point of the transducer array, and can be translated in the elevational direction by a linear stage to enable imaging of different transverse slices. The transducer array and the animal inside the holder are in an imaging chamber filled with temperature-controlled water for acoustic coupling. A thin polyethylene membrane prevents direct contact between the mouse and water. 2.2.Animal Handling and ImagingAnimal experiments were approved by the Government of Upper Bavaria (Germany) and carried out in accordance with institutional guidelines. We used 13-day-old CD1 mice, anesthetized with 2% isofluorane throughout the experiments. The mice were positioned so that a slice through the ventricles of the heart was imaged. We recorded 100 frames (single-pulse images) at each of the following excitation wavelengths: 700, 730, 760, 800, and 860 nm. Following experiments, mice were euthanized by spinal dislocation, frozen at and later sectioned for anatomical reference.12 2.3.Image Reconstruction and Cluster AnalysisEach of the single-pulse images recorded, i.e., 500 frames in total, were reconstructed using back projection.1 Then, a -means clustering algorithm was applied to the 100 reconstructed images for each wavelength employed to partition them into clusters. -means algorithms seek to minimize the sum of the distances from each datapoint to the mean of the cluster it is assigned to,13 i.e., where is the set of clusters , is the datapoint in question, and is the mean of the points in the cluster . Note that the distance measure used in this case is 1 minus the correlation. We used the standard MATLAB (The MathWorks Inc.) implementation of the algorithm (function means), which uses heuristics since the problem is generally non-deterministic polynomial-time hard (NP-hard). While it is possible set initial mean values or “seeds” according to manual selection of images, we chose initial values at random from the dataset, i.e., the algorithm was fully automatic. Clustering was performed with . This value is an intuitive case because the motion of the ventricles has two turning points: when the left ventricle is most contracted during ventricular systole, and when the left ventricle is most relaxed during diastole. Prior to clustering, the images were reduced to a manually selected region-of-interest (ROI) corresponding to the location of the heart. This was performed for two reasons: first, so that the motion of the heart would be the major contributor to clustering distances, and second, to reduce computation time. The image pixels inside the ROI were then converted into sequences of values for input into the -means algorithm. The total processing time, including loading all 500 frames with each and running the algorithm 5 times (once per wavelength), was approximately 7 s on a standard personal computer (PC). The images belonging to each resulting cluster were then averaged so that this separated data could be compared to the uncorrected case where all 100 frames were averaged.Linear spectral unmixing was applied to the multispectral data.5 We utilized the known spectra of oxy- and deoxyhemoglobin as well as a constant spectrum to account for measurement offsets and used least-squares to find the contribution of each spectrum to each pixel. This results in separate images for oxy- and deoxyhemoglobin contributions. 3.ResultsIn the single-pulse images we collected, the heart is visible and it is possible to distinguish the myocardium from the blood pool inside the ventricles (Fig. 1). By careful inspection of the images one can visually distinguish frames where the left ventricle is relaxed (diastole) from those where it is contracted (systole), as can be seen in the comparison of two selected frames in Fig. 1. Overall, the images also agree anatomically with the appearance of the myocardium in the corresponding mouse cryosection [Fig. 1(c)]. Fig. 1Single-pulse optoacoustic images of the heart at 860 nm excitation. LV: left ventricle, RV: right ventricle. (a) Selected image during diastole. (b) Selected image during systole. (c) Corresponding cryosection through the ventricles. 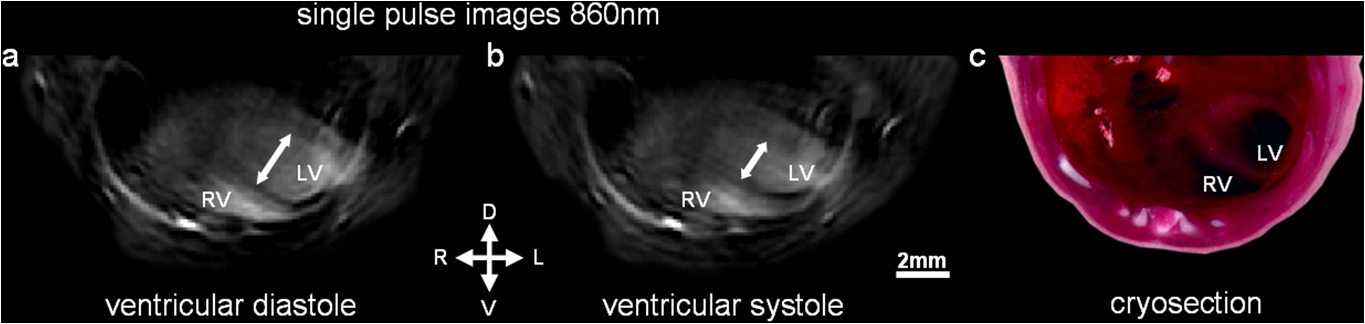 Clustering for each of the five wavelengths resulted in assignments where one cluster contained, on average, 57.8% of the total frames as summarized in Table 1. On inspection we found that the cluster to which the majority of the frames was assigned represented the diastole stage. This result is expected since it is well known that the duration of diastole is longer than systole. Table 1Amount of frames assigned to each cluster per wavelength.
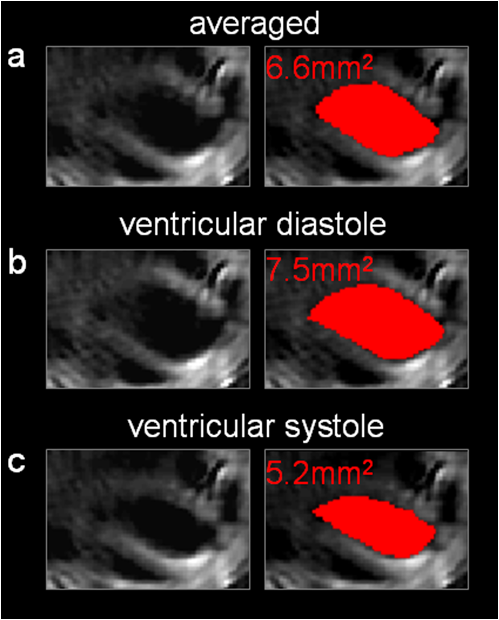
Of greater importance, however, are the results after spectral unmixing, i.e., taking all the wavelengths into account. By separately unmixing each of the two clusters, we obtained MSOT images for distinct stages in the cardiac cycle with reduced motion blurring as compared to the images when all frames were averaged (Fig. 2). From the images of deoxyhemoglobin contributions, we can resolve the outline of the left ventricle from the more oxygenated bloodpool. By comparing the unmixed images from the large cluster [Fig. 2(b)] with the smaller cluster [Fig. 2(c)], it is clear that clustering for each wavelength and subsequent spectral unmixing produced distinct images of diastole and systole respectively. The corresponding image without clustering [Fig. 2(a)] is a combination of both and therefore suffers from motion blurring. From a profile through these images [Fig. 2(d)] we observe that the averaged MSOT image over all frames is a mix of diastole and systole and loses some sharpness in the edges of the left ventricle compared to the images after clustering. Fig. 2Motion correction for unmixed deoxyhemoglobin contribution. (a) Unmixed image after all 100 images were averaged for each wavelength. (b) Unmixed image after averaging only the larger clusters for each wavelength. (c) Unmixed image after averaging only the smaller clusters for each wavelength. (d) Profile along red line through left ventricle in (a), comparing the images after clustering to the averaged (no clustering) image.  By manually segmenting ROI corresponding to the inside of the left ventricle, we were further able to estimate the areas enclosed by the myocardium (Fig. 3). The area inside the left ventricle is higher in the diastole image [Fig. 3(b): ] than in the systole image [Fig. 3(c): ]. The averaged (uncorrected) image yields a value between the two [Fig. 3(a): ]. These results serve to validate the motion correction clustering approach and indicate potential for the estimation of physiologically relevant cardiac parameters. 4.DiscussionWe have presented a method for dealing with (almost) periodic motion in real-time MSOT imaging of the heart. Our results in mice show that this method can cluster images according to the stage of the cardiac cycle to which they belong, allowing subsequent spectral processing to be performed separately for each stage, resulting in images with reduced motion blurring compared to when no clustering is performed in the process. Real-time imaging, or the formation of meaningful images from single laser pulses, is an important feature of MSOT in the context of motion correction. Since the acquisition time for optoacoustic signals resulting from a single pulse is less than 50 μs (for the dimensions of a mouse cross section), motion blurring in individual frames is low. Additionally, each frame is comparable to each other frame in a sequence, allowing simple clustering based on the correlation between single frames. The additional processing of 100 frames each at five wavelengths took approximately 7 s, indicating that the method has potential to be adapted for use during experiments: new frames could be clustered as they arrive, allowing a high-resolution live display. There are some compromises and limitations involved in resolving motion in MSOT imaging by clustering. Clearly, dividing frames into 2 clusters is the simplest correction possible. Increasing the number of clusters could further reduce motion blurring, but reducing the amount of frames per cluster would simultaneously reduce the signal-to-noise ratio, as there would be less signal averaging. Also, the ability of an algorithm to successfully perform clustering based on motion would be reduced with an increasing amount of clusters, because the distances between the clusters would drop. Generally, in an intuitive approach the number of clusters would be chosen to reflect the amount of motion and the number of components of motion (for example, two clusters for heartbeat and one for respiration) in the imaging scenario in question. The quality of the MSOT images of the heart presented here, in particular of the unmixed images in Fig. 2 where the entire myocardium of the left ventricle is visible, points to applications in CVD research where studies of myocardial infarction in small animal models can combine measures of hemoglobin concentration and oxygenation with distribution of optical molecular probes to gain multichannel, high-resolution insight into the pathology in vivo. While we have demonstrated the method in the context of cardiac imaging, it can be more generally applied to other anatomical regions and sources of motion, such as respiration. Similarly, there is no reason to restrict this method to small animal imaging: clinical applications of MSOT can equally be affected by motion from respiration, heartbeat, and pulse. We consider motion correction to be an essential part of MSOT imaging, since one of the primary advantages of the modality is its high spatial resolution, which can be degraded in vivo because of motion blurring. AcknowledgmentsD. Razansky acknowledges support from the German Research Foundation (DFG) Research Grant (Grant No. RA 1848/1) and the European Research Council (ERC) Starting Grant. V. Ntziachristos acknowledges support from the ERC Advanced Investigator Award and the German Ministry of Education (BMBF) Innovation in Medicine Award. ReferencesR. A. Krugeret al.,
“Thermoacoustic molecular imaging of small animals,”
Mol. Imag., 2
(2), 113
–123
(2003). http://dx.doi.org/10.1162/153535003322331993 1535-3508 Google Scholar
X. Wanget al.,
“Noninvasive laser-induced photoacoustic tomography for structural and functional in vivo imaging of the brain,”
Nat. Biotechnol., 21
(7), 803
–806
(2003). http://dx.doi.org/10.1038/nbt839 NABIF9 1087-0156 Google Scholar
M. L. Liet al.,
“Simultaneous molecular and hypoxia imaging of brain tumors in vivo using spectroscopic photoacoustic tomography,”
Proc. IEEE, 96
(3), 481
–489
(2008). http://dx.doi.org/10.1109/JPROC.2007.913515 IEEPAD 0018-9219 Google Scholar
V. NtziachristosD. Razansky,
“Molecular imaging by means of multispectral optoacoustic tomography (MSOT),”
Chem. Rev., 110
(5), 2783
–2794
(2010). http://dx.doi.org/10.1021/cr9002566 CHREAY 0009-2665 Google Scholar
D. Razanskyet al.,
“Multispectral optoacoustic tomography of deep-seated fluorescent proteins in vivo,”
Nat. Photon., 3
(7), 412
–417
(2009). http://dx.doi.org/10.1038/nphoton.2009.98 NPAHBY 1749-4885 Google Scholar
A. Taruttiset al.,
“Real-time imaging of cardiovascular dynamics and circulating gold nanorods with multispectral optoacoustic tomography,”
Opt. Express, 18
(19), 19592
–19602
(2010). http://dx.doi.org/10.1364/OE.18.019592 OPEXFF 1094-4087 Google Scholar
R. J. Zempet al.,
“Realtime photoacoustic microscopy of murine cardiovascular dynamics,”
Opt. Express, 16
(22), 18551
–18556
(2008). http://dx.doi.org/10.1364/OE.16.018551 OPEXFF 1094-4087 Google Scholar
F. A. JafferP. LibbyR. Weissleder,
“Molecular imaging of cardiovascular disease,”
Circulation, 116
(9), 1052
–1061
(2007). http://dx.doi.org/10.1161/CIRCULATIONAHA.106.647164 CIRCAZ 0009-7322 Google Scholar
K. H. SongL. V. Wang,
“Noninvasive photoacoustic imaging of the thoracic cavity and the kidney in small and large animals,”
Med. Phys., 35
(10), 4524
–4529
(2008). Google Scholar
H. P. Brechtet al.,
“Whole-body three-dimensional optoacoustic tomography system for small animals,”
J. Biomed. Opt., 14 064007
(2009). http://dx.doi.org/10.1117/1.3259361 JBOPFO 1083-3668 Google Scholar
A. Buehleret al.,
“Video rate optoacoustic tomography of mouse kidney perfusion,”
Opt. Lett., 35
(14), 2475
–2477
(2010). http://dx.doi.org/10.1364/OL.35.002475 OPLEDP 0146-9592 Google Scholar
A. SarantopoulosG. ThemelisV. Ntziachristos,
“Imaging the bio-distribution of fluorescent probes using multispectral epi-illumination cryoslicing imaging,”
Mol. Imag. Biol., 13
(5), 874
–885
(2010). 1536-1632 Google Scholar
A. K. JainM. N. MurtyP. J. Flynn,
“Data clustering: a review,”
ACM Comput. Surv. (CSUR), 31
(3), 264
–323
(1999). Google Scholar
|